In football money often talks, i.e. success on the pitch is almost invariably reserved for clubs that have spent the most on wages and transfer fees. However, it might be interesting to see which clubs have performed the best (and indeed worst) relative to their budget.
This thread will therefore look at how teams in the Premier League in 2021/22 performed relative to their wages, combined wages/player amortisation and squad cost. This is not an exact science, but just a bit of fun, as there are a few caveats to an analysis of this type.
First, I have used financial figures from the most recent published accounts, i.e. from 2020/21, so these are a year out of date compared to 2021/22 league position. Moreover, the last figures available for the 3 promoted clubs are from the Championship, so are under-stated.
In addition, wage bills are for all staff, so include administration, commercial, stewards, etc, as opposed to just the playing squad, Furthermore, player contracts are often highly incentivised, so wages at more successful clubs will be inflated by high bonus payments.
Finally, some clubs changed their accounting date in 2020/21, so their accounts only covered 11 months, mainly because the previous year included 13 months, due to 2019/20 season being extended for COVID delays. In these cases, I have annualised the wages for a fair comparison. 

Enough caveats, let’s look at some numbers. In 2020/21 four Premier League clubs reported wage bills over £300m, namely #MCFC £355m, #CFC £333m, #MUFC £323m and #LFC £314m. There was then a sizeable gap to #AFC £238m, #THFC £205m, #LCFC £192m and #EFC £183m.

Looking at wages per point, the clubs with best value for money were #BHAFC £2.1m, #WHUFC £2.3m, #NUFC £2.4m & Burnley £2.5m. Brentford ae also likely to be one of the best even after their wages increased in PL. In contrast, #MUFC £5.6m, #EFC £4.7m & #CFC £4.5m by far the worst.

Another way of ranking clubs’ performance is wages per league position, as this is what really counts (higher merit payment, European qualification, relegation). The way this is calculated is to give 20 points for 1st place, 19th for 2nd, etc, then divide wages by those amounts.
On this basis, the same clubs do best: Brentford, #BHAFC, #WHUFC and #NUFC, though worth noting #THFC impressive performance in 5th place. The three relegated clubs look bad on this metric, but this also highlights underperformance by #LUFC and particularly #EFC.

Clubs can also be ranked by comparing final league position with position implied by wage bill, as there is a strong correlation between wages and performance. Here #LFC shine, despite high wages, as they finished 2 places better, but their neighbours #EFC were 8 places worse.

However, the wage bill is only one element of squad investment, so for total cost we should also include player amortisation, which is the way that football clubs account for transfer fees.
Basically, football clubs consider players to be assets, so do not fully expense transfer fees in the year a player is purchased, but instead write-off the cost evenly over the length of the player’s contract via player amortisation.
So if a player is purchased for £25m on a 5-year contract, the annual amortisation in the accounts would be £5m, i.e. £25m divided by 5 years. This means that the player’s book value reduces by £5m a year, so after three years his value in the accounts would be £10m.

Five Premier League clubs booked more than £100m player amortisation in 2020/21 with #CFC leading the way with £162m, followed by #MCFC £146m, #MUFC £120m, #AFC £117m and #LFC (only) £108m. Worth noting that #EFC £81m was higher than #THFC £74m.


Player amortisation is a useful metric, but not perfect for a few reasons: (a) none for players signed on a free transfer; (b) zero for players developed by the Academy; (c) lower if contract length is longer; (d) can be reduced if a player’s contract is extended.
If we look at wages and player amortisation combined, #MCFC were still top of the Premier League with £500m, but #CFC £495m were not far behind. There was then a fair sized gap to #MUFC £443m, #LFC £422m, #AFC £355m and #THFC £279m.


Based on wages and player amortisation, Brentford £1.2m and #BHAFC £3.0m again score well on cost per point, though Burnley pop up in 3rd place. What’s maybe more interesting is the high amounts paid for each point by #MUFC £7.6m, #EFC £6.8m and #CFC £6.7m.

Again, the addition of player amortisation does not make too much difference to the ranking of clubs in terms of cost per league position, though this is where Burnley did less well. In other words, a club can be frugal, but relegation can sometimes be a high price to pay.

It’s much the same story when comparing league position with the amounts paid in wages and player amortisation. Three clubs finished exactly where implied by their finances, namely #MCFC (1st), #AFC (5th) and #CPFC (12th).

Finally, we can compare clubs in terms of their squad cost, based on the figures from club accounts (i.e. actual amounts paid including agent fees and signing-on fees), as opposed to the actual market value. These can be very different, e.g. Messi had zero value in Barca’s books.

Based on the accounts, two clubs competed with squads costing just under a billion: #MCFC £975m and #CFC £959m. The next highest were #MUFC £861m, #LFC £709m, #AFC £586m and #THFC £481m, though #EFC £451m were not too far behind.

Excluding clubs promoted from the Championship, the clubs with the cheapest squad cost per point were Burnley and #BHAFC (both £3.6m), followed by #LUFC £4.4m. Four clubs were higher than £10m: #MUFC £14.8m, #CFC £13.0m, #EFC £11.6m and #MCFC £10.5m.

The real stand-out for squad cost per league position is unfortunately #EFC with £90.2m, which is almost exactly six times as much as #BHAFC £15.3m. Last placed #NCFC were worst with £93.5m, but the next highest were #MUFC £57.4m and #CFC £53.3m.

In terms of league position against squad cost, the best performing of the “Big Six” were #LFC and #THFC, both 2 places better, while the worst performing were #MUFC, who were 3 places worse.

If we add together the rankings of all the metrics we have reviewed, we should have a fairly good idea of which clubs have outperformed , notwithstanding all the health warnings. In this way, we can say that the clubs who get most “bang for their buck” are Brentford and #BHAFC.
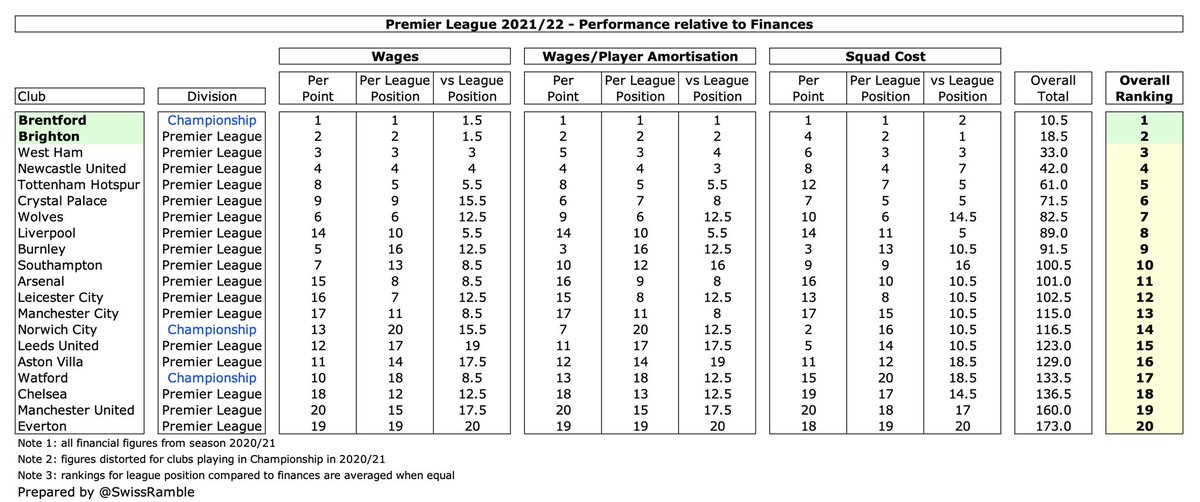
At the other end of the spectrum, the worst performing clubs in the Premier League, relative to money spent, were *drum roll* #EFC and #MUFC, though this will surely not come as news to their supporters.

Clearly, many fans will say that the only measurement that counts is the number of trophies won by their club, but it is instructive to see which clubs outperform their budget. It looks like the data-driven strategy employed by Brentford and #BHAFC has worked pretty well.
• • •
Missing some Tweet in this thread? You can try to
force a refresh