1/11 We've been trading sideways most of the weekend, but today is a Daily, Weekly and Monthly candle close. Expecting some volatility.
This 🧵 will analyze #Ethereum charts and Trend Precognition signals to see how things are developing as we near the close. #NFA
This 🧵 will analyze #Ethereum charts and Trend Precognition signals to see how things are developing as we near the close. #NFA

2/11 Yesterday I shared an #ETHUSDT chart showing a tentative short signal from the Trend Precognition A2+ algo. At last night's D close the signal printed and new short signals appeared on both the A2+ algo (arrows) and A1 algo (dots).
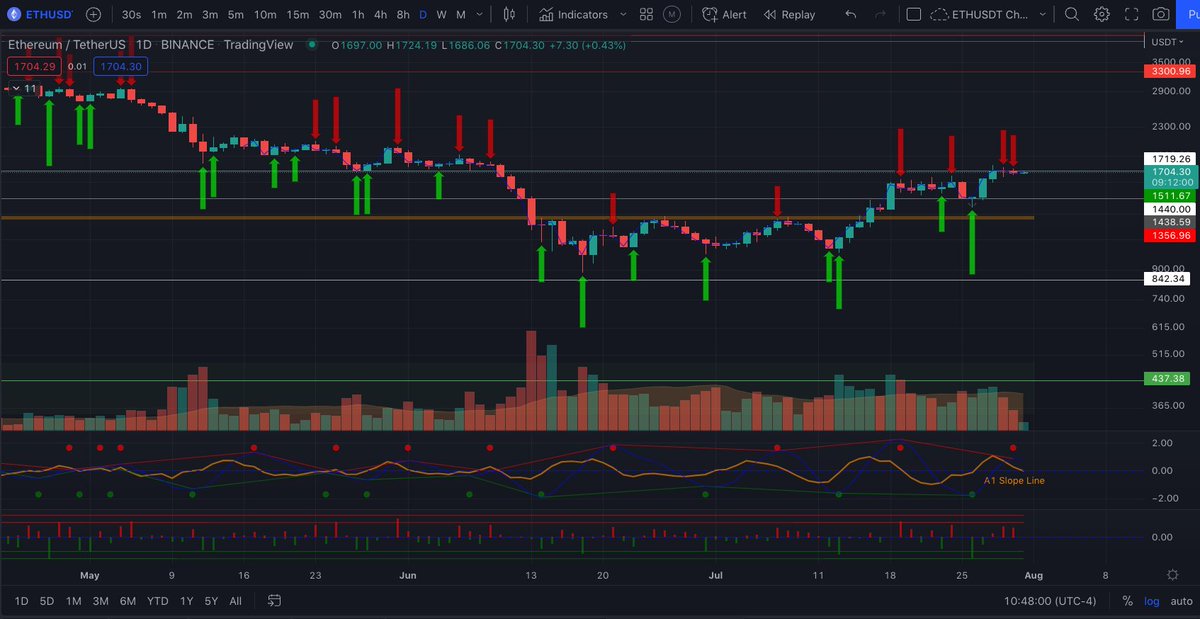
3/11 Trend Precognition signals won't print until the D close, but confluence between the A1 and A2+ algos increases the probability of accuracy. The fact that the short signals also have confluence with technical resistance at the 100 DMA increases probability that #ETH is toppy

4/11 I've often stated that we shouldn't make trading decisions based on one indicator or factor and that we must put everything in context. So far we've looked at 2 Trend algos and used technical analysis. Looking at #FireCharts 2.0 (beta) we can also see a sell wall at $17k

5/11 Confluence between both Trend Precognition algos, TA and ask liquidity on the order book all point to #ETH retracing some of it's recent rally. Using multiple tools to help us identify the trend reversal helps mitigate a lot of risk, but...
6/11 ...depending on the time horizon of your trades, things could change so before you push buttons, zoom out. The Trend Precognition signals above were for D charts. On the W chart, #ETH is still riding a long from June, but the A1 slope line indicates a change in momentum.
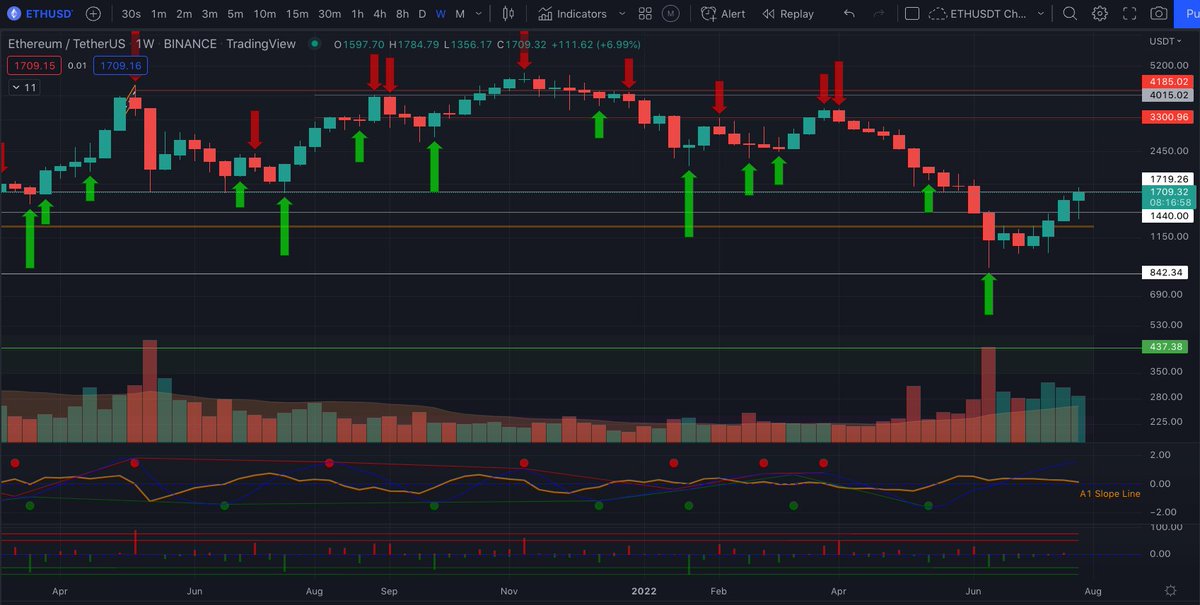
7/11 New Trend Precognition signals can flash on/off before a confirmed print on the next candle close, but the A1 Slope Line moves in near real time making it a predictive indicator showing where momentum is heading in between printed signals. It's trending down on D & W charts


8/11 Looking toward the Monthly close tonight we see both Trend Precognition algos are flashing Long on the M chart. These signals could disappear before the close, but if they print, that could indicate #ETH could move higher in the coming weeks or months.
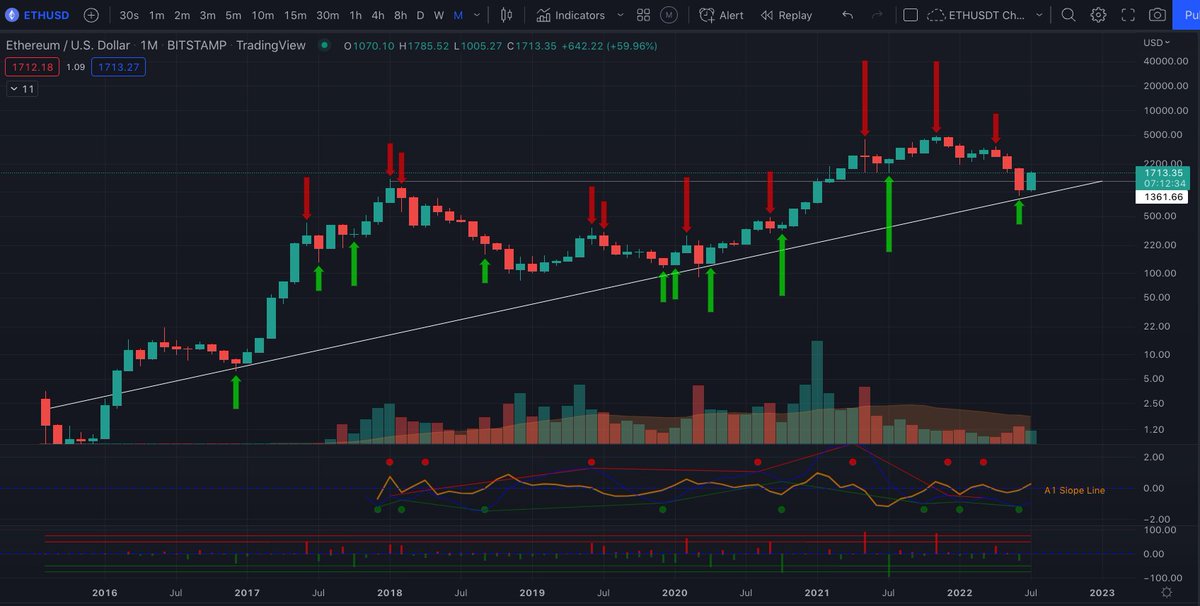
9/11 Our recent #ETH fractal models how this could potentially play out, and it matches the Trend Precognition forecast. I don't recommend trading fractals or taking them too literally as they can deviate in both price range and time or invalidate anytime. That said...

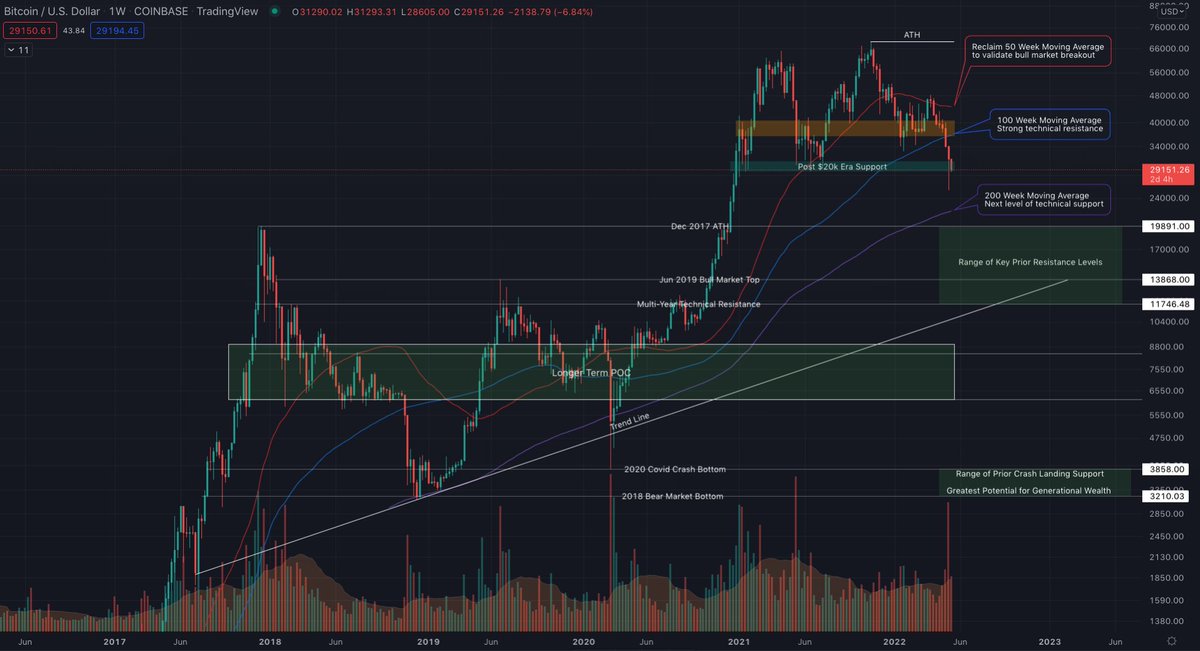
10/11 All of the above elements paint a very compelling story for #ETH based purely on algos and TA without any of the POW --> POS chatter or other CT noise. The charts and #tradingsignals tell you everything you need to know.
11/11 If you found this thread helpful, please like and share it.
If you want to learn more about the Trend Precognition indicators, here's a tutorial. Learn more about Trend Precognition here...
If you want to learn more about the Trend Precognition indicators, here's a tutorial. Learn more about Trend Precognition here...
*$1.7k
• • •
Missing some Tweet in this thread? You can try to
force a refresh