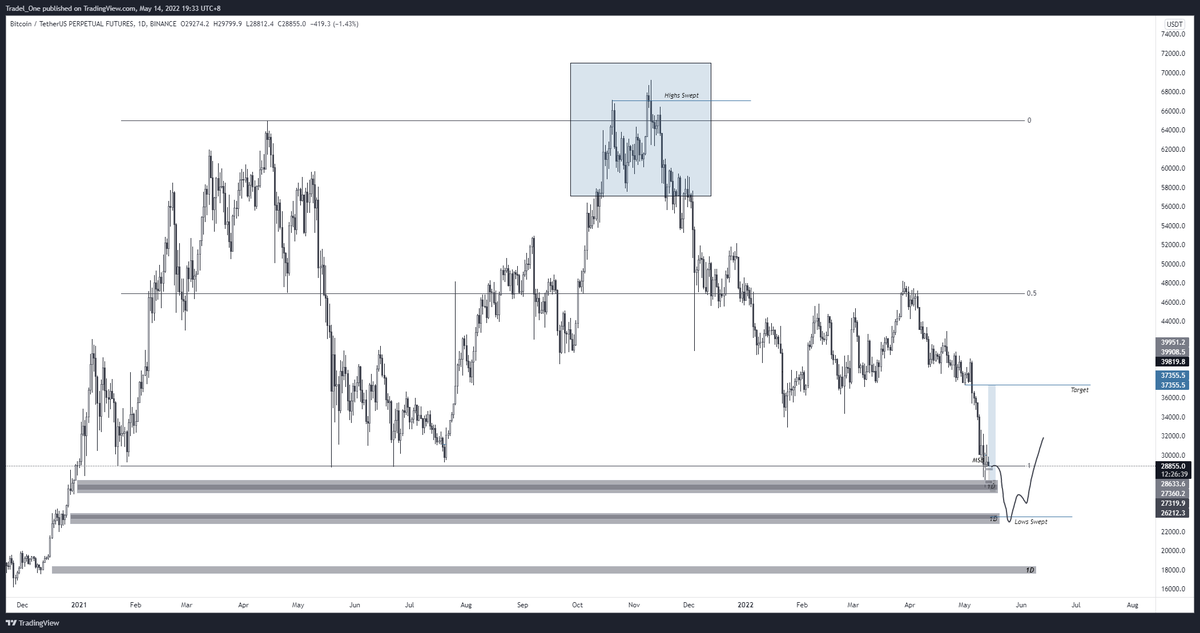
I've got a surprise for you with another strategy release on @tradingview for #Bitcoin & #Altcoins
bit.ly/Mindjacked_Sca…
- SRSI & Optional EMA's
- Different SRSI conditions for signal
- Session Filter (Set to your waking times)
- 3 Commas Integration
- TP / SL %'s
Read on:
bit.ly/Mindjacked_Sca…
- SRSI & Optional EMA's
- Different SRSI conditions for signal
- Session Filter (Set to your waking times)
- 3 Commas Integration
- TP / SL %'s
Read on:

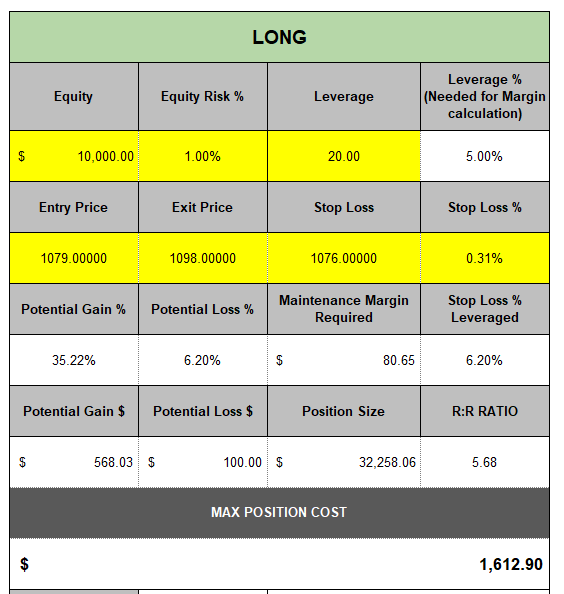
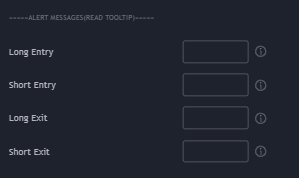
SL / TP %
You can set the strategy to the SL & TP levels that you'd like in terms of % (make sure youamend the pos size though to suit your SL %)
The general strategy is based on Stochastic RSI & EMA's, but you can turn off the EMA's as needed, & just run with SRSI.
You can set the strategy to the SL & TP levels that you'd like in terms of % (make sure youamend the pos size though to suit your SL %)
The general strategy is based on Stochastic RSI & EMA's, but you can turn off the EMA's as needed, & just run with SRSI.

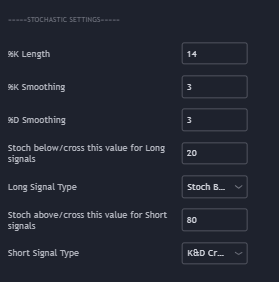
There's also a neat funcion called Use Exit Condition
If you set the SRSI to 80 for overbought, & 20 for oversold & you enter a short at 80, there will be a signal to close at the opposing metric.
In this case, it would be the 20 level at the SRSI condition you set for a long
If you set the SRSI to 80 for overbought, & 20 for oversold & you enter a short at 80, there will be a signal to close at the opposing metric.
In this case, it would be the 20 level at the SRSI condition you set for a long
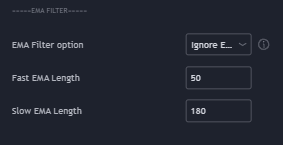
For the EMA's, you can also have in conjunction with the SRSI settings:
- Ignore EMA's
- Price Above (so trending)
- EMA in order (lower EMA on top of higher EMA in case you enter the fast & slow EMA wrong)
- Single EMA
- Ignore EMA's
- Price Above (so trending)
- EMA in order (lower EMA on top of higher EMA in case you enter the fast & slow EMA wrong)
- Single EMA
Stochastic RSI Settings
- Simple settings
Also options for
- Stoch above or below the value
- K&D Cross above or below value
- Stoch crossing up or down the value
- Simple settings
Also options for
- Stoch above or below the value
- K&D Cross above or below value
- Stoch crossing up or down the value
3 Commas Integration!
Use your 3 Commas bots here (you need an understanding of this of course, but I can do a tutorial on this soon)
You've now got an automated set up ready to go....for FREE!
Use your 3 Commas bots here (you need an understanding of this of course, but I can do a tutorial on this soon)
You've now got an automated set up ready to go....for FREE!
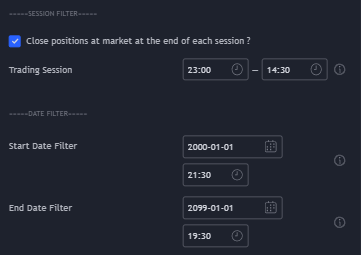
And also, something else that's really neat:
The option for your specific timezone to trade if you don't want the bots doing it for you.
Note that the timeframe is UTC, so you need to tailor this to your timezone.
The backtester will exclude the times you're not awake for you
The option for your specific timezone to trade if you don't want the bots doing it for you.
Note that the timeframe is UTC, so you need to tailor this to your timezone.
The backtester will exclude the times you're not awake for you
So that's it, another high quality (well, I like to think so) offer from us at MindJacked to utilise & refine your skills on.
If this has been helpful, please feel free to jump in on the socials below:
t.me/Mindset_BTC
discord.gg/yFdcmbd8yt
youtube.com/c/MindJacked
If this has been helpful, please feel free to jump in on the socials below:
t.me/Mindset_BTC
discord.gg/yFdcmbd8yt
youtube.com/c/MindJacked
And although it's free, if for whatever reason you'd like to help out with what we do, please feel free to head on over to @Bybit_Official where @johnnie_jacks & I are official partners with them
Cheers!
bit.ly/3IkJZO9
Cheers!
bit.ly/3IkJZO9
Please also note: the settings are at default, not at what I would have them on.
You need to play around with the strategy to work out what makes most sense to you on the given timeframe and pair that you want to play around with!
You need to play around with the strategy to work out what makes most sense to you on the given timeframe and pair that you want to play around with!
• • •
Missing some Tweet in this thread? You can try to
force a refresh