Cases are down another 27% this week, and are now at a similar level to the trough before the BA.4/5 wave took off.
PCR testing is down, and so is the positivity rate. Good.
All age bands had big falls in case numbers, ranging from 20% (60+) to 32% (0-9s).
The average number of people admitted to hospital each day fell by 12-13%
While the number in hospital fell by 10% over the week
I thought it might be interesting to see if there was any change in the age mix of those who are admitted to hospital. The two pies split the data for the last 3 months roughly in half.
No material change.
Here is the same set of graphs, but broken down by vax status. The proportion admitted to hospital with 4+ doses is higher/3 doses is lower for the more recent pie - in keeping with more people getting their 4th vaccination.
170 deaths in the latest week.
Just less than half of the deaths were aged care residents.
Looking at deaths by vax status split between the two time periods, we again see the % with 4+ doses is higher/3 doses is lower for the more recent pie. The % of deaths that are unvaccinated (13-14%) is clearly much higher than the % of the population that is unvaccinated.
S gene target failure on a PCR test is indicative of either the BA.1, BA.4 or BA.5 variant, and is currently sitting at about 97% of cases. Genomic testing is showing no BA.1 circulating, and BA.5 still dominating.
Our flu season looks to be pretty much over for this year (touch wood), with no influenza B this year (touch wood again).
The end. Any questions?
• • •
Missing some Tweet in this thread? You can try to
force a refresh
Nerd alert: I am massively happy to see age standardisation used in the methodology to estimate excess deaths.
This is a major flaw in the ABS commentary on its Provisional Mortality Statistics. Its "baseline" makes no allowance for population changes.
[I'm on an Actuaries Institute working group that has a specific focus on the mortality impacts of the pandemic. You can find out latest here.]
Our latest on excess deaths in Australia, covering all cause mortality to 30 April, plus excess from COVID-19 only to 31 July. #Covid19Aus
TLDR: 13% excess (+6,800 deaths) Jan-Apr 22.
8% excess (+3,500 deaths) from Covid only May-July.
Covid third leading cause of death in 2022.
Total excess mortality for the month of April 2022 estimated at 9% (+1,200 deaths).
More than half is due to doctor-certified COVID-19 deaths. Other unspecified causes and coroner-referred deaths (which include some COVID-19 deaths) also made a significant contribution.
With January at 20% excess mortality, February at 15% and March at 7%, this takes total excess mortality for the first four months of 2022 to 13% (+6,800 deaths).
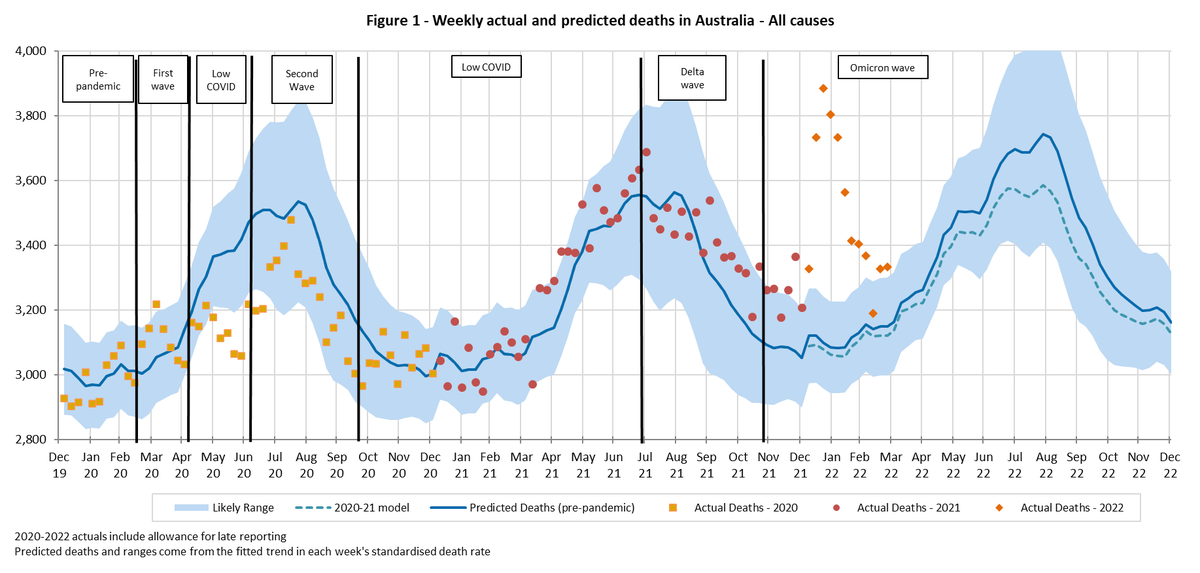
In advance of our work on excess deaths coming out in the next day or so, and with quite a few new followers, I thought I'd do a thread on how we calculate our baseline predicted values for 2022, and how these compare to what the ABS uses. #COVID19Aus
What did we do? We used ABS standardised death rates (SDRs) for each cause of death as the basis of our projections. The SDRs allow for changes in both population size and age mix. We built in trends for mortality improvement. We then converted that back to numbers of deaths.
What do ABS do? They use the average number of deaths in 2017-19+21 without any adjustment for population changes or trend.
A (long) thread on reporting of Covid deaths in Australia.
There seems to be a lot of misunderstanding out there about reporting of Covid deaths, so I am writing this thread to hopefully dispel some myths (and so I can link people to it rather than repeating myself!)
This is based on my understanding from dealing with death statistics in different circumstances. I am not a medical profession, so have no first-hand experience of how deaths are certified. If anyone out there on #MedTwitter would like to correct me, please do so.
First off, we have daily surveillance reporting. The purpose of this data is to provide an indication of how the pandemic is trending. Note that data has been collected in this form for years for other communicable diseases such as flu, measles, etc, and is ...
Have NSW hospitalisations hit the previous peak of January 2022?
A thread/ #CovidAus#covidnsw
On the face of it, it looks like not. However the January peak of 2,943 in hospital with COVID-19 used a different definition of "hospitalised with COVID" compared with the current wave
Back in January, the definition of "hospitalised with COVID" was if the time between COVID symptoms and admission date was less than 28 days.
This changed on 3 Feb 2022 to be less than 14 days, resulting in less people counting as being hospitalised for COVID.
Our latest assessment of excess deaths in Australia. This covers excess deaths from all causes to 31 March, plus excess deaths from COVID-19 only until 30 June.
A thread/ #CovidAus#ExcessDeaths#ExcessMortality
Total excess mortality for March 2022 estimated at 6% (+800 deaths).
Almost half of the excess is due to doctor-certified COVID-19 deaths. Other unspecified causes and coroner-referred deaths (which includes some COVID-19 deaths) also made a significant contribution.
With January at 19% excess mortality and February at 14%, this takes total excess mortality for the first quarter of 2022 to 13% (+5,100 deaths).
Only one week in 2022 has been close to predicted; all other weeks have been above the 97.5th percentile.