Kyra Markov Profile picture
Sep 22 6 tweets 4 min read
Drug overdose numbers for July have been released by the province.

95 Albertans died by drug poisonings in the month of July.

40 of those were Edmontonians (42%)

92/95 involved opioids (97%)

#yeg #ab #overdose #opioid #edmonton
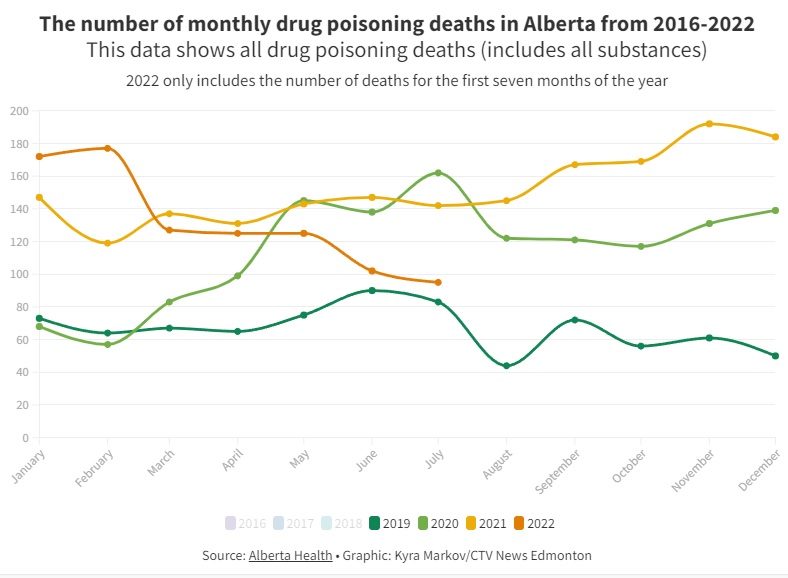
In the first 7 months of this year there have been 923 overdoses in Alberta, compared to 966 last year in the same time period which is a decrease of 4.5%.

#ab #overdose #opioid
During the first 7 months of this year in Edmonton there have been 347 overdoses compared to 342 in the same time frame last year which is a 1.5% increase.

#yeg #overdose #opioid #edmonton
This is monthly overdoses in Alberta layered year over year. I just left the last 4 years on for clarity. You can see that currently we are below 2020 & 2021's numbers, but above 2019's. The start of the year was very high but March onwards has been much lower.
This is the same, but for Edmonton. Similar to Alberta as a whole, we are currently below 2020 and 2021 numbers but are still above 2019. May, June and July demonstrate a downward trend after starting the year with higher numbers.
And for another part of the picture, this is the number of EMS responses to opioids related events in Edmonton per month, year over year for the same 4 years. On that front, we are below 2021's numbers but still higher than 2020 & 2019.

• • •

Missing some Tweet in this thread? You can try to force a refresh
 

Keep Current with Kyra Markov

Kyra Markov Profile picture

Stay in touch and get notified when new unrolls are available from this author!

Read all threads

This Thread may be Removed Anytime!

PDF

Twitter may remove this content at anytime! Save it as PDF for later use!

Try unrolling a thread yourself!

how to unroll video
  1. Follow @ThreadReaderApp to mention us!

  2. From a Twitter thread mention us with a keyword "unroll"
@threadreaderapp unroll

Practice here first or read more on our help page!

More from @KmarkovCTV

Sep 23
A thread on COVID-19 vs Influenza and how they are not the same. The proof is in the Alberta Health & Alberta Health Services data.
MAJOR disclaimer here. This data is not per calendar year, it is for each specific flu season in Alberta and the date range changes from year to year. It also means that many deaths and cases were left out. Doing it this way is necessary to create the most accurate comparisons.
These are the date ranges for the 7 years.
August 30, 2015 – June 11, 2016
2016-2017 is unspecified
August 28, 2017 – June 23, 2018
August 26, 2018 – March 23, 2019
Oct 06, 2019 to May 2, 2020
September 27, 2020 - April 3, 2021
Aug 29, 2021 - June 26, 2022
Read 8 tweets
Sep 22
This is an update on Edmonton Public Schools COVID/illness/absence numbers. I have been collecting this data daily since Jan 2022. Thank you to @EPSBNews for making it available for as long as you have. #edmonton #yeg #covidab
This first graph tells the biggest story. In purple are absences related to COVID-19, in blue are absences due to other illness. As you can see, when students returned to school in January, there was a significant amount of COVID-19 going around. Absences due to other illnesses.. Image
were also quite high. Throughout the year absences due to other illness grew well above COVID-19. I am not an expert, but I believe this was caused by a lack of testing moving potential COVID-19 cases into the 'other illness' category because COVID cases often aren't confirmed.
Read 11 tweets
Sep 21
Sept 21: AB COVID-19 data round up
Disclaimer: I base my graphs off of Alberta Health's raw data. The data they release weekly includes changes made to past weeks. I update my graphs to reflect those changes which is why my numbers may be different than others. #COVID19AB #Yeg
Tests: 6470 (-124 less than last week)
Avg Positivity: 19.52% (+2.56 from last week)
That is a big jump.
Last week's positivity was changed from 16.94% to 16.96%. Image
Deaths: 24 deaths reported this week.
+1 to week of June 7
+1 to week of Aug 30
+11 to last week
+12 deaths reported to have occurred this week.
I am getting 25, so one may have been removed from 2021 or before. Image
Read 14 tweets
Sep 8
Tonight I brainstormed how to organize the Alberta COVID-19 data in a way that we could see seasonal commonalities, and compare the month that we are in now to prior years to get an accurate idea of where we are at in the grand scheme of things and I think I did it. #covid19ab
This is daily hospitalizations for 3 years overlapped. You can see how each year is increasingly worse, & trends like a wave in May in all 3 years. You can also see an uncharacteristic increase this summer, and that the highest numbers were in the winter and spring of 2022.
Daily ICU numbers for 3 years overlapped. Here we can see that the Spring and Fall of 2021 were when most people were landing in the ICU. Interesting to see that we are currently below 2021 levels, but above 2020 levels, and that every year in July we have our lowest ICU numbers.
Read 6 tweets
Sep 8
Sept 7: AB COVID-19 data round up
Disclaimer: I base my graphs off of Alberta Health's raw data. The data they release weekly includes changes made to past weeks. I update my graphs to reflect those changes which is why my numbers may be different than others. #COVID19AB #Yeg
Tests: 6719 (-841 less than last week)
Last weeks test numbers were retroactively changed from 7547 up to 7560. #COVID19AB #Yeg
Avg Positivity: 16.68% (-2.25 from last week)
Last week's avg positivity was modified from 18.77% up to 18.93%.
#COVID19AB #Yeg
Read 13 tweets
Sep 1
Aug 31: AB COVID-19 data round up
Disclaimer: I base my graphs off of Alberta Health's raw data. The data they release weekly includes changes made to past weeks. I update my graphs to reflect those changes which is why my numbers may be different than others. #COVID19AB #Yeg
Tests: 7547 (+314 more than last week)
Last weeks test numbers were retroactively changed from 7219 up to 7233. #COVID19AB #Yeg
Avg Positivity: 18.77% (-4.11 from last week)
Last week's avg positivity was modified from 22.73% up to 22.88%.
#COVID19AB #Yeg Image
Read 16 tweets

Did Thread Reader help you today?

Support us! We are indie developers!


This site is made by just two indie developers on a laptop doing marketing, support and development! Read more about the story.

Become a Premium Member ($3/month or $30/year) and get exclusive features!

Become Premium

Don't want to be a Premium member but still want to support us?

Make a small donation by buying us coffee ($5) or help with server cost ($10)

Donate via Paypal

Or Donate anonymously using crypto!

Ethereum

0xfe58350B80634f60Fa6Dc149a72b4DFbc17D341E copy

Bitcoin

3ATGMxNzCUFzxpMCHL5sWSt4DVtS8UqXpi copy

Thank you for your support!

Follow Us on Twitter!

:(