1. Mondays 🧵 is about long term monitoring.
How many people have a wall like this in their house? It’s the basic principle of long term monitoring: measure the same thing, the same way, in the same place, over many years (until your kids have flown the nest 😢) 🪺🪹
#Data
How many people have a wall like this in their house? It’s the basic principle of long term monitoring: measure the same thing, the same way, in the same place, over many years (until your kids have flown the nest 😢) 🪺🪹
#Data

2. Long term monitoring and data collection leads to LTER – Long Term Ecological Research, where we use these data to understand natural variability, but also the complex interactions between people and nature over many years 📈📉📊🌳#LTER @eLTER_Europe @ILTER_network
3. In Burrishoole, data collection started in 1955 with counting fish: how many migratory (diadromous) fish were moving between freshwater (Lough Feeagh– top of photo) and the sea (Lough Furnace – bottom of photo) ??????

4. The migration of diadromous fish is controlled to a certain extent by the weather, so the first “non fish” monitoring in Burrishoole involved the installation of a @MetEireann weather station and water temperature and level recorders on the Mill Race in the late1950s
☀️🌤️🌥️🌦️
☀️🌤️🌥️🌦️


5.Many of the original instruments are still in use today, like the Campbell Stokes crystal ball, which records sunlight hours. The OTT water level recorder has been decommissioned and replaced by an electronic sensor @MetEireann @OTTHydromet 📉🌄


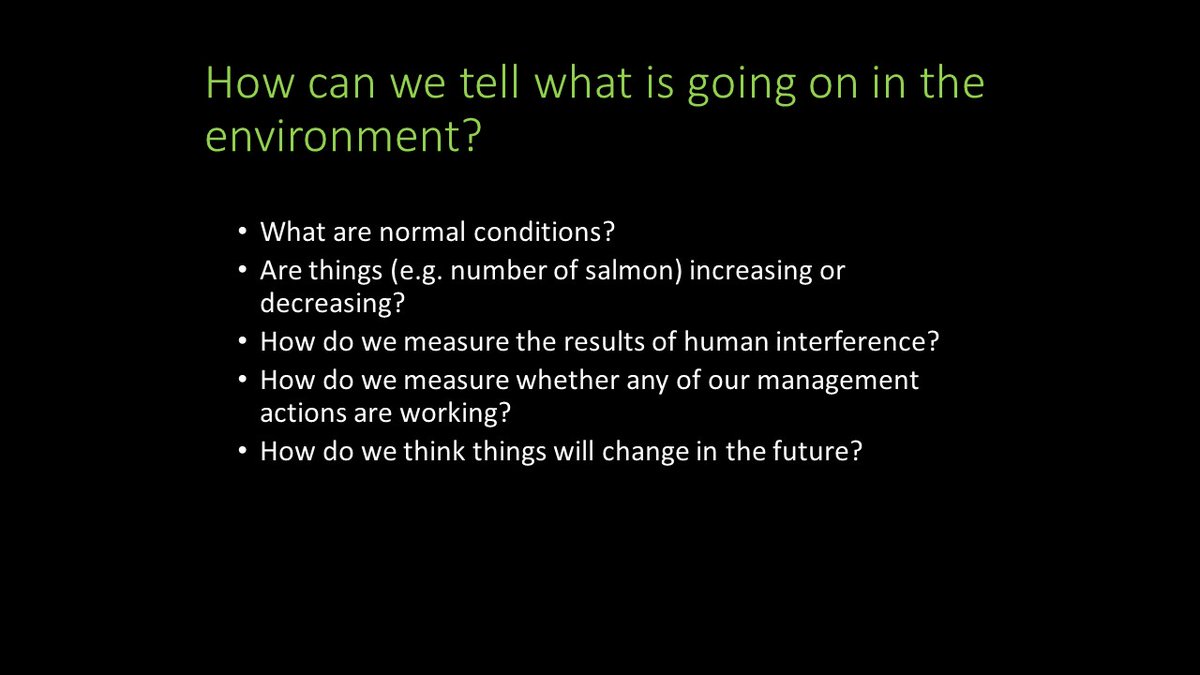
6. Over the decades, a program of monitoring has been built and maintained which aims to capture aquatic change at the catchment scale, that is likely to impact the fish stocks. But its really difficult to predict the future! What questions are we going to need to answer?
7. Policy questions come and go (especially over decades and successive governments), but if we have a solid evidence base (i.e. long term data), we will be in a good position to answer most things that arise –
⭐️Collect Once: use often ⭐️
(Tks @catherineduigan for that one🙂)
⭐️Collect Once: use often ⭐️
(Tks @catherineduigan for that one🙂)
8. So how do we decide what to measure? One solution is to collect set of key indicators (physical, chemical, biological) within the aquatic ecosystem, at appropriate temporal resolution (i.e. sub-daily, daily, weekly, monthly, annually) that you will “catch” any change
e.g. 👇
e.g. 👇

tea break 🫖🫖
9. Where possible, automatic data collection is a good idea. Why?
Physical changes happen really quickly in the west of Ireland. A rain storm blows in off the #Atlantic, the floods can rise in 30 minute, and fall again in a day. Blink and you miss it
Physical changes happen really quickly in the west of Ireland. A rain storm blows in off the #Atlantic, the floods can rise in 30 minute, and fall again in a day. Blink and you miss it
10. Chemical changes in rivers are tightly linked to water discharge, and you really need to be sampling frequently to get a good idea of changes
@EleanorJennings has done some great work with us on how carbon moves into rivers with rainfall events mdpi.com/2073-4441/12/1…
@EleanorJennings has done some great work with us on how carbon moves into rivers with rainfall events mdpi.com/2073-4441/12/1…
@EleanorJennings 11. Measurement with automatic sensors also enables the collection of crucial data at times when staff might be not at work, like during #COVID! We have automatic stations operating in the catchment, that measure variables every 2 minutes. They do require a lot of maintenance!

@EleanorJennings Slight digression: The @TeagascACP operate a really great program of automatic monitoring, and there is huge scope for this generally as technology improves -this is a super review from @bessonmarc et al
onlinelibrary.wiley.com/doi/10.1111/el…
onlinelibrary.wiley.com/doi/10.1111/el…
12. In the catchment's rivers, we aim to get a good idea of water quality every year using macroinvertebrates. These are a group of animals that have a long history of use as biological indicators. Here’s a perfect #Mayfly
14. On the rivers, we also do annual #Electrofishing surveys of the fish stocks – #eels and juvenile #Salmon and #Trout. This allows us to know whether any overall changes in the fish populations are resulting from changes in the catchment 🐟🐟🐟
https://twitter.com/edeeyto/status/1557826383870558209?s=20&t=9c24oP0op822C_-0JigKdA
15. In the lakes, we measure primary production by measuring the #chlorophyll content of the water (a proxy for the amount of #Algae in the water)
You can see it rising and falling over the year as winter turns to summer, water temperatures rise and days lengthen
You can see it rising and falling over the year as winter turns to summer, water temperatures rise and days lengthen

16. We also sample and count monthly #phytoplankton samples, as these species can change rapidly as a result of bottom up control:
e.g. water temperature, increased nutrients, decreased light penetration through the water column.
e.g. water temperature, increased nutrients, decreased light penetration through the water column.
https://twitter.com/edeeyto/status/1240590438060474368?s=20&t=EEJ7h0renCR8ThKUapRFLw
17. Zooplankton are the next step in the foodweb.
These are beautiful line drawings of 2 zooplankton species similar to those in Feeagh: Daphnia and Ceriodaphnia
Drawn by G. O. Sars in the early 1900s
Tks to Jens Petter Nilssen, Müller-Sars Society
link.springer.com/article/10.100…
These are beautiful line drawings of 2 zooplankton species similar to those in Feeagh: Daphnia and Ceriodaphnia
Drawn by G. O. Sars in the early 1900s
Tks to Jens Petter Nilssen, Müller-Sars Society
link.springer.com/article/10.100…


18. Lake populations of fish are monitored using seine nets once a year which is undoubtedly a team effort 💪💪💪

19. This somewhat unplanned data collection effort has resulted in a huge amount of data, which we can use to answer many many questions, not just about fish but about lots of other things. This is a word cloud of keywords from papers published using Burrishoole data in 2021 😀

20. Having a full understanding of the nuanced linkages between all the components of an ecosystem and its foodwebs is crucial as linkages are tight and sometimes unpredictable:
21. Long term data has been shown to be really important when deciding policies to identify and mitigate human impacts on ecosystems
Unfortunately in 🇮🇪 we don't have a coordinated long term data collection network, but thats something we could work on 🙂
academic.oup.com/bioscience/art…
Unfortunately in 🇮🇪 we don't have a coordinated long term data collection network, but thats something we could work on 🙂
academic.oup.com/bioscience/art…
22. OK, time to go. For the rest of the week, we'll take a look at what we have learnt from this data collection in Burrishoole, including important trends.
Tomorrow, we will talk about Lough Feeagh (Loch Fíoch)
Hasta Mañana 👋
📸 M. Dillane
Tomorrow, we will talk about Lough Feeagh (Loch Fíoch)
Hasta Mañana 👋
📸 M. Dillane

• • •
Missing some Tweet in this thread? You can try to
force a refresh