We've been studying #traffic, #environment, #economic, #equity & #policy implications of #Uber & #Lyft in US cities for the past 6 yrs
Our new video & policy brief summarize what we found
🧵1/n
@CMUVEG @CMU_EPP @CMU_Mech @CMUEngineering #VEGFindings
Our new video & policy brief summarize what we found
🧵1/n
@CMUVEG @CMU_EPP @CMU_Mech @CMUEngineering #VEGFindings
Our new policy brief series on Transportation Network Companies (#TNCs) like #Uber & #Lyft has bottom-line findings on
1) Effects of Uber & Lyft Entry on US Cities
2) Traffic Implications
3) Environmental Implications
4) Equity Implications
🧵2/n
cmu.edu/traffic21/rese…
1) Effects of Uber & Lyft Entry on US Cities
2) Traffic Implications
3) Environmental Implications
4) Equity Implications
🧵2/n
cmu.edu/traffic21/rese…

1) Effects of Uber & Lyft Entry on US Cities
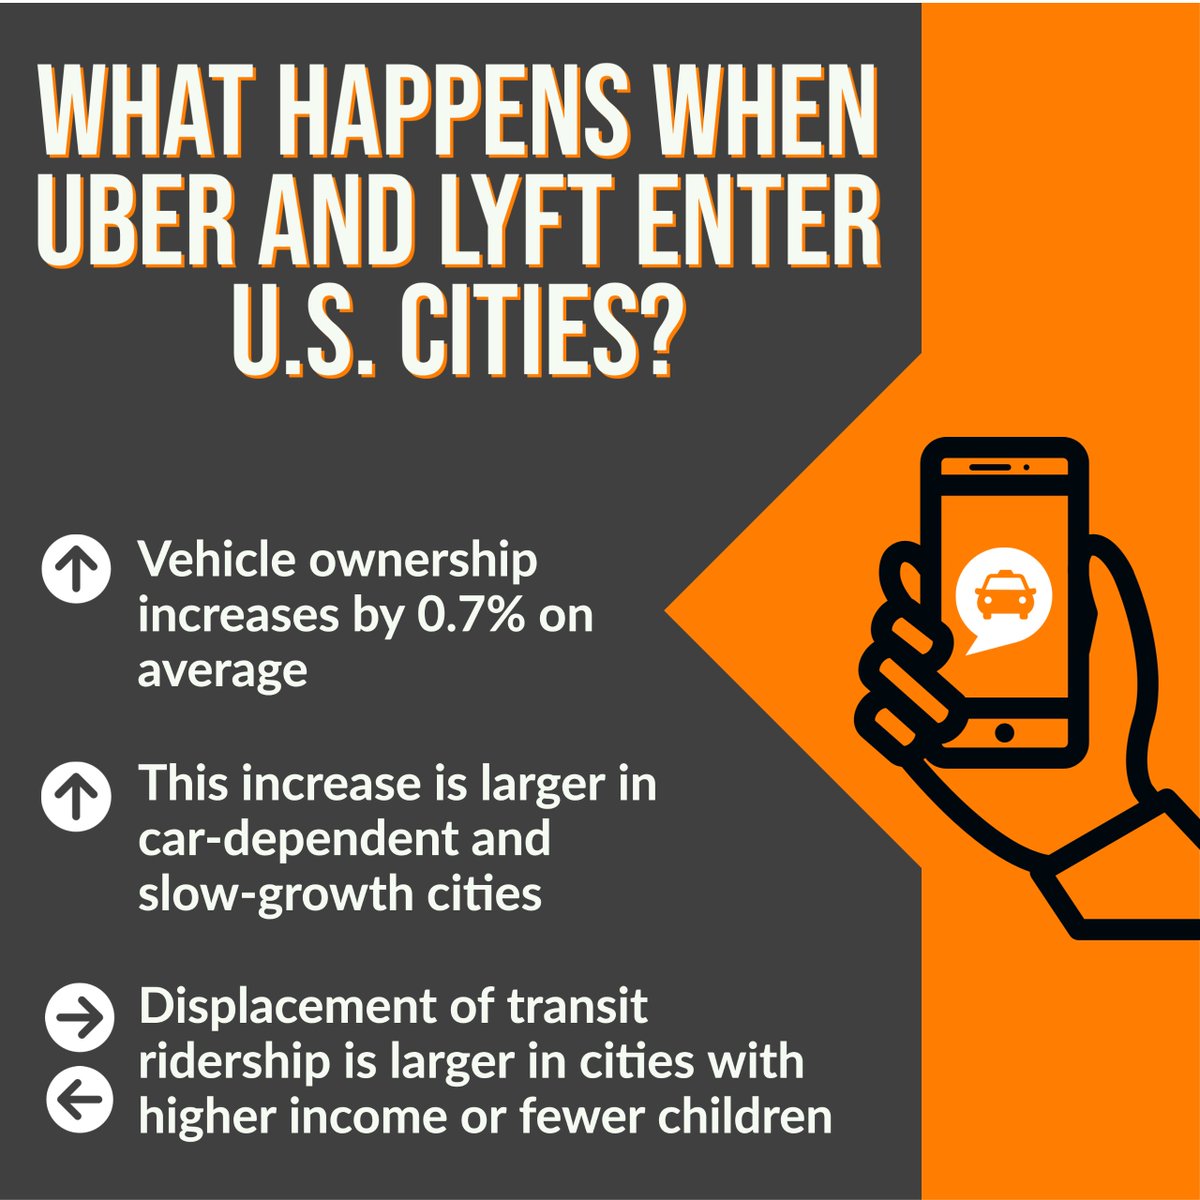
Uber & Lyft affect different cities differently:
⬆️ vehicle ownership in car-dependent & slow growth cities
⬇️ transit ridership most in cities with higher income & fewer children
🧵3/n
cell.com/iscience/fullt…
Uber & Lyft affect different cities differently:
⬆️ vehicle ownership in car-dependent & slow growth cities
⬇️ transit ridership most in cities with higher income & fewer children
🧵3/n
cell.com/iscience/fullt…
In a working paper we find Uber & Lyft
⬆️ employment, especially for intermittent jobs
⬆️ wages for intermittent jobs &
⬆️ city GDP
🧵4/n
cmu.edu/traffic21/rese…
⬆️ employment, especially for intermittent jobs
⬆️ wages for intermittent jobs &
⬆️ city GDP
🧵4/n
cmu.edu/traffic21/rese…

2) Traffic Implications of Uber & Lyft
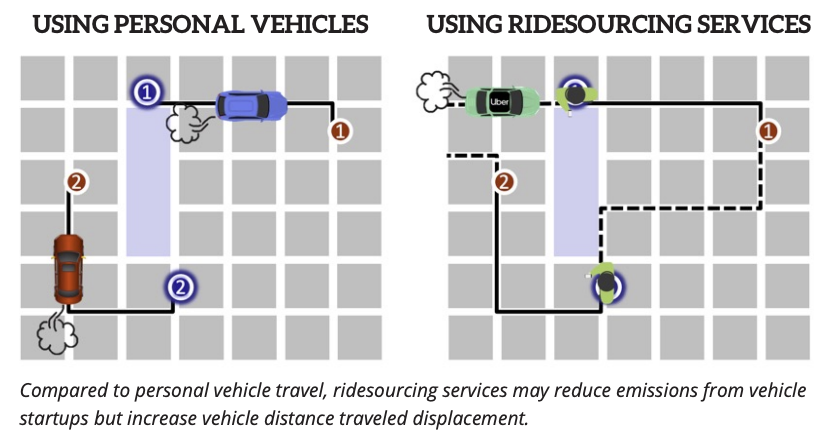
Compared to a personal vehicle, Uber cleans the air but clogs streets
- TNC cars are newer & spend more time hot -> air pollution improves 9-13¢/trip
- But extra driving creates 45¢ of traffic & climate costs
🧵5/n
pubs.acs.org/doi/10.1021/ac…
Compared to a personal vehicle, Uber cleans the air but clogs streets
- TNC cars are newer & spend more time hot -> air pollution improves 9-13¢/trip
- But extra driving creates 45¢ of traffic & climate costs
🧵5/n
pubs.acs.org/doi/10.1021/ac…
Overall, you impose lower costs to society, on average, when you take your personal car
To reduce TNC trip costs to society, avoid displacing transit trips, and pool rides when you can
🧵6/n
pubs.acs.org/doi/10.1021/ac…
To reduce TNC trip costs to society, avoid displacing transit trips, and pool rides when you can
🧵6/n
pubs.acs.org/doi/10.1021/ac…

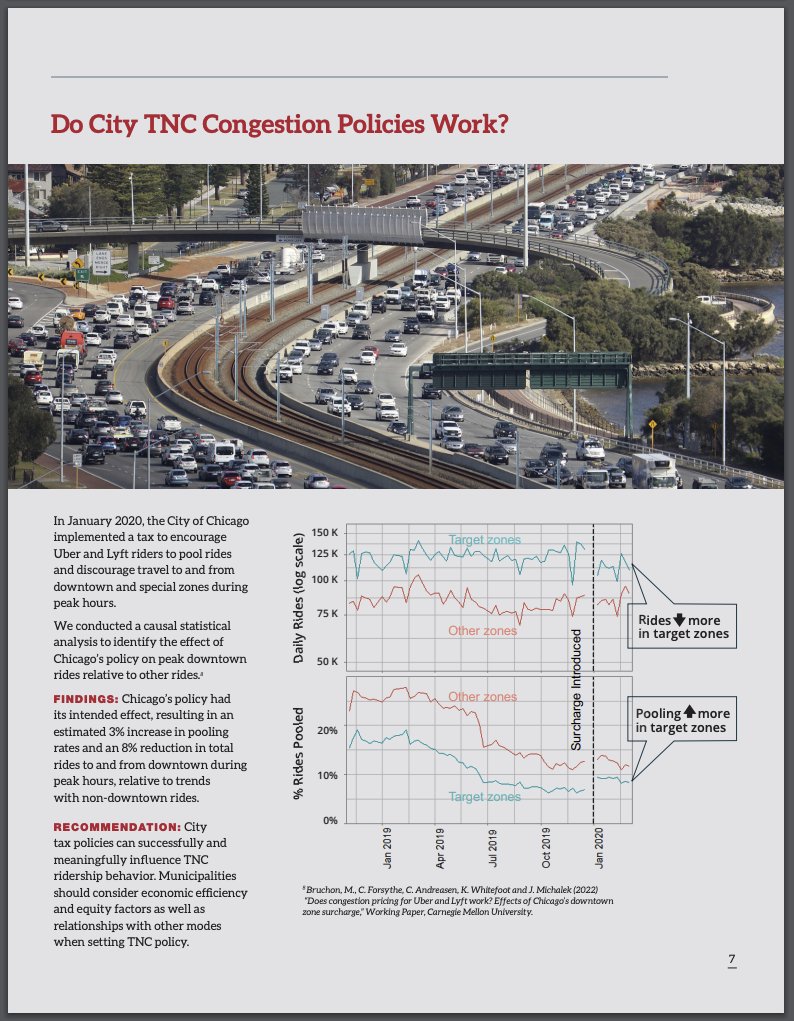
Chicago implemented a tax to encourage pooled rides & discourage travel to/from targeted zones during peak hours. We estimate it caused ⬆️ 3% pooling rates & ⬇️ 8% trips in targeted zones
🧵7/n
@cta
cmu.edu/traffic21/rese…
🧵7/n
@cta
cmu.edu/traffic21/rese…

We simulate cost-minimizing TNC fleets
- Allowing ride pooling ⬇️external costs of congestion, collisions & emissions 8%
- When TNC pays external costs, pooling ⬆️3%, external costs ⬇️1% more
- Private costs alone provide most of incentive to pool
🧵8/n
cmu.edu/traffic21/rese…
- Allowing ride pooling ⬇️external costs of congestion, collisions & emissions 8%
- When TNC pays external costs, pooling ⬆️3%, external costs ⬇️1% more
- Private costs alone provide most of incentive to pool
🧵8/n
cmu.edu/traffic21/rese…

3) Environmental Implications of Uber & Lyft
When faced with the costs their emissions impose on others, cost-minimizing TNCs electrify more of their fleets, ⬇️ air emission costs by 10% (NYC) to 22% (LA). Socially optimal fleet uses a mix of tech
🧵9/n
pubs.acs.org/doi/10.1021/ac…
When faced with the costs their emissions impose on others, cost-minimizing TNCs electrify more of their fleets, ⬇️ air emission costs by 10% (NYC) to 22% (LA). Socially optimal fleet uses a mix of tech
🧵9/n
pubs.acs.org/doi/10.1021/ac…
4) Equity Implications of Uber & Lyft
During heat waves in NYC, TNC rides ⬆️ more in high-income neighborhoods than in low-income neighborhoods
🧵10/n
cmu.edu/traffic21/rese…
During heat waves in NYC, TNC rides ⬆️ more in high-income neighborhoods than in low-income neighborhoods
🧵10/n
cmu.edu/traffic21/rese…

When COVID hit, ridership from high-income locations ⬇️ most. Perhaps low income riders had more essential jobs or fewer alternative options.
🧵11/n
cmu.edu/traffic21/rese…
🧵11/n
cmu.edu/traffic21/rese…

Today’s TNCs may not ⬇️ pandemic deaths relative to buses, but autonomous TNCs would cut driver-passenger interactions & reduce spread
🧵12/n
cmu.edu/traffic21/rese…
🧵12/n
cmu.edu/traffic21/rese…

Authors include @DocCHarper @DestenieNock @MatthewBruchon @CostaSamaras @jha_economics @inesliaz @MahtotSselassie @lilyrhanig @alehenao10 Daniel Armanios, Connor Forsythe, Adam Koling, Jake Ward, Kate Whitefoot, et al. An outstanding group I am so lucky to work with!
🧵13/n
🧵13/n

• • •
Missing some Tweet in this thread? You can try to
force a refresh


