Why did #methane surge in 2020 ?
Our article just published @Nature shows that the high growth rate of CH4 in 2020 is explained half by decreased OH removal & half by more wetland emissions @ShushiPeng @CEA_Officiel @gcarbonproject @IPSL_outreach … 🧶
nature.com/articles/s4158…
Our article just published @Nature shows that the high growth rate of CH4 in 2020 is explained half by decreased OH removal & half by more wetland emissions @ShushiPeng @CEA_Officiel @gcarbonproject @IPSL_outreach … 🧶
nature.com/articles/s4158…

We expected in 2020 less anthropogenic emissions from #COVID but in fact the #CH4 growth rate was record high at 15.1 ppt y-1 (@NOAA data ) 

The #CH4 growth rate results from an imbalance between emissions ( natural and anthropogenic ) and the OH sink in the atmosphere @gcarbonproject 

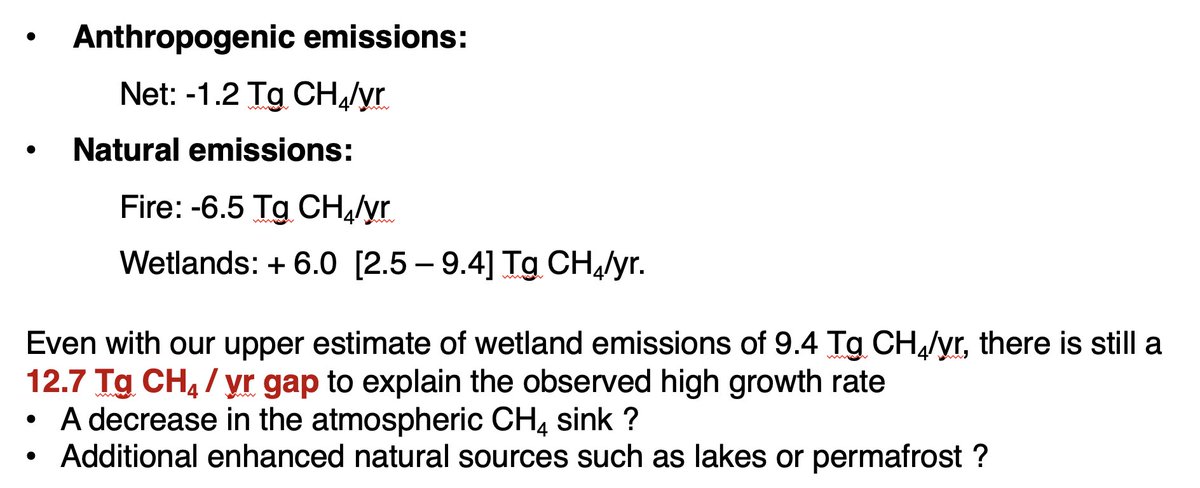
Anthropogenic emissions show a small decrease in 2020 compared to 2019 from inventories of agriculture, waste and fossil fuels extraction and use ( @IEA data ) 

Wetland emissions from wetland models increased ( 2 models LPJ @carBenPoulter and ORCHIDEE @ShushiPeng driven by different climate datasets )
Wetland areas experienced wetter and warmer conditions
But large uncertainties from models / climate datasets +2.5 to +9.4 Mt CH4 y-1
Wetland areas experienced wetter and warmer conditions
But large uncertainties from models / climate datasets +2.5 to +9.4 Mt CH4 y-1

Fire emissions in 2020 were « normal » 6 MtCH4 less than in 2019, that was an extreme years from #amazon and #australia 

But all in all, the sum of bottom-up estimates did not explain the abnormal #CH4 growth rate in 2020
Still an a gap of 13 MtCH4 y-1 growth to explain !
Still an a gap of 13 MtCH4 y-1 growth to explain !

Here we come to the hard part : how did OH change ?
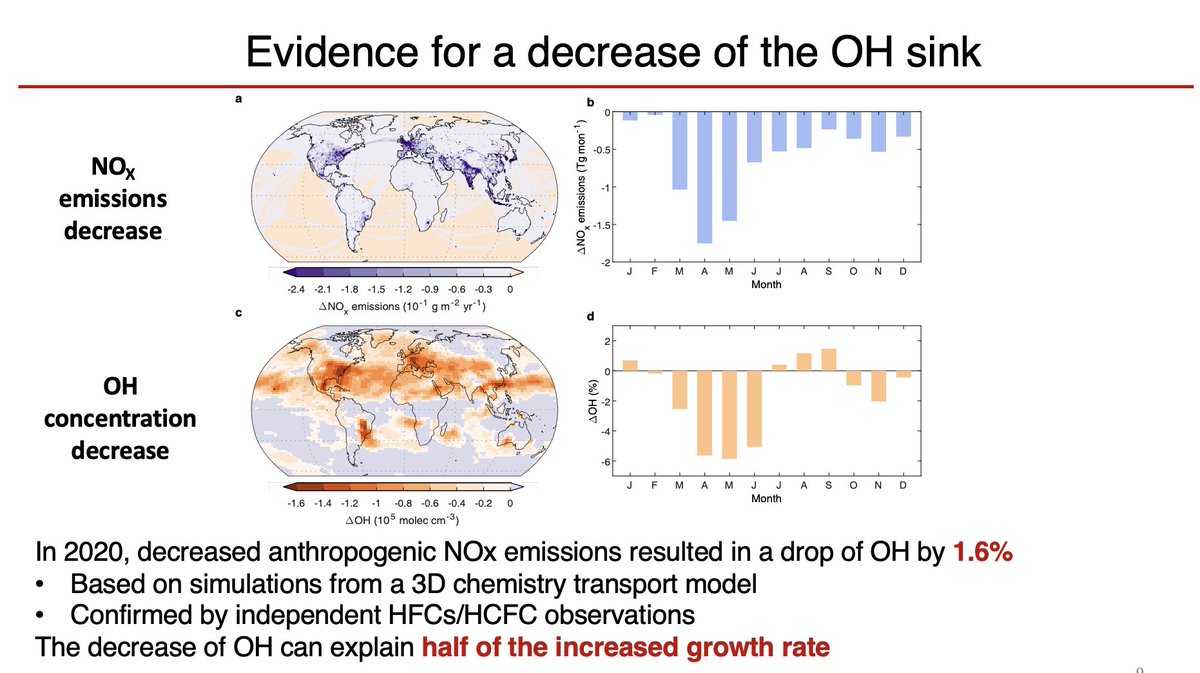
We used a 3D chemistry model with realistic drop of NOx & CO anthropogenic emissions @Carbon_Monitor and found a 1.6% drop of OH
Less NOX pollution -> less OH -> more CH4
See below drop of NOx emissions & OH change map

We used a 3D chemistry model with realistic drop of NOx & CO anthropogenic emissions @Carbon_Monitor and found a 1.6% drop of OH
Less NOX pollution -> less OH -> more CH4
See below drop of NOx emissions & OH change map


The OH decrease explains half of the growth rate anomaly in 2020 compared to 2019.
OH decrease is consistent with an independent estimate based on F-gases concentrations @rona_thomp = 2% drop
OH decrease is consistent with an independent estimate based on F-gases concentrations @rona_thomp = 2% drop
To reconcile atmospheric signals with bottom up emissions, we used a 3D atmospheric inversion model using surface stations data or #GOSAT satellite data 

The solution of the inversion gives more sources in the northern hemisphere and confirms the smaller OH sink
See red areas in the North where emissions increased ( northern wetlands, Africa, South and South East Asia )
See red areas in the North where emissions increased ( northern wetlands, Africa, South and South East Asia )

The methane high growth rate enigma is explained 50% by decreased OH from less pollution (NOx) and 50% bu enhanced natural (#wetlands) sources
Colors : where the emission change ( + or - ) is dominated by a specific source type
Colors : where the emission change ( + or - ) is dominated by a specific source type

Two implications from the « large scale natural experiment « of the year 2020 ( note high growth rates continued in 2021 )
1) in a wetter and warmer year, #wetland emissions increase strongly, suggesting that in the future, #wetlands could emit more CH4 and amplify warming …
1) in a wetter and warmer year, #wetland emissions increase strongly, suggesting that in the future, #wetlands could emit more CH4 and amplify warming …

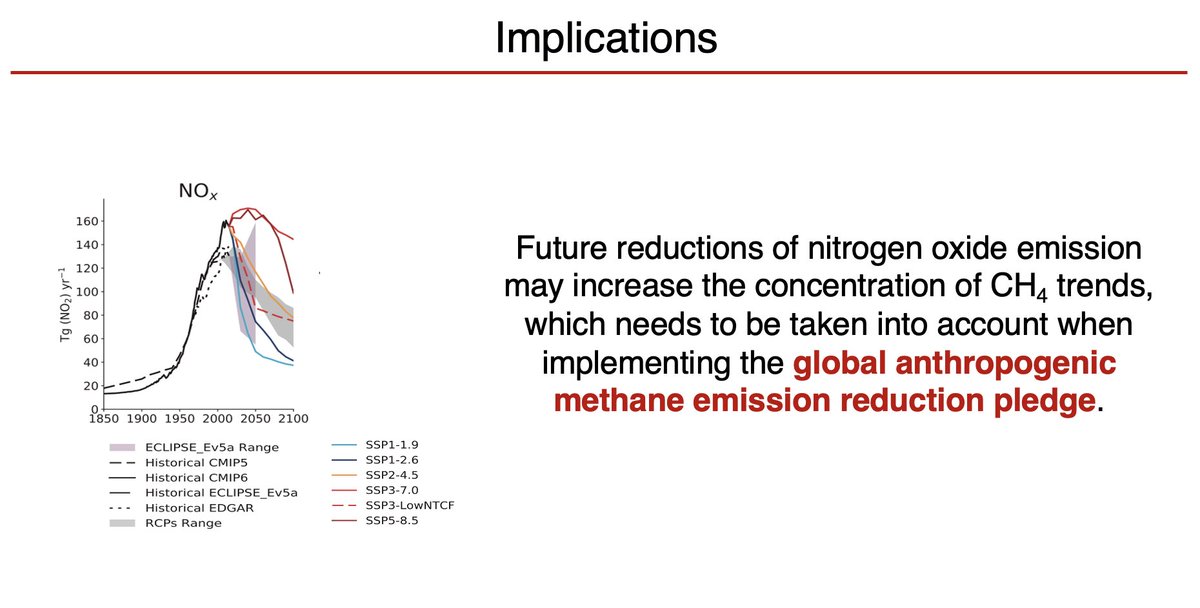
2) reducing NOx pollution increased CH4 in 2020
All future @IPCC scenarios predict NOX reductions, especially when reducing CO2 emissions, and will cause an extra growth of #CH4Th
All future @IPCC scenarios predict NOX reductions, especially when reducing CO2 emissions, and will cause an extra growth of #CH4Th

This NOX CH4 feedback is included in simple climate models like MAGICC used by IPCC @JoeriRogelj but based on simple equations. Where and when NOx reductions happen will matter a lot for OH and #CH4 and simple models may underestimate the CH4 increase from less pollution
🙏 Huge thanks to an incredible team of co authors 🙏 working over last year to put together the jigsaw puzzle @MethaneData @CLAND_saclay
@ShushiPeng @rona_thomp @carBenPoulter @BoZheng18 @mic_ramonet @BiogeoYi @NOAA M Saunois, X Lin, D Hauglustaine, G Liu, X Lan, Z Zhang
@ShushiPeng @rona_thomp @carBenPoulter @BoZheng18 @mic_ramonet @BiogeoYi @NOAA M Saunois, X Lin, D Hauglustaine, G Liu, X Lan, Z Zhang

• • •
Missing some Tweet in this thread? You can try to
force a refresh


