
🐻♉️↗️↘️↔️⚠️🚩🔺🔻🧮 💰
Macro Review 🧵
01/15/2023
1/11
Core #CPI running at +3.1% SAAR confirmed #Goldilocks for Q422 and catalyzed a 🚀 in equities, metals, and hydrocarbons
#Core CPI - 3-month SAAR
Dec - 3.1%
Nov - 4.2%
Oct - 5.7%
Chart: #CoreCPI 5.7% 🔻
Macro Review 🧵
01/15/2023
1/11
Core #CPI running at +3.1% SAAR confirmed #Goldilocks for Q422 and catalyzed a 🚀 in equities, metals, and hydrocarbons
#Core CPI - 3-month SAAR
Dec - 3.1%
Nov - 4.2%
Oct - 5.7%
Chart: #CoreCPI 5.7% 🔻

1a/11
Despite all the recession talk - including my own, the @AtlantaFed #NowCast is projecting Q4 growth of +4.1%, an acceleration.
Growth 🔺 + Inflation 🔻 = #Quad1 #Goldilocks
Chart:
Despite all the recession talk - including my own, the @AtlantaFed #NowCast is projecting Q4 growth of +4.1%, an acceleration.
Growth 🔺 + Inflation 🔻 = #Quad1 #Goldilocks
Chart:
https://twitter.com/AtlantaFed/status/1612873854694658051?s=20&t=yjGQQ6rAdazN3jS13PT73g
2/11
While #Quad1 #Goldilocks may be good for risk assets, it’s decidedly poor for the $USD, which continued ↘️ and took out the 50% retracement level of 102.12
Chart: $USD -1.64% (w) -9.94% 3M = T = Trend
While #Quad1 #Goldilocks may be good for risk assets, it’s decidedly poor for the $USD, which continued ↘️ and took out the 50% retracement level of 102.12
Chart: $USD -1.64% (w) -9.94% 3M = T = Trend

3a/11
With a -0.76 correlation to the $USD over (T) duration, $GOLD +2.78% continued to 🚀 and is now +18.7% off the October lows and VERY OVERBOUGHT
Chart: $GOLD +5.23% YTD
With a -0.76 correlation to the $USD over (T) duration, $GOLD +2.78% continued to 🚀 and is now +18.7% off the October lows and VERY OVERBOUGHT
Chart: $GOLD +5.23% YTD

3b/11
Dr. $COPPER turned decidedly ♉️ the week ending 11/11/22 and has been🚦bullish Trend ever since, front running China re-opening announcement by over a month.
Chart: $COPPER +7.8% (w) +23.9% (T)
Dr. $COPPER turned decidedly ♉️ the week ending 11/11/22 and has been🚦bullish Trend ever since, front running China re-opening announcement by over a month.
Chart: $COPPER +7.8% (w) +23.9% (T)

4/11
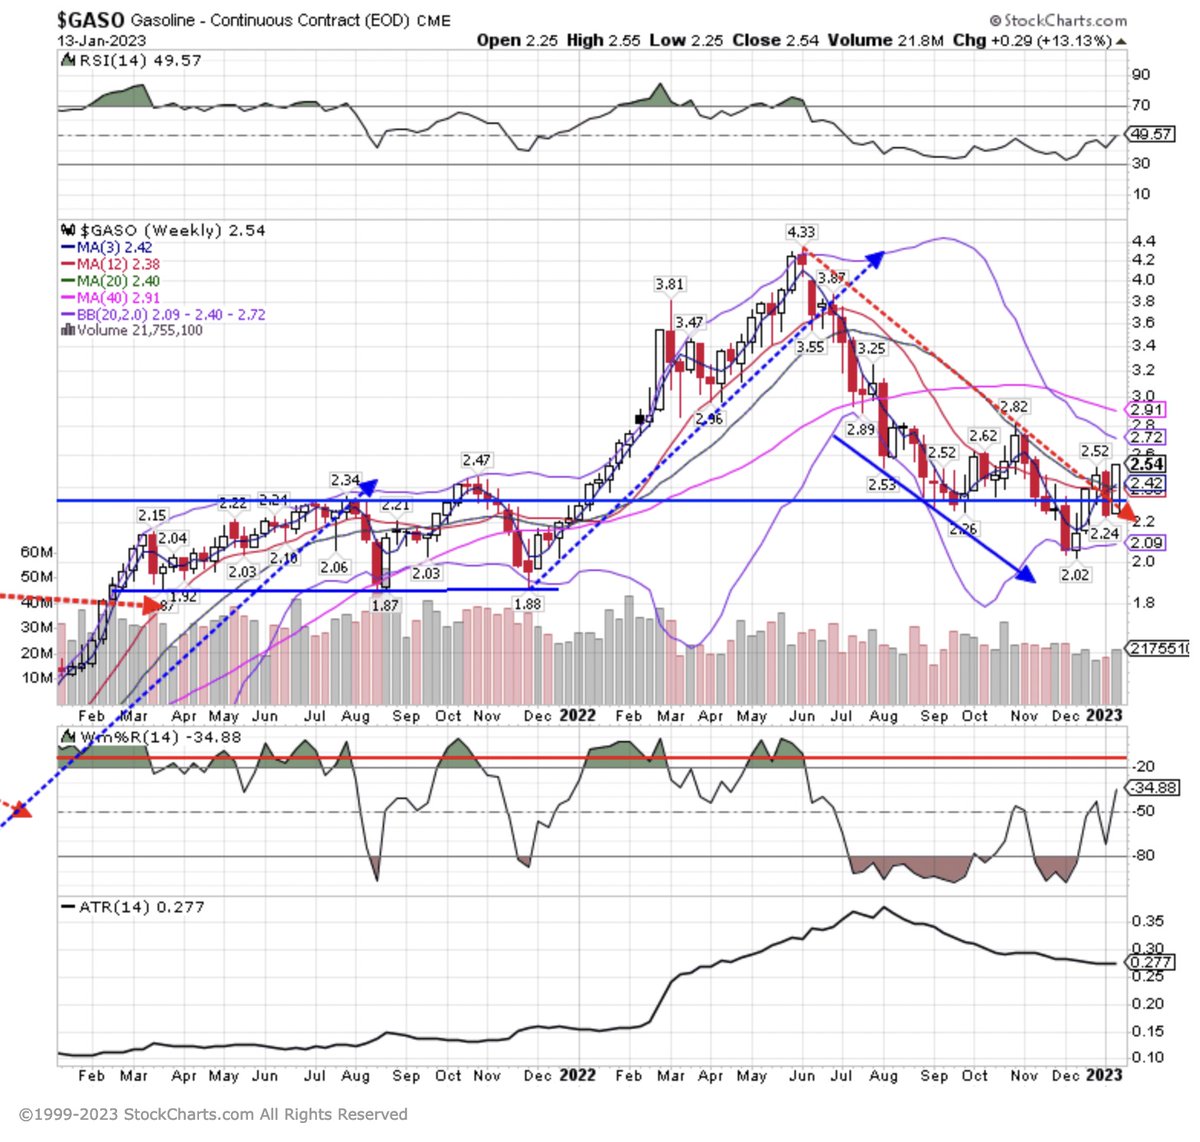
Declines in energy costs in December nearly offset the rise in shelter costs in the #CPI report. The commensurate real wages ↗️ put pressure on hydrocarbons this week = sowing the seeds #Goldilocks early demise
Chart: $GASO +13.39% (w) -3.67% (T)
Declines in energy costs in December nearly offset the rise in shelter costs in the #CPI report. The commensurate real wages ↗️ put pressure on hydrocarbons this week = sowing the seeds #Goldilocks early demise
Chart: $GASO +13.39% (w) -3.67% (T)
4a/11
📌 Importantly, I want to note that oil 🌊 has fallen to multi-month lows as speculators have been shaken from the market.
Time to get long energy 🛢 folks.
Chart: $OVX 38.19 at the lowest level in a year.
📌 Importantly, I want to note that oil 🌊 has fallen to multi-month lows as speculators have been shaken from the market.
Time to get long energy 🛢 folks.
Chart: $OVX 38.19 at the lowest level in a year.

5/11
While the "the food index increased +10.4% over the last year” in the December #CPI report, grains have been decidedly subdued since peak inflation in June.
Chart: $DBA -0.15% (w) -2.64% (T) could be the next to join the ♉️ party
While the "the food index increased +10.4% over the last year” in the December #CPI report, grains have been decidedly subdued since peak inflation in June.
Chart: $DBA -0.15% (w) -2.64% (T) could be the next to join the ♉️ party

6/11
With event risk behind us, the $VIX 🔻 to 18.35, a 1-year low and supporting equity prices as both realized and implied vol fall.
Chart: $VIX 18.35 has some calling for long zee puts, but I’m not so sure
With event risk behind us, the $VIX 🔻 to 18.35, a 1-year low and supporting equity prices as both realized and implied vol fall.
Chart: $VIX 18.35 has some calling for long zee puts, but I’m not so sure

6a/11
Small caps led 🇺🇸 equity indices ↗️
Chart: $IWM +5.33%
Small caps led 🇺🇸 equity indices ↗️
Chart: $IWM +5.33%

6b/11
High beta ♣️ low beta by a wide margin
Chart: $SPHB +5.96% (w) compared to $SPLV -0.43% (w)
High beta ♣️ low beta by a wide margin
Chart: $SPHB +5.96% (w) compared to $SPLV -0.43% (w)

6c/11
Growth had a slight edge over value
Chart: $SPYG +2.78% (w) compared to $SPYV +2.7% (w)
Growth had a slight edge over value
Chart: $SPYG +2.78% (w) compared to $SPYV +2.7% (w)

6d/11
With real wages rising, consumers ostensibly have more 💰 in their pockets to spend.
Accordingly, consumer discretionary led US Sectors ↗️ while Staples -1.37% on the week.
Chart: $XLY +5.78% (w) +3.27% (T)
With real wages rising, consumers ostensibly have more 💰 in their pockets to spend.
Accordingly, consumer discretionary led US Sectors ↗️ while Staples -1.37% on the week.
Chart: $XLY +5.78% (w) +3.27% (T)

7/11
A weak $USD has also catalyzed ♉️ moves in international indices over the past 3 months with both Europe and the Pac Rim showing outsized 💪
Chart: $DAX +3.26% (w) and +22.7% off the October lows
A weak $USD has also catalyzed ♉️ moves in international indices over the past 3 months with both Europe and the Pac Rim showing outsized 💪
Chart: $DAX +3.26% (w) and +22.7% off the October lows

8a/11
In bond land, the yield curve remains deeply inverted as the short-end has been 📌 by the Fed and bonds have rallied on slowing inflation and the prospect of #recession in the year ahead
Chart: 10Y3M to -118 bps
In bond land, the yield curve remains deeply inverted as the short-end has been 📌 by the Fed and bonds have rallied on slowing inflation and the prospect of #recession in the year ahead
Chart: 10Y3M to -118 bps

8b/11
Corporate bonds led bond ETFs ↗️
Chart: $LQD +1.72% (w) +10.05% (T)
Corporate bonds led bond ETFs ↗️
Chart: $LQD +1.72% (w) +10.05% (T)

9/11
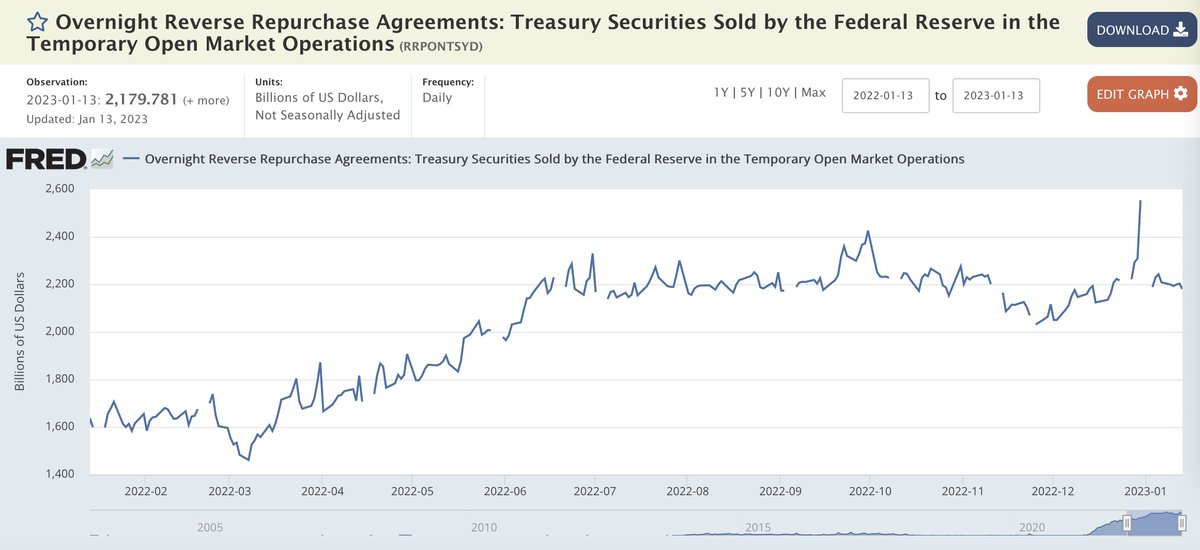
Supporting all of this ♉️ 🚀, 374B has come out of reverse repo (money markets) and into risk assets since the end of December 🔥
It only takes 50-100B to move markets each day
Chart: Overnight reverse repo
Supporting all of this ♉️ 🚀, 374B has come out of reverse repo (money markets) and into risk assets since the end of December 🔥
It only takes 50-100B to move markets each day
Chart: Overnight reverse repo
10a/11
The big question for investors is how long can this #Quad1 #Goldilocks ♉️ last - especially as it runs into a 🦅 #FOMC on 02/01/23, one day after the Employment Cost Index (ECI) for Q422 is released.
Remember, this Fed is focused on wages aka "services ex-shelter"
The big question for investors is how long can this #Quad1 #Goldilocks ♉️ last - especially as it runs into a 🦅 #FOMC on 02/01/23, one day after the Employment Cost Index (ECI) for Q422 is released.
Remember, this Fed is focused on wages aka "services ex-shelter"
10b/11
I’m inclined to agree with @BobEUnlimited that this #Goldilocks is transitory and that it will sow its own seeds of destruction as moribund commodities spring to life and as real wage gains spur a resilient consumer, pushing #inflation ↗️
blog.unlimitedfunds.com/transitory-gol…
I’m inclined to agree with @BobEUnlimited that this #Goldilocks is transitory and that it will sow its own seeds of destruction as moribund commodities spring to life and as real wage gains spur a resilient consumer, pushing #inflation ↗️
blog.unlimitedfunds.com/transitory-gol…
10c/11
In the meantime, we will run a Goldilocks play 📗 in combination with our recession play 📕
Image: #Goldilocks play 📗
In the meantime, we will run a Goldilocks play 📗 in combination with our recession play 📕
Image: #Goldilocks play 📗

11/11
Despite extremely overbought conditions in equities, expect positive vanna and charm 🌊 into #OPEX 🥐 as well as more #TGA spend as Janet front runs Congress & reverse repo 💦 as chasers chase the 200-day #FOMO
Note $SPX resistance at 4075-4100 and have a super 💰 week!
Despite extremely overbought conditions in equities, expect positive vanna and charm 🌊 into #OPEX 🥐 as well as more #TGA spend as Janet front runs Congress & reverse repo 💦 as chasers chase the 200-day #FOMO
Note $SPX resistance at 4075-4100 and have a super 💰 week!
• • •
Missing some Tweet in this thread? You can try to
force a refresh


