QF Research Profile picture
Jan 23 4 tweets 2 min read
1) Leading economic indicators down 10M in a row and -7.4% Y/Y.

In or entering recession (Mar '01) every time since '60.

"Cliché but true - every cycle is different. A few bad job prints would seal the deal."

"This time is different" often ...

$SPY $QQQ $TLT $GLD #Commodities Image
2) dangerous but we're prob not in recession now or entering within a M(?).

Consider LEI components. Shown is 6M change.

Soft component (consumer expectation) largest negative contribution. Employment component almost flat.

I've been watching for sudden weakness in high ... Image
3) frequency economic data since last summer.

While some data weakened, if I were told last summer that jobless claims would be near lows and there wasn't a big downside NFP next 6M, I would've said very unlikely.

Still "a few bad job prints would seal the deal?" I think yes.
4) When? More unsure.

Why? Excess savings (runs out this summer), businesses hoarding labor, lag in tech layoffs appearing in data etc.

Continue to look at high frequency data. Especially employment, official & leading indicators. E.g high 200's initial claims may be a trigger.

• • •

Missing some Tweet in this thread? You can try to force a refresh
 

Keep Current with QF Research

QF Research Profile picture

Stay in touch and get notified when new unrolls are available from this author!

Read all threads

This Thread may be Removed Anytime!

PDF

Twitter may remove this content at anytime! Save it as PDF for later use!

Try unrolling a thread yourself!

how to unroll video
  1. Follow @ThreadReaderApp to mention us!

  2. From a Twitter thread mention us with a keyword "unroll"
@threadreaderapp unroll

Practice here first or read more on our help page!

More from @ResearchQf

Jan 25
1) Total global ETF holdings of #gold has gone sideways despite gold +19% since early Nov.

System akin to compressed spring. Less pressure?
Spring bounces.

Δ largely $GLD driven. What if US investors traders actually buy?

1 more chart today.

$SPY $QQQ $TLT $GDX #Commodities Image
2) Cost of $SLV puts vs calls (3M 25 delta) 10D MA not budging despite #silver +33% in several M.

Incredible (to me). And never happened in history of this data.

Whenever silver rose as much since '15 secular low, cost of calls shifted ~8-10 (implied ...
Image
3) vol) points higher than cost of puts.

Even smaller rallies (Mar '16 Apr '20 Nov '21 etc) produced a big shift of > 4 points wrt cost of calls vs puts.

So this one time we (options traders) refuse to fall for it and pay up for calls.

Anyways physical analogies are not ...
Read 5 tweets
Jan 24
1) Largest day of $SLV inflows (+20M oz) by far since #silver squeeze!

Positioning was more bearish despite #gold +19% #silver +31% in few months.

Little buying power was used. If anything there was large selling vs price reference points ...

$SPY $QQQ $TLT $GLD #Commodities Image
2) over last few Y, as well as variety of unusual technical readings that just don't occur after significant rallies.

"Yes there WILL be pullbacks, but I've mumbled could be shorter and shallower than one might usually expect."

Data implies unusually ...
3) high number of sidelined bulls waiting for that correction that might not come. Or happen from much higher levels. This matched broad sentiment that many wanted/expected a correction.

SLV flow today supportive of data. Could barely wait a few hours and few % to buy.

Will ...
Read 7 tweets
Jan 23
1) Quick comment on #silver.

Silver -5.7% from recent peak. So far normal noise in both bull and bear mkts.

Also 17% below 14D 2 St Dev band. Last time? 6/13/22.

And 6/16/21 when 2 St Dev band was this narrow.

Both were during bear markets.

$SPY $QQQ $TLT $GLD #Commodities
2) So will soon test whether this is that shorter and shallower bull mkt correction positioning and technical indicators now suggest.

Note big differences already today. Miners outperforming vs underperforming (e.g. 6/13/22 6/21/21).

#Gold down small vs -$50 the prior days etc.
3) This post already somewhat outdated btw. Silver now down 4.5% from recent high. Gold is barely down.

Btw silver vol is 30%. So weekly vol is 4.2%. And this pullback nothing compared to what often happens even in secular bull markets.

Real question? Is this is a new bull mkt?
Read 7 tweets
Jan 13
1) I respect @garyblack. He deals with facts tho may disagree with analysis.

Here's $TSLA '23 sales and OP est in same format (no updates for US/EU price cuts yet).

'23 cons rev $109B (+33% Y/Y). Cons OP $19B or 17% OM.

~ 10-20% price cuts ...

$SPY $QQQ $TLT $GLD #Commodities ImageImage
2) flows directly to bottom line (assuming all else equal for now e.g. opex unchanged).

It's tough for OM not to decline 50% or more even if units grow > 50% (and I'm doubtful).

I.e. EPS could easily fall 50%.

After every price cut there's a quick orders spike. Unknowns ...
3) dominate after that.

Reminder orders had to double (or more) 1H '23 just to make estimates given depleted backlog (meant Q4 orders were as low as ~200-250K).

Now even if order run rate double (we'll see) profitability falls something in order of ~50%.
Read 4 tweets
Dec 5, 2022
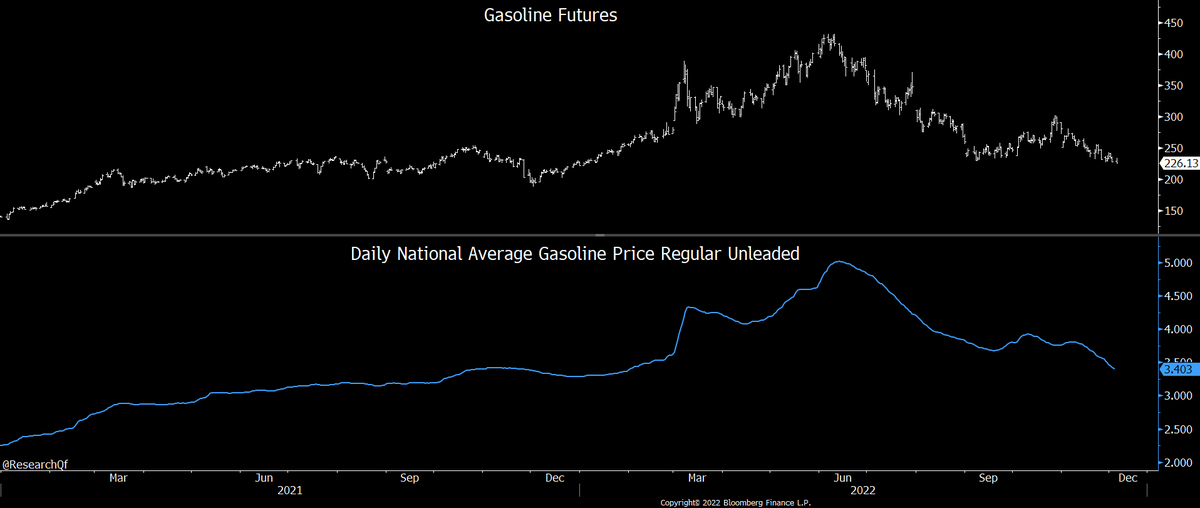
1) #CPI impact of gasoline alone Jun '23.

Gasoline wholesale lowest since Jan '22.

Avg retail $3.84 in Oct, $3.69 in Nov, and Dec may be ~< $3.4.

Jun '22 avg $4.93 vs $3.08 Jun '21 (or +60% Y/Y).

CPI gasoline was also +60% Y/Y Jun '22 so ...

$SPY $QQQ $TLT $GLD #Commodities Image
2) average unleaded over a month is a very good model.

IF (and we don't know this yet) retail gasoline price were ~$3.4 in Jun '23, CPI gasoline would be -31% Jun '23.

From +60% Y/Y in Jun '22 to perhaps -31% in Jun '23 for gasoline CPI?

That's a 90% delta from gasoline alone.
3) Energy (all including gasoline) added 3% to the 9% headline CPI Jun '22.

Could easily subtract ~1.5% by Jun '23, which is a 4.5% swing from energy alone.

M/M impact to headline CPI in Dec will also be significant based on 1).

Used car thread next.
Read 4 tweets
Dec 5, 2022
1) Impressed you can still run monte carlos. Haven't touched one in decades.

If use both data series and propagate errors using certain (think ~ valid) assumptions, get similar statistics last 6M:

165K +/- 64K jobs/M
or
1M +/- 380K jobs/M

$SPY $QQQ $TLT $GLD #Commodities
2) Earlier back of envelope for past 8M was applying 90% CI or 1.65 st dev.

Assumptions incl normal distribution (prob pretty good), uncorrelated data/error (prob ~ ok given data sets) etc.

This is statistical based on BLS data and doesn't adjust for ...
3) part time jobs etc.

Also low 1st response rates have no corr with later NFP revisions but future revision vol does seem much higher if initial response rate is > 10% lower. Just not directional.

Would be interested in your thoughts vs monte carlo.
Read 4 tweets

Did Thread Reader help you today?

Support us! We are indie developers!


This site is made by just two indie developers on a laptop doing marketing, support and development! Read more about the story.

Become a Premium Member ($3/month or $30/year) and get exclusive features!

Become Premium

Don't want to be a Premium member but still want to support us?

Make a small donation by buying us coffee ($5) or help with server cost ($10)

Donate via Paypal

Or Donate anonymously using crypto!

Ethereum

0xfe58350B80634f60Fa6Dc149a72b4DFbc17D341E copy

Bitcoin

3ATGMxNzCUFzxpMCHL5sWSt4DVtS8UqXpi copy

Thank you for your support!

Follow Us on Twitter!

:(