
$btc #bitcoin is suffering from a mini-dump this past couple of days.
ATM, we're trading above the $22,630 level.
On the 1D chart, though, it does not look like structure was broken.
Instead we're trading inside the range we've been in for the last 2 weeks or so
ATM, we're trading above the $22,630 level.
On the 1D chart, though, it does not look like structure was broken.
Instead we're trading inside the range we've been in for the last 2 weeks or so

Let's look at $btc on the 4H chart now
Basically, on the 4H, I'm looking at 4 scenarios;
This is the first scenario - looking for a dip into the FVG, then we get another let up.
Which might be the last leg of this rally before a deeper retracement.
Basically, on the 4H, I'm looking at 4 scenarios;
This is the first scenario - looking for a dip into the FVG, then we get another let up.
Which might be the last leg of this rally before a deeper retracement.

The second scenario would be something like this:
A bearish continuation scenario.
Retest of $23,058, then further downside.
Very plausible. In this case I expect we test at least $22k if not the $21,500 area...
A bearish continuation scenario.
Retest of $23,058, then further downside.
Very plausible. In this case I expect we test at least $22k if not the $21,500 area...
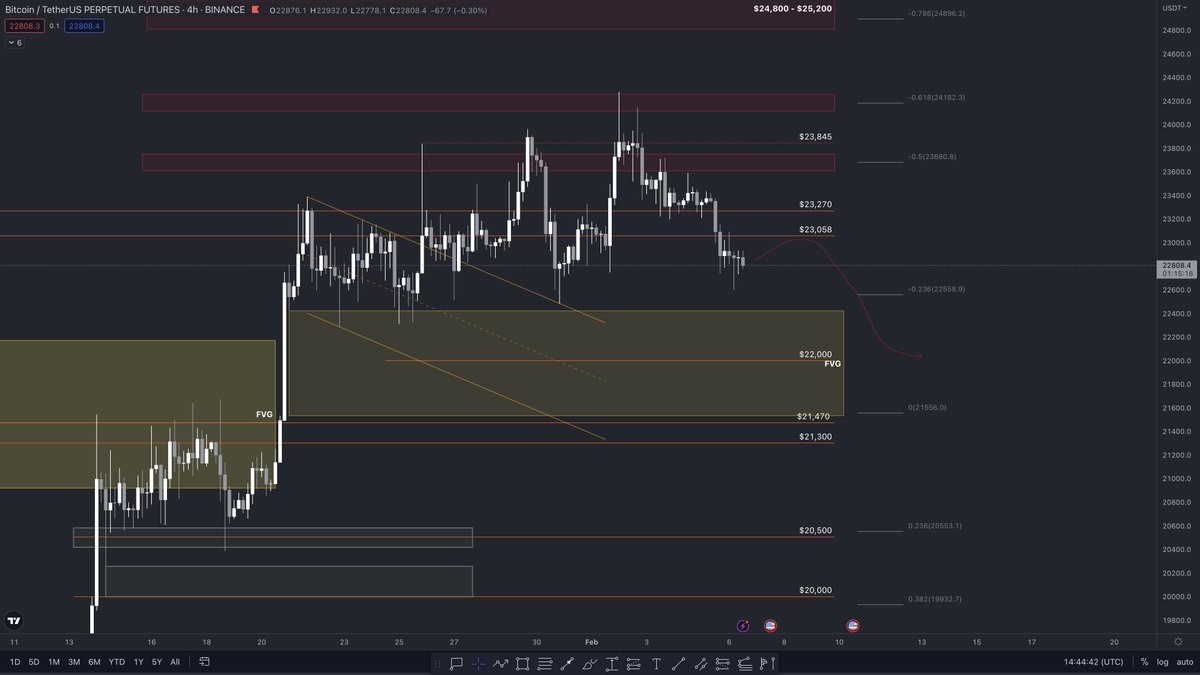
Third scenario for $btc #Bitcoin
This would be the most optimistic, bullish one:
PA back above $23,058, retest & confirm as support, rally higher.
We'll have to observe the markets to determine how probable this is.
It really depends on how people ape into longs.
This would be the most optimistic, bullish one:
PA back above $23,058, retest & confirm as support, rally higher.
We'll have to observe the markets to determine how probable this is.
It really depends on how people ape into longs.

If there's FOMO longing $btc at this level, the MMs will drive price to liquidate those longs.
Again and again, until people stop FOMO longing. Then I believe we can go up.
As long as peeps market long #Bitcoin 100x at current price levels, they're gonna be hunted/liquidated
Again and again, until people stop FOMO longing. Then I believe we can go up.
As long as peeps market long #Bitcoin 100x at current price levels, they're gonna be hunted/liquidated

The rest of the #cryptomarket followed suit and dumped.
$egld #MultiversX is keeping steady.
After having a +10% move last week, $egld retraced ˜50% of the move.
The 0.5 Fib of that move comes in at $44.23 which, as we can see, held up quite nicely
$egld #MultiversX is keeping steady.
After having a +10% move last week, $egld retraced ˜50% of the move.
The 0.5 Fib of that move comes in at $44.23 which, as we can see, held up quite nicely

We must now close on the 4H > $45
for $egld to have any chance of a bullish continuation.
Otherwise we may go further down, to $43 - $43.5 to find support.
If that support area is lost, we go back below $42...
for $egld to have any chance of a bullish continuation.
Otherwise we may go further down, to $43 - $43.5 to find support.
If that support area is lost, we go back below $42...

Let's look at $eth #Ethereum now...
Stuck in a range for quite a while, same as $btc
The levels we had on our charts for 2 weeks now working brilliantly, as you can see
#eth holding it's 0.5 0.618 area of the Fib retracement,
Stuck in a range for quite a while, same as $btc
The levels we had on our charts for 2 weeks now working brilliantly, as you can see
#eth holding it's 0.5 0.618 area of the Fib retracement,

Therefore it is likely we have bullish continuation form here if $1,608 holds as support. We might even be heading to $1,800 if it does.
But, I want to repeat these are just probabilities...
Aaand... it's all contingent on what $btc does!
But, I want to repeat these are just probabilities...
Aaand... it's all contingent on what $btc does!

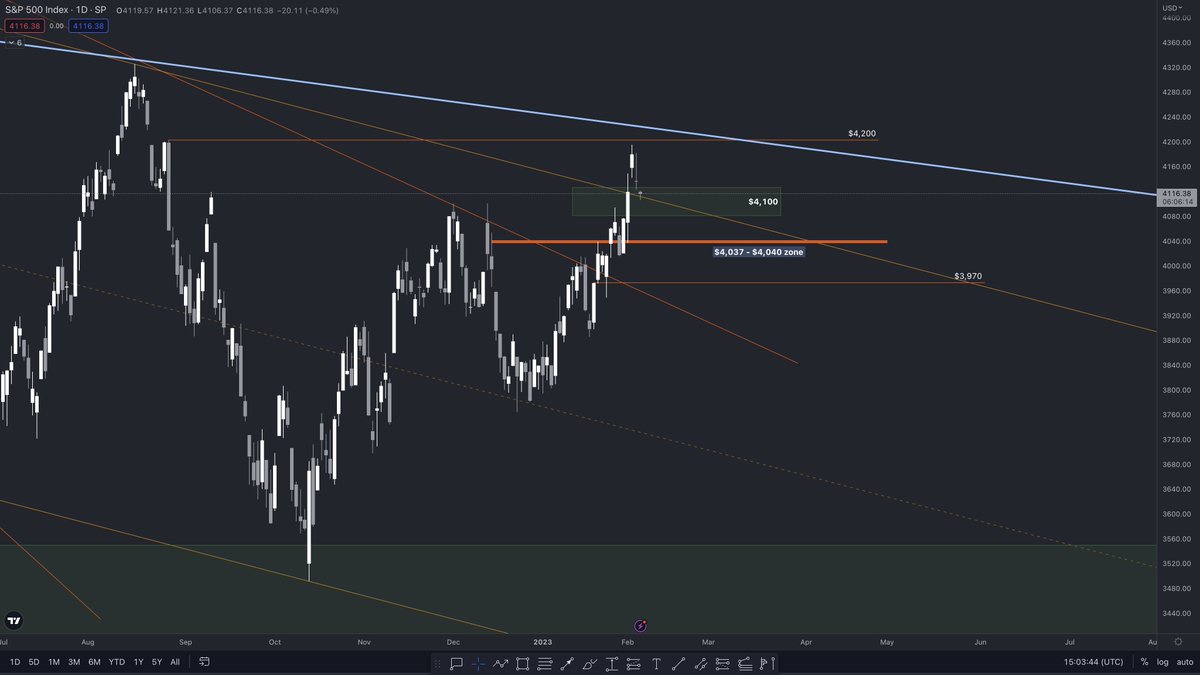
Finally, I wanna look at $SPX on the Daily.
Take a look at the chart below:
Zoomed out & zoomed-in
IMHO, I believe this kinda starts to look like exhaustion.
Therefore if we do get another leg up in #crypto... Pump may be nearing its end
So... Be careful out there 🙏🚨‼️
Take a look at the chart below:
Zoomed out & zoomed-in
IMHO, I believe this kinda starts to look like exhaustion.
Therefore if we do get another leg up in #crypto... Pump may be nearing its end
So... Be careful out there 🙏🚨‼️

If you like this kind of analysis follow me @urus1369
And, remember! A RT + ❤️ gets u some high 5s from Satoshi 🙏
And, remember! A RT + ❤️ gets u some high 5s from Satoshi 🙏
https://twitter.com/urus1369/status/1622612430592397312?s=20&t=QNxfLiUNXLoryBi6n6Ayrw
• • •
Missing some Tweet in this thread? You can try to
force a refresh


