Andy West, PhD Profile picture
Feb 10 8 tweets 4 min read
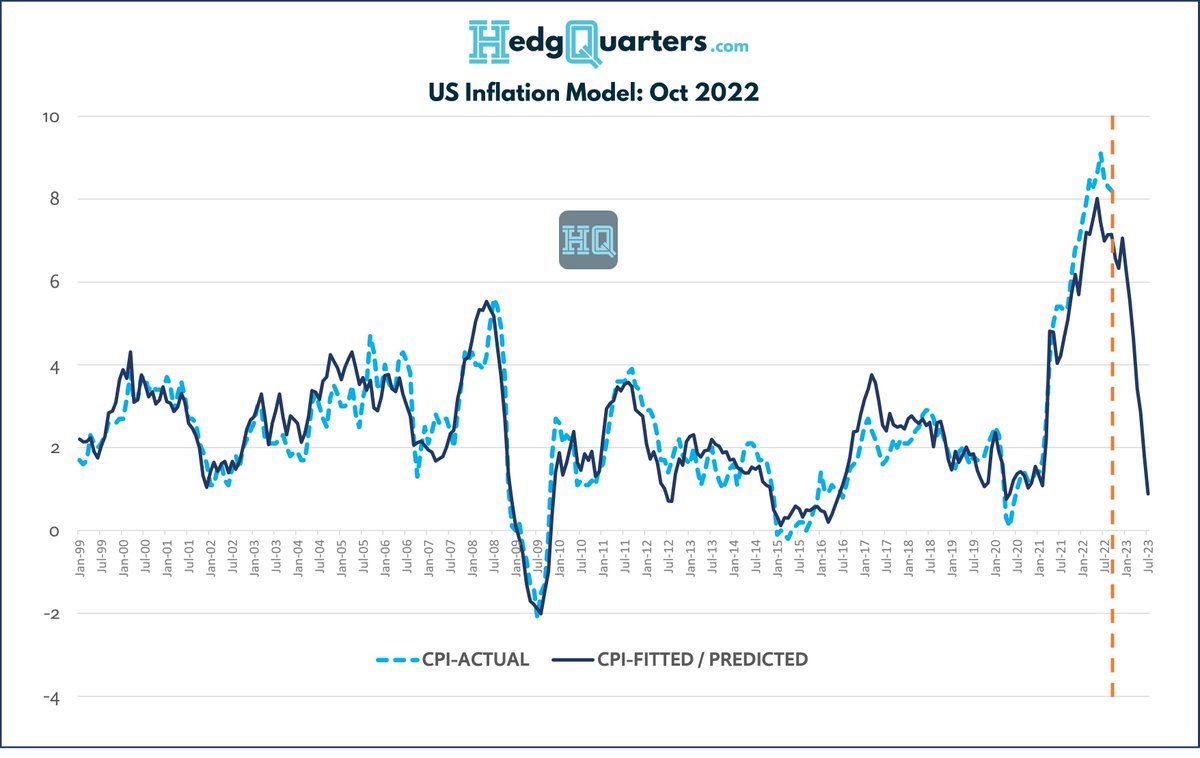
Have #Fed rate hikes led to the slowdown in #inflation we've seen so far?

That's the conventional wisdom anyway. BUT, the San Francisco Fed's own index actually says "NO"!

Why & implications. A thread...
#macro #Stocks #SPX $QQQ

1/8
2/8

This chart (YoY before & MoM below) breaks out Core PCE #inflation into cyclical & Acyclical components

Cyclical are those influenced by the eco cycle, Acyclical are those that have had a statistically insignificant relationship w/ past cycles

Cyclical inflation...
3/8

hasn't declined yet - at least on YoY basis with MoM measures only recently starting to cool. The real cooling so far has been in the Acyclical parts!

This is because, if you look at what heated up first and to the greatest extent in the first chart, it was typically...
4/8 non-cyclical price drivers that accelerated in '21. As world economies reopened synchronously, shortages in production were felt everywhere & prices that are typically more stable rose rapidly

Cyclical prices followed with a lag - an unusual cycle that is still surprising
5/8 As production has caught up with demand, those Acyclical components that are well elevated vs prior cycles have cooled first. Supply chain normalization

Cyclical prices are only just now starting to see the lagged effect of hikes after 12mths.

This is rate lags in action
6/8 Remember as well as you look at this chart again, that this is CORE PCE inflation with Food and energy removed.

So rate hikes that have already been conducted will likely start to influence cyclical components from here. But with the China re-opening, just like the green...
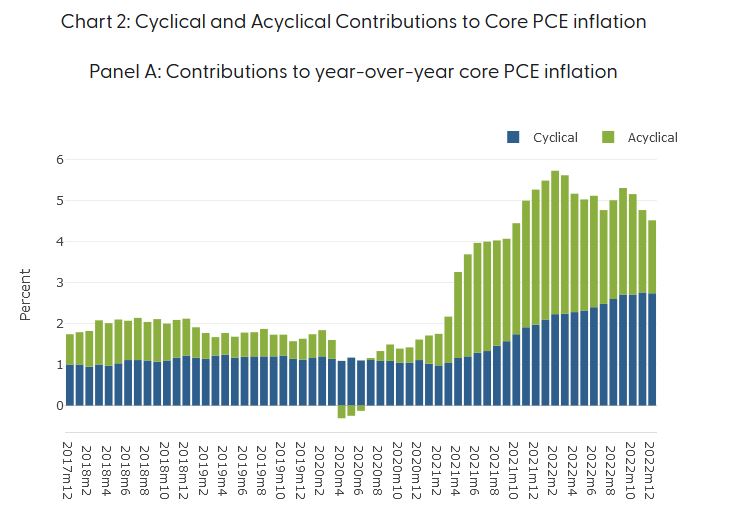
7/8 bars rebounded in Aug/Sep '22, will we see another temporary hump in Acyclical prices again in '23?

With everyone just watching oil & commods mainly, this is something off the radar screen to watch for that can slow the glide path down this year!

Link following:
8/8 Here's the link to track:
frbsf.org/economic-resea…

• • •

Missing some Tweet in this thread? You can try to force a refresh
 

Keep Current with Andy West, PhD

Andy West, PhD Profile picture

Stay in touch and get notified when new unrolls are available from this author!

Read all threads

This Thread may be Removed Anytime!

PDF

Twitter may remove this content at anytime! Save it as PDF for later use!

Try unrolling a thread yourself!

how to unroll video
  1. Follow @ThreadReaderApp to mention us!

  2. From a Twitter thread mention us with a keyword "unroll"
@threadreaderapp unroll

Practice here first or read more on our help page!

More from @andycwest

Feb 5
WHATS HAPPENING WITH US EMPLOYMENT / PAYROLLS and implications
a thread:

1/x

After a +517k Jan 23 payrolls & resilient employment mth after mth despite a year of rate hikes, whats really happening & does it mean soft landing?

read on

#macro #unemployment #stocks $SPY $QQQ
2/x I'm not delving into statistical adjustments, this is about the real backdrop & whats driving overall trends. From that I'll draw some clarifying conclusions.

Here's the recent payrolls numbers charted. The trend shows payrolls normalizing down from elevated levels w/ chop
3/x Why were they elevated at the beginning of '22? Its all about the re-hiring of workers laid off during COVID. This is still on going.

The Chart shows US Total Employed. The US shed ~15% of its workforce as COVID hit and only recently surpassed 2019 levels, now +2% vs then.
Read 17 tweets
Feb 3
#SPX $SPY Breadth Ratio update 🧵:

This situation continues to get more intriguing. After the rally the last 2 days, I expected this signal to be resoundingly rejected

But the % of stocks > their 20 day MA relative to those above 200 MA has fallen below 1... 1/4
$QQQ #stocks Image
2/4 Whats this really showing?

Individual components of the ratio shown below

An increasing % of #stocks are above their 200 MA as expected in a rally, but the % above their 20 MA is flat potentially presaging declining momentum of the rally...

$SPY $QQQ #SPX Image
3/5 When the % > 200MA is very high like now, but the % > 20 day MA starts to weaken, then we typically conclude the rally is in late stage and at risk

This may not be yet - as seen in orange the % > 20DMA can fluctuate at highs for a while. But given some weakening 2day...
Read 5 tweets
Dec 20, 2022
PREPARE FOR HIGHER VOLATILITY:

Important 🧵:

We’ve had a bear mkt rally which has now failed and partially unwound. Brief Santa rally or not, the following chart pack tells a clear story of impending volatility:

#macro #stocks $SPY $QQQ
Financial conditions:

This chart isn’t a mirror image - it’s the GS Fin Cond index against the #SPX. I’ve been tweeting updates on this for 6 mths because when conditions tighten, #stocks roll. Once again the Fed and now BoJ have triggered the tightening needed for inflation 🧯
Yields:

10 year yields are on the rise again with added fuel from the BoJ pivot yesterday. As the benchmark the risk free rate, this is negative for #SPX in the near term
Read 9 tweets
Dec 14, 2022
#Fed day: the down/up reaction of #stocks shows something here for both hawks & doves.

For me (looking ahead), the Fed faces a dilemma in 1H '23. Cool/negative goods/energy inflation but still strong wage gains given tight labor.

Headline CPI...
#macro
will fall (particularly in Q1), potentially to even ~5% by March data, but wage gains will see medium term services & core inflation drivers inconsistent in the Fed's lens with a sustainable return to 2-3% target.

So Mr Mkt is saying based on history, the Fed never keeps...
rates at peak for long (ie the market assumes rate cuts soon after the peak).

But we need to consider that perhaps this time, with the labor pool down due to COVID and structural labor tightness, the #Fed may be FORCED to keep rates at the peak plateau for longer...
Read 10 tweets
Nov 14, 2022
Updated Inflation, rates outlook & prospects for #bonds and #stocks:

We're moving into a new phase of disinflation from here. This is what I expect to see unfold: Update 🧵:

#macro $SPY $QQQ #inflation
Back in early August I wrote that we were about to experience a surge in core inflation into end Q3.

At the time #stocks had rallied strongly and this presaged another pullback given it meant the #Fed had to be more hawkish.

I was a touch early w/ mths:
This played out and I've posted my multi-factor inflation model for US CPI previously. It shows #inflation moderating quickly in mid 2023:

Fair to say this generates skepticism. The narrative is once CPI >5% it stays there for > 2 years. Well where to now? Image
Read 13 tweets
Oct 26, 2022
$GOOGL: I honestly don't even know where to start in breaking down this disaster of a quarter from $GOOG (and no, I'm NOT short, except by way of sector ETF).

Read the usual bulge bracket broker reports and you'd think this is ok. Its NOT and here's why

a 🧵:
$QQQ $SPY
First - is this rev growth a pass or fail? Simply - BIG fail. Here's the internet advertising price growth chart from HedgQuarter's Info Tech Sector Drivers dashboard

Ad prices are still up 10-20% YoY so the 10% rev growth for search ads & 3.8% for YouTube is abysmal.
2nd - are costs being managed? If you were the owner of a business whose mgt grew its headcount by 20% while in the last 2 Qtrs your net revs grew 12% & 7%, I think you'd have a few choice words.

$GOOG mgt bought their own B/S and chowed down. They thought it would last 4ever
Read 6 tweets

Did Thread Reader help you today?

Support us! We are indie developers!


This site is made by just two indie developers on a laptop doing marketing, support and development! Read more about the story.

Become a Premium Member ($3/month or $30/year) and get exclusive features!

Become Premium

Don't want to be a Premium member but still want to support us?

Make a small donation by buying us coffee ($5) or help with server cost ($10)

Donate via Paypal

Or Donate anonymously using crypto!

Ethereum

0xfe58350B80634f60Fa6Dc149a72b4DFbc17D341E copy

Bitcoin

3ATGMxNzCUFzxpMCHL5sWSt4DVtS8UqXpi copy

Thank you for your support!

Follow Us on Twitter!

:(