
The relative strength index is one of the indicators that 99% of trader uses.
A Thread 🧵on RSI
RETWEET ♻ if you find it useful
Course Worth: ₹25K-₹30K
@kuttrapali26 @KommawarSwapnil @Jagadeesh0203 @caniravkaria @sunilgurjar01 @itsprekshaBaid
#StockMarket #trading #stocks
A Thread 🧵on RSI
RETWEET ♻ if you find it useful
Course Worth: ₹25K-₹30K
@kuttrapali26 @KommawarSwapnil @Jagadeesh0203 @caniravkaria @sunilgurjar01 @itsprekshaBaid
#StockMarket #trading #stocks

📍What is RSI?
Relative Strength Index(RSI), developed by J. Welles Wilder, is a momentum indicator that measures the speed and change of price movements.
Divergences and swing failures can be used to generate signals. The RSI can also be used to determine the overall trend.
Relative Strength Index(RSI), developed by J. Welles Wilder, is a momentum indicator that measures the speed and change of price movements.
Divergences and swing failures can be used to generate signals. The RSI can also be used to determine the overall trend.
The RSI oscillates between 0 and 100. Traditionally the RSI is considered overbought when above 70 and oversold when below 30.
But this is not the case in reality. When RSI is above 70, it shows strong momentum, especially in higher timeframes.
But this is not the case in reality. When RSI is above 70, it shows strong momentum, especially in higher timeframes.
📍Application of Overbought and Oversold RSI
👉 RSI above 80
When RSI is above 80, it is considered as an overbought zone. The higher the time frame, the bigger will be the retracement.
When the monthly RSI is above 80, sell the stock and run as big retracement can be seen.
👉 RSI above 80
When RSI is above 80, it is considered as an overbought zone. The higher the time frame, the bigger will be the retracement.
When the monthly RSI is above 80, sell the stock and run as big retracement can be seen.
Below are the images of 3 different timeframes where RSI is above 80. You can see the impact is more on a higher timeframe when RSI is above 80.


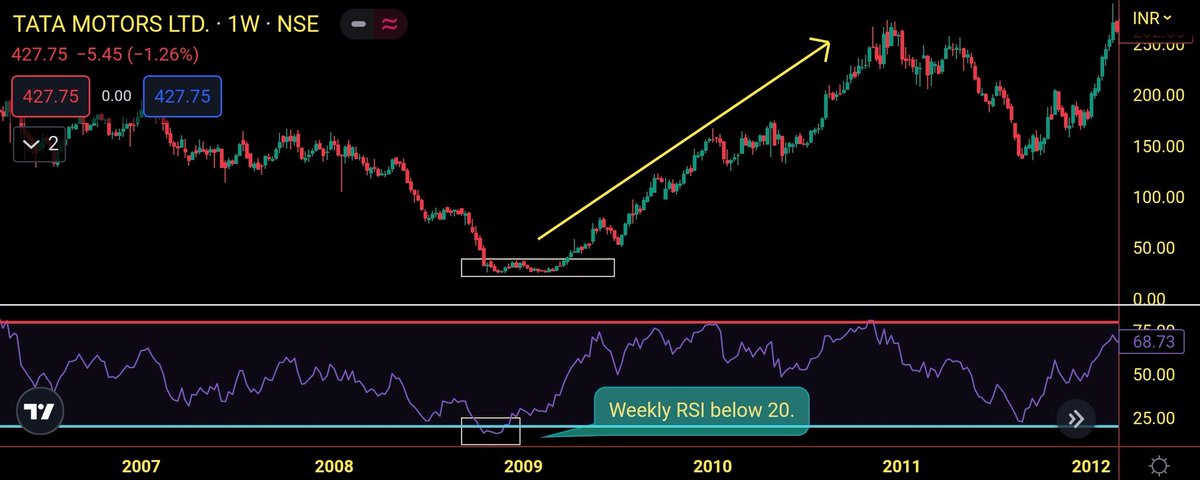
👉 RSI below 20
When RSI is below 20, it is considered as an oversold zone. The higher the time frame, the bigger will be the retracement.
Below are the images of 2 different timeframes when RSI is less than 20. You can see the impact is more on a higher timeframe when RSI<20.
When RSI is below 20, it is considered as an oversold zone. The higher the time frame, the bigger will be the retracement.
Below are the images of 2 different timeframes when RSI is less than 20. You can see the impact is more on a higher timeframe when RSI<20.

📍What is divergence?
An RSI divergence signal shows traders when price action and the RSI are no longer showing the same momentum.
Divergence works better on a higher timeframe.
An RSI divergence signal shows traders when price action and the RSI are no longer showing the same momentum.
Divergence works better on a higher timeframe.
📍Type of RSI Divergence
• Classic Bullish Divergence
• Classic Bearish Divergence
• Hidden Bullish Divergence
• Hidden Bearish Divergence
Classic divergence usually occurs near extremes.
And, hidden divergence usually occurs around the 50 mark.
• Classic Bullish Divergence
• Classic Bearish Divergence
• Hidden Bullish Divergence
• Hidden Bearish Divergence
Classic divergence usually occurs near extremes.
And, hidden divergence usually occurs around the 50 mark.
👉 Bullish Divergence: A bullish divergence occurs when the price falls to lower lows while the RSI rises to higher lows.
The below image is an example of bullish divergence. You can see the price moved up rapidly as marked by the yellow arrow after the bullish divergence.
The below image is an example of bullish divergence. You can see the price moved up rapidly as marked by the yellow arrow after the bullish divergence.

👉 Bearish Divergence: A bearish divergence occurs when the price reaches higher highs, while the RSI makes lower highs.
The below image is an example of bearish divergence. You can see the price moved down rapidly as marked by the yellow arrow after the bearish divergence.
The below image is an example of bearish divergence. You can see the price moved down rapidly as marked by the yellow arrow after the bearish divergence.

👉 Hidden Bullish Divergence: This occurs when the price is making a higher low, but the RSI is showing a lower low.
Bullish hidden divergence only happens in an uptrend and the trend should continue to the upside.
The below image is an example of hidden bullish divergence.
Bullish hidden divergence only happens in an uptrend and the trend should continue to the upside.
The below image is an example of hidden bullish divergence.

👉 Bearish Hidden Divergence: This occurs when the price makes a lower high, but the RSI is making a higher high.
Bearish hidden divergence only happens in a downtrend and the trend should continue to the downside.
The below image is an example of bearish hidden divergence.
Bearish hidden divergence only happens in a downtrend and the trend should continue to the downside.
The below image is an example of bearish hidden divergence.

📍Difference between Classic and Hidden Divergence:
Hidden divergence mainly indicates the continuation of the trend whereas classic divergence indicates trend reversals.
Hidden divergence mainly indicates the continuation of the trend whereas classic divergence indicates trend reversals.
📍When to use classical divergence?
As classical divergence is a trend reversal pattern, it works better near the demand and supply zone.
In the image below, we can see a bullish divergence near the demand zone. Thereafter, the price moved up as marked by the yellow arrow.
As classical divergence is a trend reversal pattern, it works better near the demand and supply zone.
In the image below, we can see a bullish divergence near the demand zone. Thereafter, the price moved up as marked by the yellow arrow.

In the image below, we can see a bearish divergence near the supply zone. Thereafter, the price drops as marked by the yellow arrow.

📍RSI Scalping Strategy 1
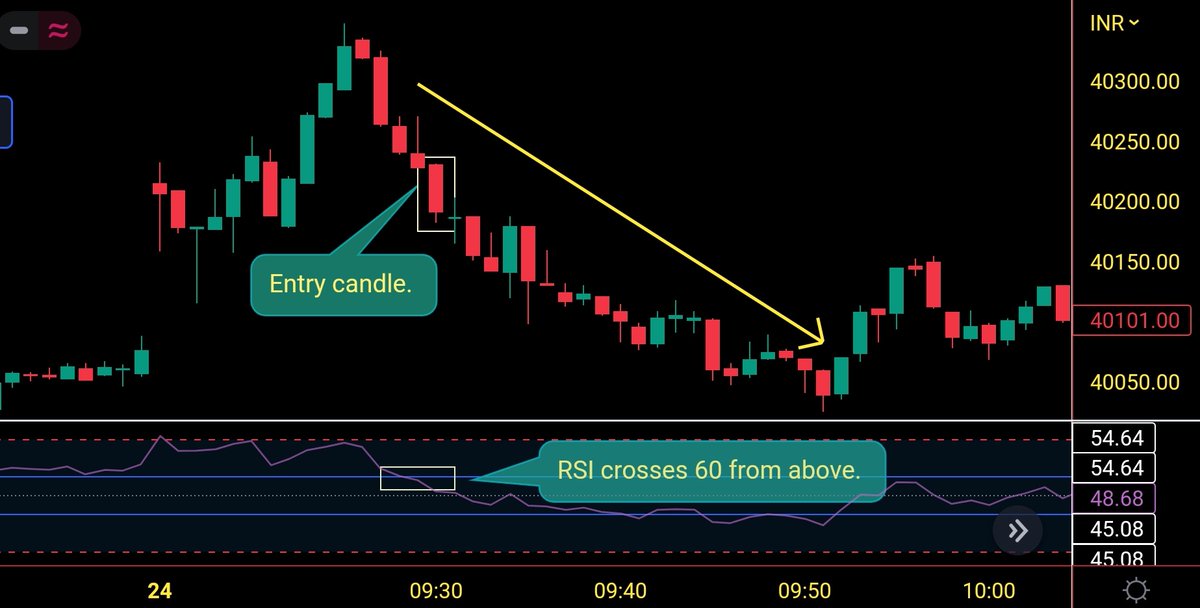
When RSI crosses 60 from above in 1 min time frame, one can buy PE and exit when RSI touches 40.
Stop loss- Entry candle high.
Target- 20-25 points.
This strategy is only for index trading.
Accuracy: 70%
When RSI crosses 60 from above in 1 min time frame, one can buy PE and exit when RSI touches 40.
Stop loss- Entry candle high.
Target- 20-25 points.
This strategy is only for index trading.
Accuracy: 70%
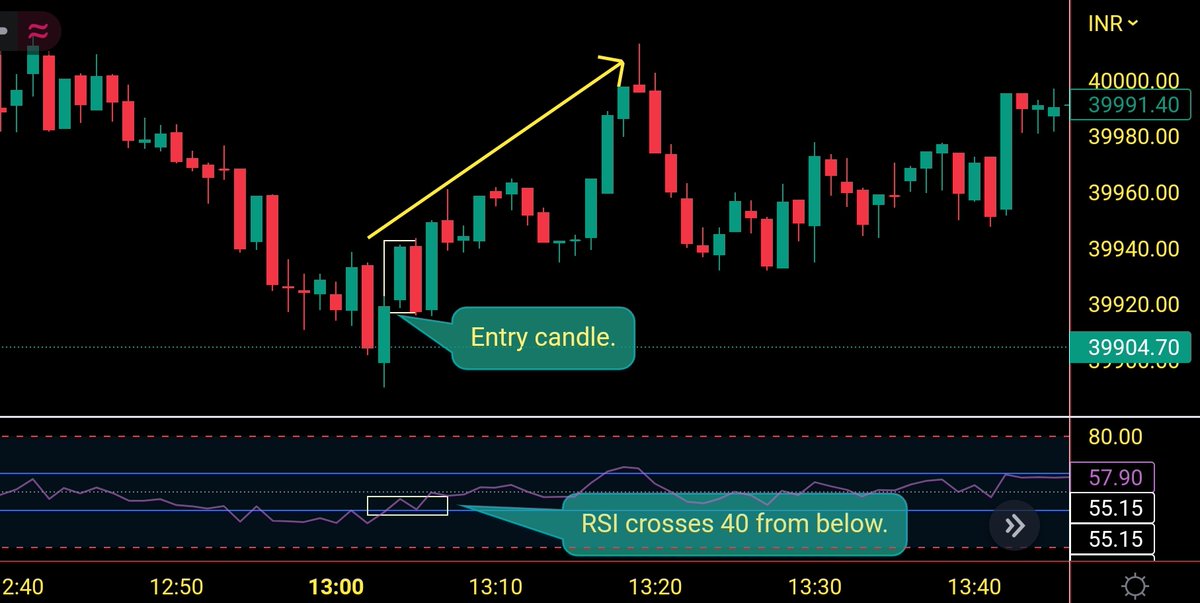
When RSI crosses 40 from below in 1 min time frame, one can buy CE and exit when RSI touches 60.
Stop loss- Entry candle low.
Target- 20-25 points.
This strategy is only for index trading.
Accuracy: 70%
Stop loss- Entry candle low.
Target- 20-25 points.
This strategy is only for index trading.
Accuracy: 70%
📍RSI scalping strategy 2
In the image below, we can see a bullish divergence, then the price rises as marked by the yellow arrow.
TF- 3/5 min
Target- 30-40 points.
SL- 20 points.
In the image below, we can see a bullish divergence, then the price rises as marked by the yellow arrow.
TF- 3/5 min
Target- 30-40 points.
SL- 20 points.

In the image below, we can see a bearish divergence, and then the price drops as marked by the yellow arrow.
TF- 3/5 min
Target- 30-40 points
SL- 20 points
TF- 3/5 min
Target- 30-40 points
SL- 20 points

📍RSI Scalping Strategy 3
In a 15 min timeframe, when RSI is below 20, we can expect a short reversal as depicted in the image below (marked by the yellow arrow).
Timeframe- 15 min
Target- 50-60 points.
SL- 30 points.
In a 15 min timeframe, when RSI is below 20, we can expect a short reversal as depicted in the image below (marked by the yellow arrow).
Timeframe- 15 min
Target- 50-60 points.
SL- 30 points.

In a 15 min timeframe, when RSI is above 80, we can expect the price to decline as marked by the yellow arrow in the image below.
Timeframe- 15 min
Target- 50-60 points.
SL- 30 points.
Timeframe- 15 min
Target- 50-60 points.
SL- 30 points.

📍Trend reversal concept using RSI
When RSI crosses 60 from above in 15 min timeframe, then it is a bearish signal. The trend will change to slightly bearish.
In the image below, we can see when RSI crosses 60 from above, the price continues to fall as marked by a yellow arrow.
When RSI crosses 60 from above in 15 min timeframe, then it is a bearish signal. The trend will change to slightly bearish.
In the image below, we can see when RSI crosses 60 from above, the price continues to fall as marked by a yellow arrow.

When RSI crosses 40 from below in 15 min timeframe, then it is a bullish signal. The trend will change to slightly bullish.
In the image below, we can see when RSI crosses 40 from below, the price continues to rise as marked by the yellow arrow.
In the image below, we can see when RSI crosses 40 from below, the price continues to rise as marked by the yellow arrow.

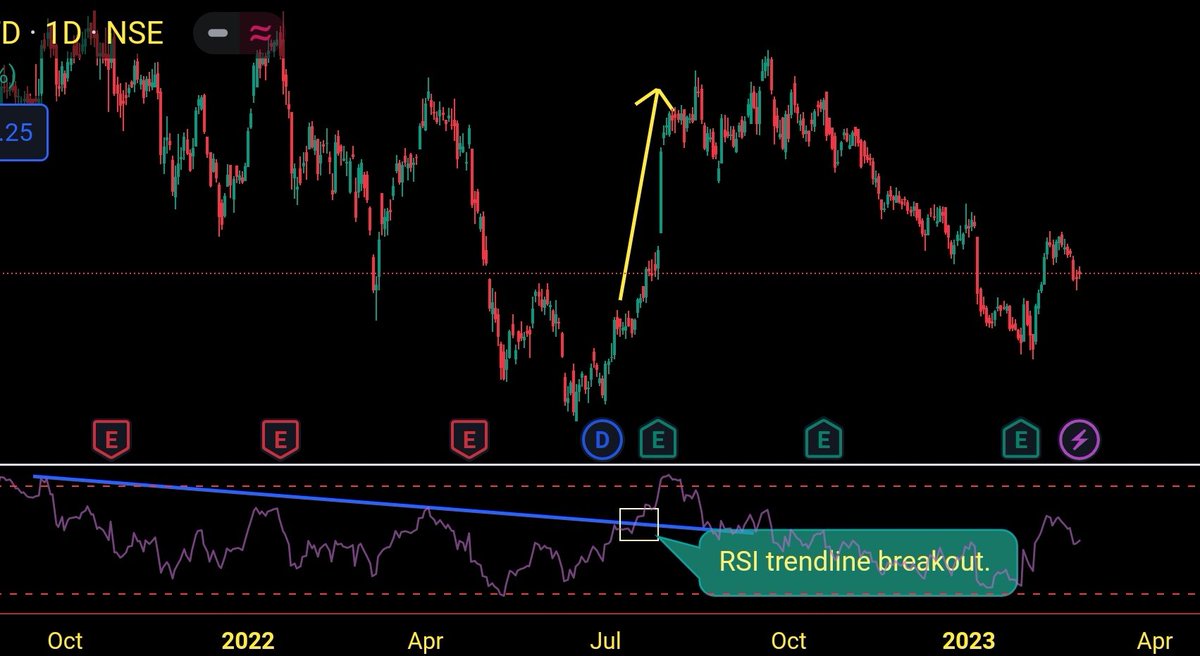
📍RSI trendline breakout/breakdown
In the 1st image, we can see the RSI trendline breakout and since then price moved up as marked by the yellow arrow.
In the 2nd image, we can see the RSI trendline breakdown and since then the price has declined as marked by the yellow arrow.
In the 1st image, we can see the RSI trendline breakout and since then price moved up as marked by the yellow arrow.
In the 2nd image, we can see the RSI trendline breakdown and since then the price has declined as marked by the yellow arrow.

That's a wrap!
If you enjoyed this thread:
1. Follow @me__kaushik for more threads relating to trading.
2. RT the first tweet of this thread for maximum reach.
Also, join our telegram channel for live market updates.t.me/thetradingcirc…
If you enjoyed this thread:
1. Follow @me__kaushik for more threads relating to trading.
2. RT the first tweet of this thread for maximum reach.
Also, join our telegram channel for live market updates.t.me/thetradingcirc…
• • •
Missing some Tweet in this thread? You can try to
force a refresh


