During the past week, I and we conducted an in-depth analysis of the U.S. #economy . The results were not encouraging.
First, I discovered that the banking sector was more fragile than previously thought.
🧵1/8
mtmalinen.substack.com/p/the-us-econo…
First, I discovered that the banking sector was more fragile than previously thought.
🧵1/8
mtmalinen.substack.com/p/the-us-econo…
It also seemed that the U.S. credit markets were in the grips of a (fallacious) complacency, shown on the proportionally milder reaction of the "junk" bonds on the current tightening cycle.
But, can the #Fed support the markets in the current situation? We're not so sure.
2/
But, can the #Fed support the markets in the current situation? We're not so sure.
2/

The good news was that the "zombie-corporation" problem seemed to be less severe than previously thought.
However, we also know that the ultra-easy monetary policies has created weak highly indebted firms.
3/
However, we also know that the ultra-easy monetary policies has created weak highly indebted firms.
3/

Retail sales of the U.S. economy have held up, somewhat, albeit they fell heavily after the Russo-Ukrainian war started, showing how international shocks can affect also the U.S. economy.
However, this had been due to excess savings accumulated during the Covid -era.
4/
However, this had been due to excess savings accumulated during the Covid -era.
4/

Excess savings are currently depleting rapidly with all but collapsed personal saving rate. Most importantly, lending standards of banks are tightening rapidly and they now correspond levels seen during H1 2008.
This implies that the U.S. economy can face a 'sudden stop'.
5/
This implies that the U.S. economy can face a 'sudden stop'.
5/

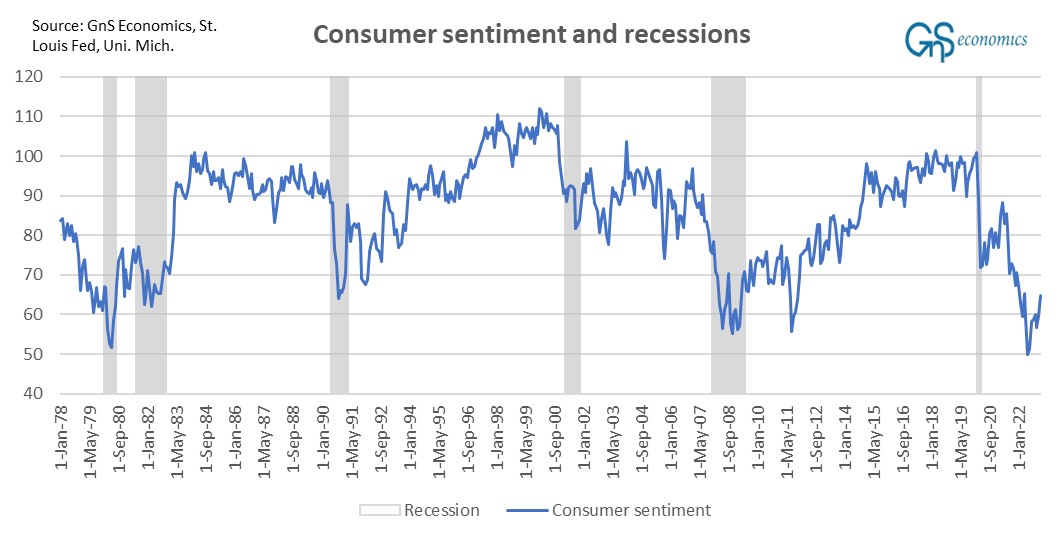
Considering the above, it's no surprise that consumer sentiment is in deeply recessionary levels.
6/
6/

And, while the QT of the #FederalReserve keeps manipulating the yield curves, it should be noted that both 10y/3mo and 10y/2y spreads are currently heavily inverted.
The #recession signal of the yield curve is thus strong.
7/
The #recession signal of the yield curve is thus strong.
7/

Alas, we conclude in our recent Special Issue that, while the U.S. #recession has been postponed, it's still very much on the cards.
Moreover, the issues in the banking sector could easily turn it into a 'hard landing'.
/End
gnseconomics.substack.com/p/deprcon-outl…
Moreover, the issues in the banking sector could easily turn it into a 'hard landing'.
/End
gnseconomics.substack.com/p/deprcon-outl…
• • •
Missing some Tweet in this thread? You can try to
force a refresh


