Rustler Profile picture
Mar 5 8 tweets 7 min read
“When do we deploy the new variant….? “

Daily cases of #OMICRON plotted against daily #Booster vaccines administered

If you don’t believe in ‘Correlation = Causation’

Then get ready to meet

‘Occam’s Razor’

Fcuk #MattHancock and fcuk the #lockdownfiles but this is huge⬇️ Image
England 🏴󠁧󠁢󠁥󠁮󠁧󠁿

1st sSeptember 2021 - 31st March 2022

32,000,000 doses of #COVID19 Booster vaccine administered

12,000,000 cases of COVID19 #OMICRON reported

Was omicron a sales pitch for the booster ?

Did the booster sees the positives ?

2/ Image
At the time of the #OMICRON wave is was clear that the vaccinated - and recently boosted - were driving infection rates

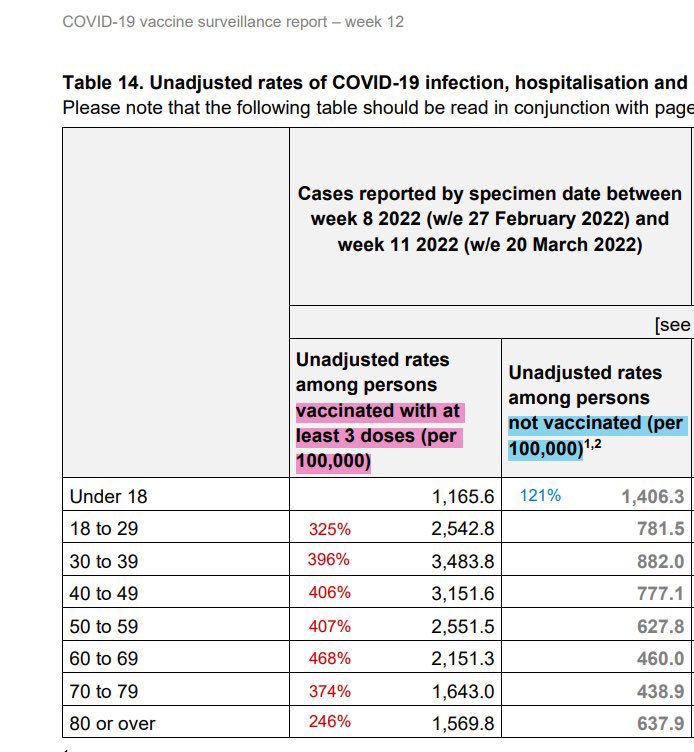
By the end of March 2022, 85% of ‘Cases’ were in the vaccinated, +70% #Boosted

The U.K. HSA would then stop publishing the data by vaccination status …. ImageImageImage
To be honest, I haven’t paid much attention to the #lockdownfiles

It’s all part of a controlled reveal - at their pace, which is 2 years too late!

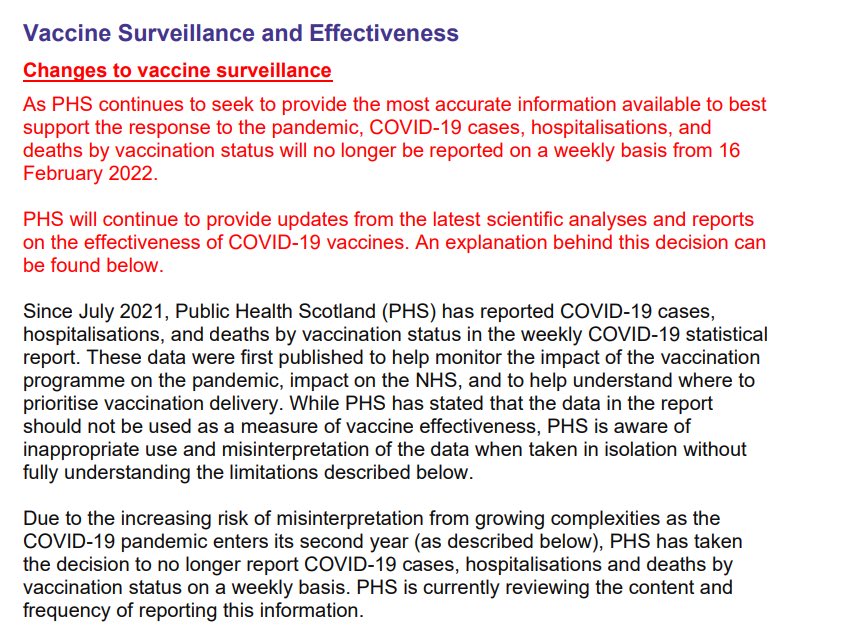
But, when I was surprised at this revelation today ….. even if it is a deliberate red pill for the sleepwalking fannies Image
"Due to the increasing risk of misinterpretation from growing complexities as the COVID-19 pandemic enters its second year, PHS has taken the decision to no longer report COVID-19 cases, hospitalisations and deaths by vaccination status on a weekly basis"

#PHS 2/3/2022 ImageImage
🤢#OMICRON would take over as the dominant VoC into December 2021 - at the height of the Boris promoting everyone be jagged up by January 2022

The S gene target failure #SGTF returned . Once again Doubling the PCR ‘positives’ just as #Alpha had a year earlier … Image

• • •

Missing some Tweet in this thread? You can try to force a refresh
 

Keep Current with Rustler

Rustler Profile picture

Stay in touch and get notified when new unrolls are available from this author!

Read all threads

This Thread may be Removed Anytime!

PDF

Twitter may remove this content at anytime! Save it as PDF for later use!

Try unrolling a thread yourself!

how to unroll video
  1. Follow @ThreadReaderApp to mention us!

  2. From a Twitter thread mention us with a keyword "unroll"
@threadreaderapp unroll

Practice here first or read more on our help page!

More from @TheRustler83

Mar 7
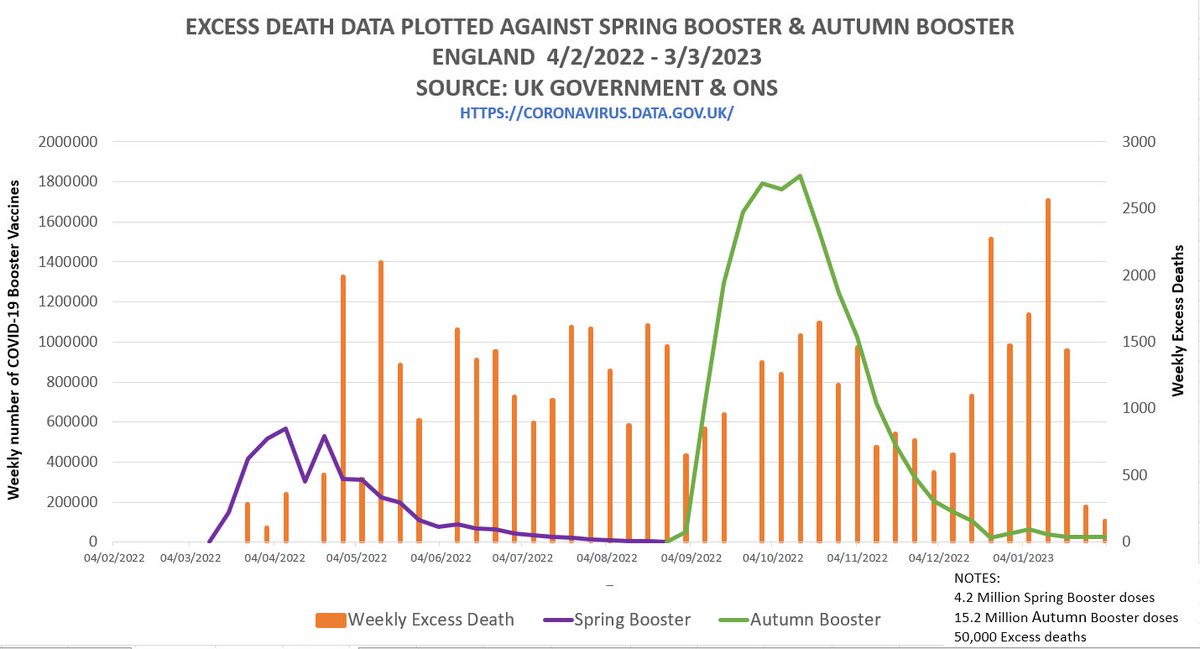
Excess death in #England 🏴󠁧󠁢󠁥󠁮󠁧󠁿

🟧 50,000 excess deaths in England over the past 52 weeks

🟣4.2 Million doses of ‘Spring Booster’ given to over 75s

🟢 15.2 Million doses of ‘Autumn Booster’ given to over 50s

Followed by spikes in #ExcessDeaths

Does correlation = causation ?

1/ Image
Since the roll out of the first #COVID19 booster in September 2021, there has been 50,000 deaths attributed to ‘Covid’

6,000 #Unvaccinated
44,000 #Vaccinated
30,000 #Boosted

53 Million boosters - and STILL we had 44,000 Covid deaths in the vaccinated!

I see correlation

2/ Image
In January 2023, England suffered 6,632 excess deaths (+12% above average)

#Dementia
+1,219
+17.4%

#HeartFailure
+380
+46.9%

#IschaemicHeartDisease
+394
+7.3%

#Other (Ill defined conditions)
+816
+58.2%

#COVID19
2,106

Note the increase in cardiac deaths & ‘Other’

4/ Image
Read 9 tweets
Mar 4
🚨🚨 Scotland has suffered 52 consecutive weeks of excess death since Week 09 of 2022

7,000 excess deaths (+12%)

In that time 0.5M Spring COVID Boosters & 2.0M Winter Boosters have been administered

Experts are #Baffled by what is causing 150 excess deaths per week in 🏴󠁧󠁢󠁳󠁣󠁴󠁿 Image
🚨 Scotland has reported 2,000 ‘COVID’ deaths in the past 52 weeks

In that time, 0.5 Million doses of the COVID-19 spring booster & 2.0 Million doses of winter booster were administered

1,900 of the ‘COVID’ deaths were vaccinated, 1600 had received at least 1 booster 😬 Image
Reports from other countries are showing spikes in excess deaths some 8-12 weeks after the peak of vaccine dose roll out ….

Coincidence ?

Correlation does not equal causation ??

Occam’s Razor ???? 💥💥💥
Read 5 tweets
Feb 27
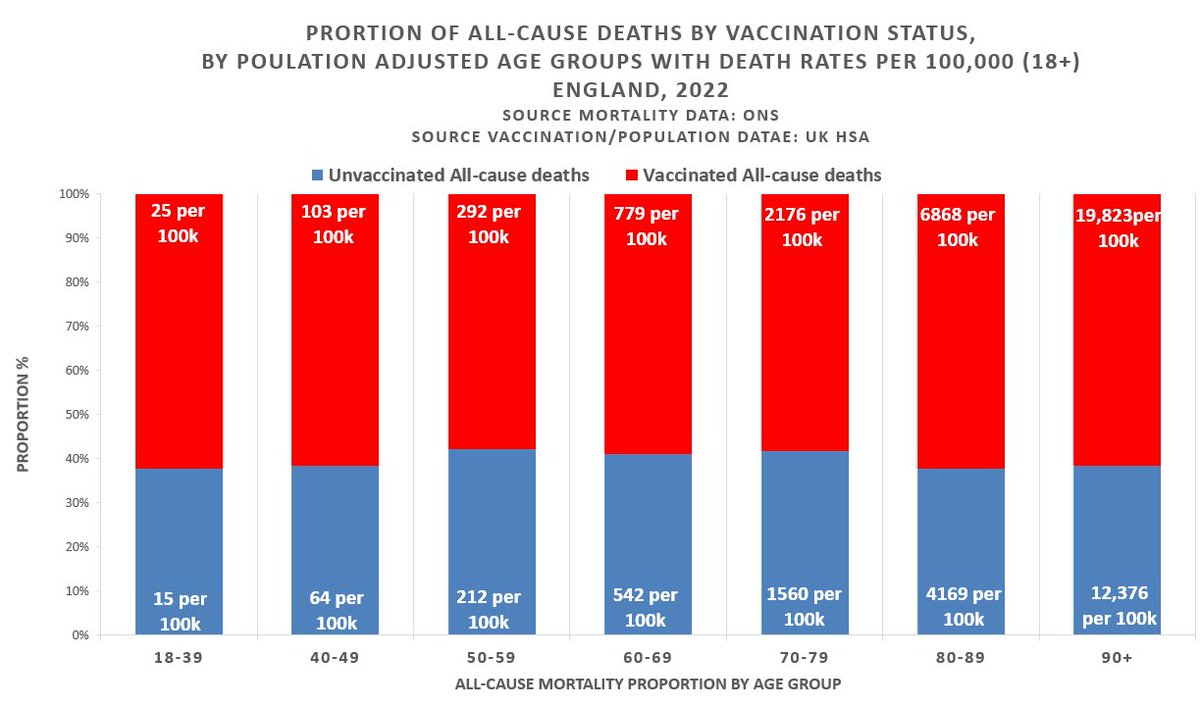
🚨 Rate of All-cause mortality higher in the Vaccinated than Unvaccinated

🚨 Rate of Covid-related mortality higher in the Vaccinated than Unvaccinated

Figures provided by age group, population adjusted per 100,000

England 2022

Source:
Mortality #ONS
Population #UKHSA
1/4
All-cause mortality, by vaccination status,

England
1/1/2022 - 31/12/2022

#Vaccinated
445,000 total deaths
40,000,000 population

#Unvaccinated
18,000 total deaths
9,000,000 population

Source: #ONS #UKHSA #NHS

2/4
Non-Covid mortality, by vaccination status,

England
1/1/2022 - 31/12/2022

#Vaccinated
418,000 Non-Covid deaths

#Unvaccinated
16,000 Non-Covid deaths

Non-Covid mortality rates are higher in the vaccinated across all age groups. Why ?

Source: #ONS #UKHSA #NHS

3/4
Read 6 tweets
Feb 26
🚨🚨All-cause mortality rates, by age & vaccination status, per 100,000 population for England 1/1/2022 - 31/12/2022

The #Unvaccinated have a LOWER all-cause mortality rate than the vaccinated across all age groups

Age 18-39 shown below. Others age groups to follow in 🧵

1/6
🚨All-cause mortality rates, per 100,000 population, England, 2022

Age 40-49

Why would the #Unvaccinated have a lower mortality rate for non-Covid deaths, than the vaccinated?

🔵 Unvaccinated
🟠 1 dose
🔘 2 doses
🔴 Booster dose+
📈 Ever vaccinated

2/6
🚨All-cause mortality rates, per 100,000 population, England, 2022

Age 50-59
#Unvaccinated have a lower mortality rate than the vaccinated

🔵 Unvaccinated
🟠 1 dose
🔘 2 doses
🔴 Booster dose+
📈 Ever vaccinated

Death data from #ONS Vaccination pop. % data from #UKHSA

3/6
Read 13 tweets
Feb 25
#COVID19 Monthly mortality rates, by age, per 100,000 population, England. 2022

Age 18-39

The #Unvaccinated have a lower mortality rate, than any of the vaccinated groups 📉

The data the ONS did not want you to see⬇️

Other age groups in thread 🧵

1/6

Source: #ONS #UKHSA 🇬🇧 Image
#COVID19 Monthly mortality rates, by age, per 100,000 population, England. 2022

Age 40-49

The #Unvaccinated have a lower mortality rate, than any of the vaccinated groups, over the duration of 2022

🔵 Unvaccinated
🟠 1 dose
🔘 2 dose
🔴 Booster dose
📈 Ever vaccinated

2/6 Image
#COVID19 Monthly mortality rates, by age, per 100,000 population, England. 2022

Age 50-59

The #Unvaccinated have a lower mortality rate, than Dose 1 & Dose 2 vaccinated

Booster dose showing marginal benefit📈📉

🔵 Unvaccinated
🟠 1 dose
🔘 2 dose
🔴 Booster dose

3/6 Image
Read 12 tweets
Feb 22
🚨🚨 ONS age-standardised mortality rates by vaccination status for all-cause, per 100,000 pension years⬇️

All-cause deaths are higher amongst 1 dose, 2 dose & 3 dose (<21 days) vaccinated than in the #Unvaccinated

Boosted (>21 days) marginal benefit over #Unvaccinated

#ONS Image
🚨🚨 ONS age-standardised mortality rates by vaccination status for all-cause, per 100,000 pension years⬇️

Same #ASMR chart, with the data table provided

A reminder that ONS omitted to include the 2022 Spring Booster (Dose 4) or 2022 Autumn Booster (Dose 5) with this upload🤔📈 Image
🚨🚨 ONS age-standardised mortality rates by vaccination status for deaths involving #COVID19 per 100,000 pension years⬇️

Covid deaths are higher amongst 1 dose & 2 dose & vaccinated than in the #Unvaccinated

Booster dose shows marginal benefit

Source: ons.gov.uk/peoplepopulati… Image
Read 10 tweets

Did Thread Reader help you today?

Support us! We are indie developers!


This site is made by just two indie developers on a laptop doing marketing, support and development! Read more about the story.

Become a Premium Member ($3/month or $30/year) and get exclusive features!

Become Premium

Don't want to be a Premium member but still want to support us?

Make a small donation by buying us coffee ($5) or help with server cost ($10)

Donate via Paypal

Or Donate anonymously using crypto!

Ethereum

0xfe58350B80634f60Fa6Dc149a72b4DFbc17D341E copy

Bitcoin

3ATGMxNzCUFzxpMCHL5sWSt4DVtS8UqXpi copy

Thank you for your support!

Follow Us on Twitter!

:(