CIMA Research Foundation Profile picture
Mar 10, 2023 10 tweets 7 min read Read on X
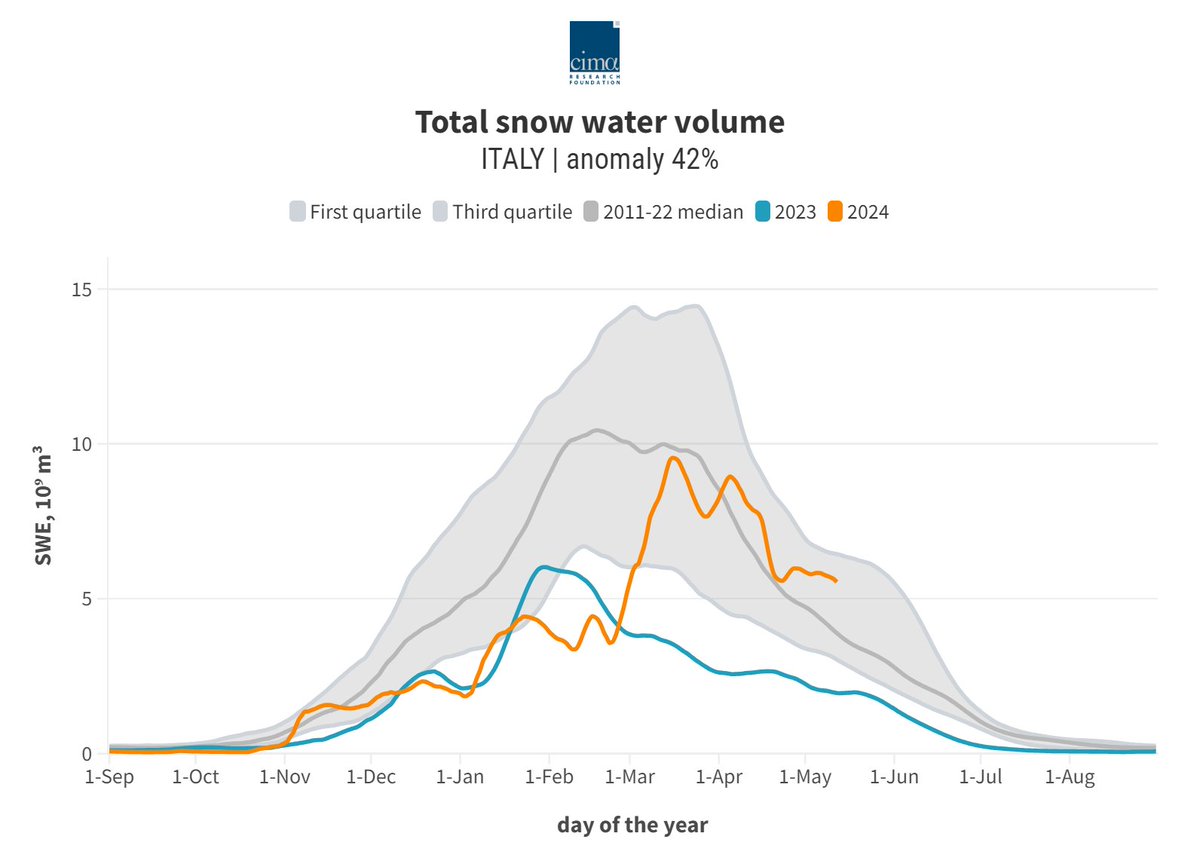
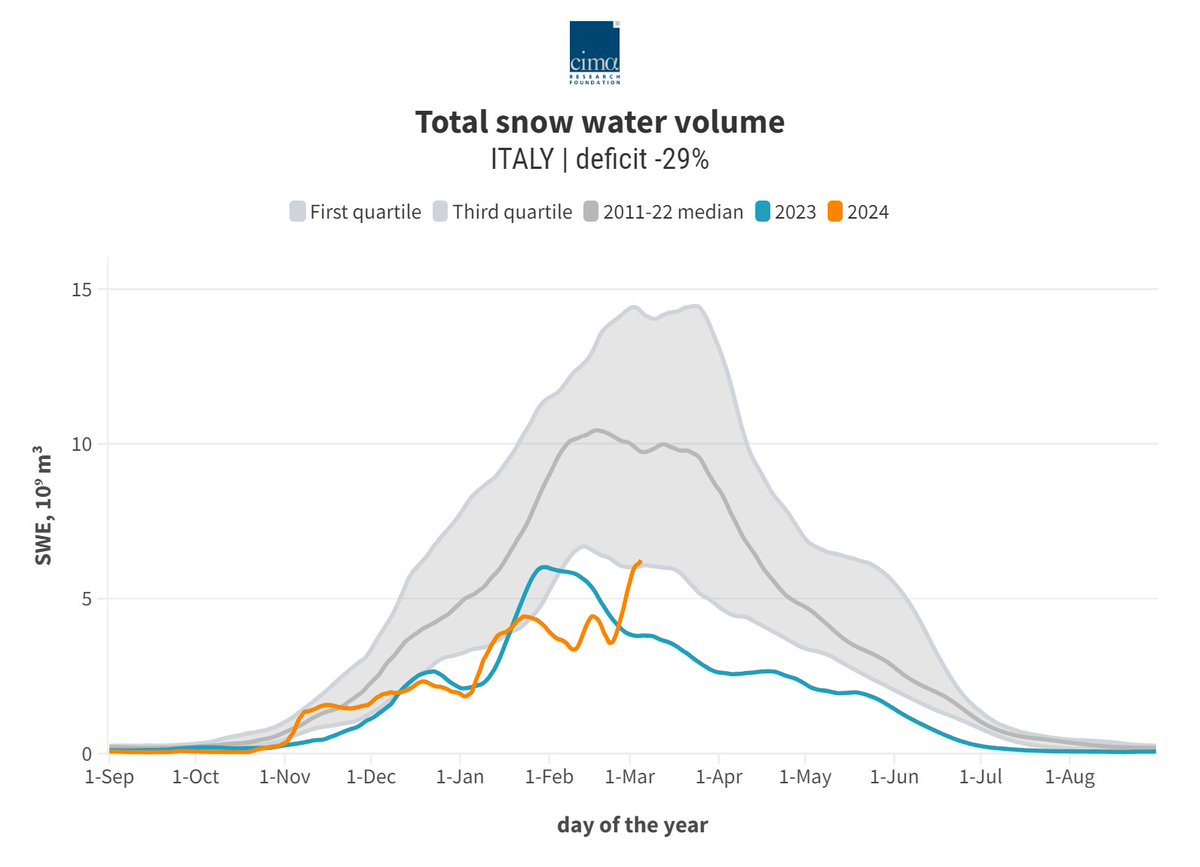
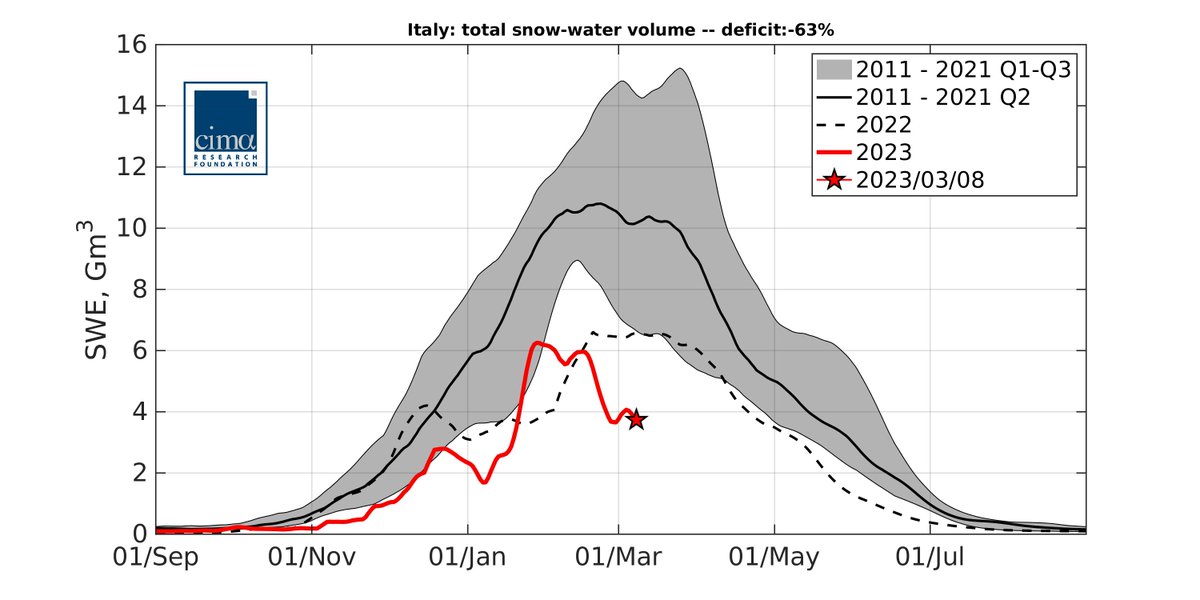
After some cold weather at the end of February, how is the deficit in #snow water resources doing across #Italy? Snowfalls did not change much, as we still estimate a total deficit of -63% 👇 This means we have about 1/3 of recent-year snow for this date. @DPCgov
A thread 🧵👇
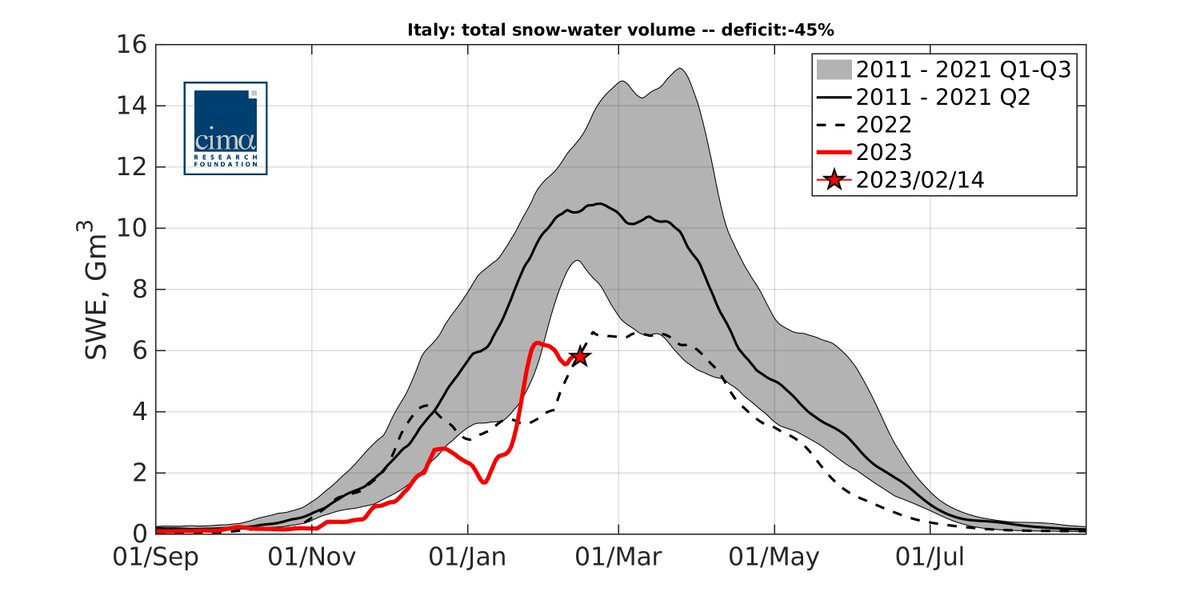
👆 Did you notice that?
We were in a much better spot at the end of January.
What has happened since then?
Well, we experienced a significant warm spell in February, which depleted about 1/3 of snow water resources.
We learned this: warm temperatures = less snow…
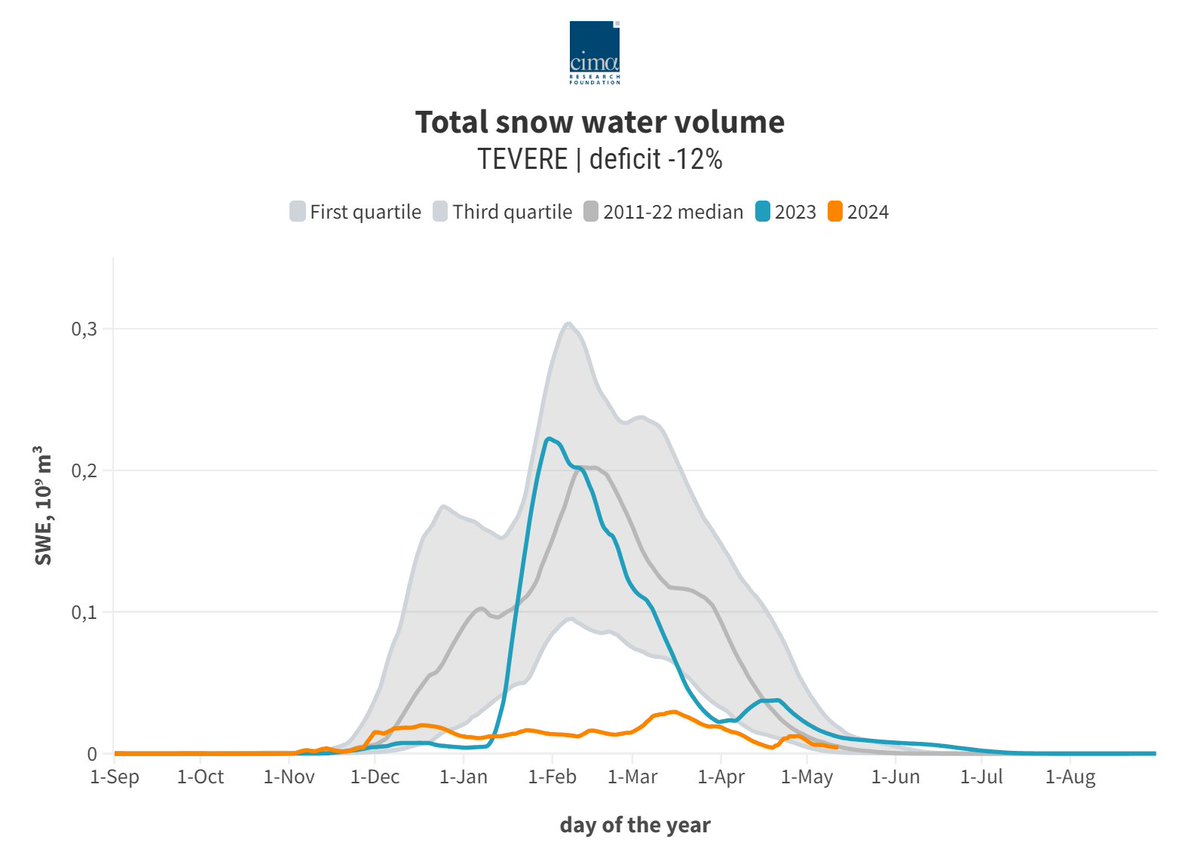
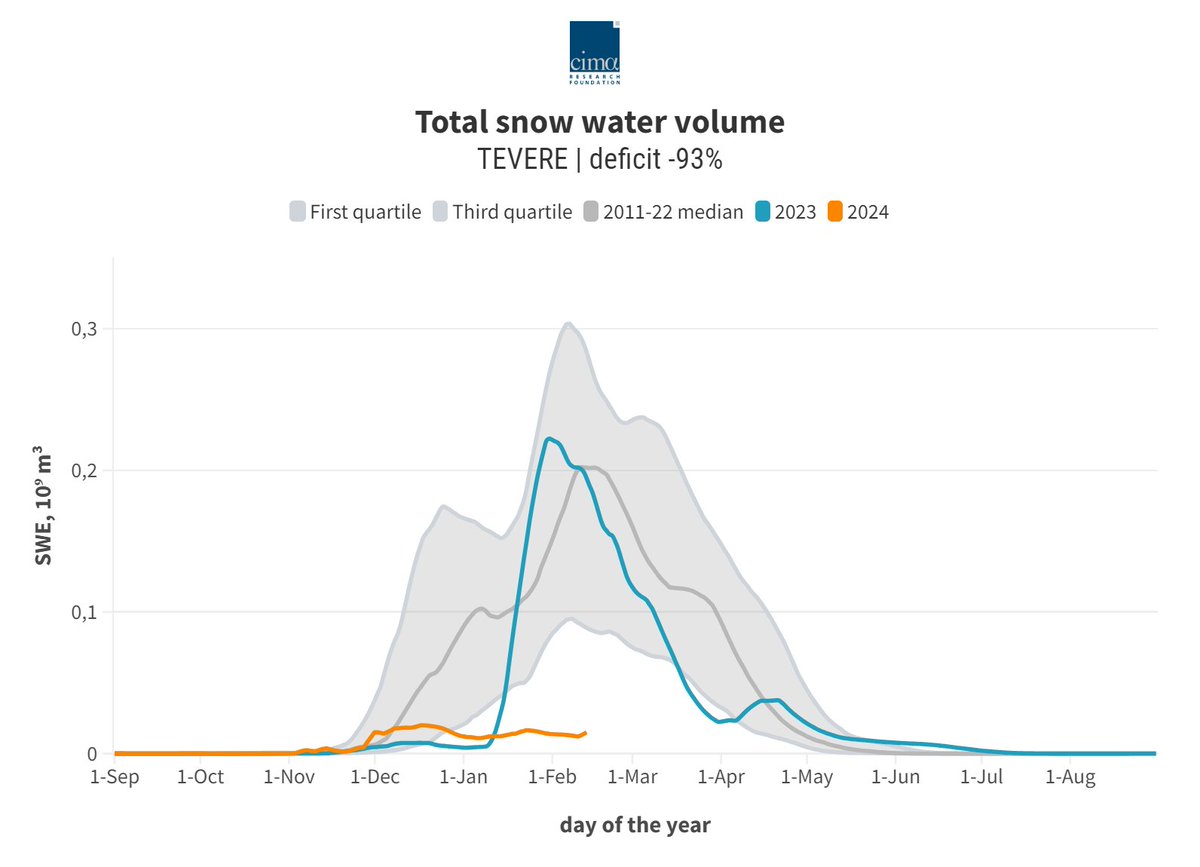
It is not only the Italian #Alps that are experiencing a significant, profound deficit. Most of the #Apennines are back to the deficit zone after a snowy January. Again, such high temperatures can only lead to faster than usual snowmelt and very short accumulation.
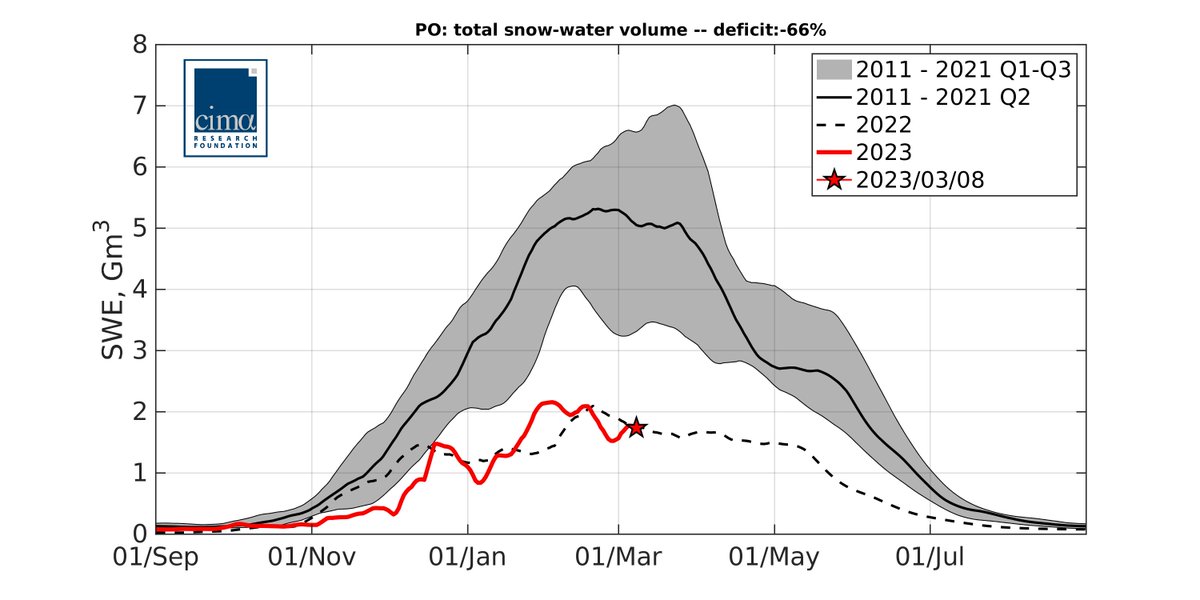
The #Po river basin hosts 50% of Italian snow water resources, providing freshwater to various economic sectors and ecosystems. Unfortunately, there the deficit is larger than the national picture: -66%. The situation is similar to 2022, an already dry and warm year.
Look at how 2023 #snow compares to last year! 👇 While the south-western Italian #Alps have recently enjoyed deeper snowpacks than last year, the north-eastern and eastern Italian Alps have less snow – especially at low elevations. It is a systemic #deficit across the Alps.
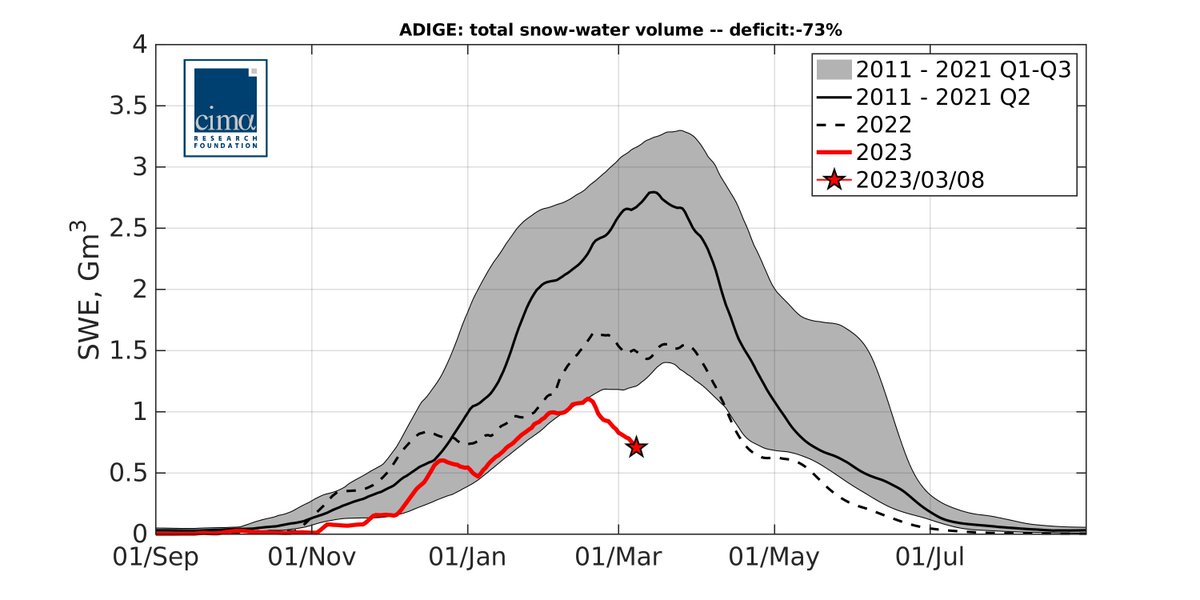
Indeed, the other large contributor to our national #water resources – the #Adige river – is also experiencing a profound deficit: -73%.
Do you see how snow water resources started declining in mid February?
That’s the effect of winter warm temp at play in front of us…
With most of the snow season behind us, it is about time to focus on the implications. What have we learned from previous snow deficits?
First, that low snow water resources often lead to a decline in hydro production at Alpine scale 👇 (hydro data by @TernaSpA).
Second, a warm-dry year like 2022 saw 50% less snow, but +40% more irrigation water requirements 👇 It is a “perfect storm” for our mountains, which provide less snowmelt when we would need more water than usual.
Estimates from Aosta valley, collab with @ArpaValledAosta.
To recap: today’s lack of #snow will likely be tomorrow’s lack of #water. March 4 generally sees peak-snow accumulation in IT, so we likely passed the period with the largest amount of snow.
We will post again in early April, during the snowmelt season! bit.ly/3L8WhOZ
These data come from S3M Italy, a real-time operational tool we developed for the Italian @DPCgov also to estimate snow water resources using models, satellite data and ground measurements.
We simulated since 2010 & data are freely available here: zenodo.org/record/7034956…

• • •

Missing some Tweet in this thread? You can try to force a refresh
 

Keep Current with CIMA Research Foundation

CIMA Research Foundation Profile picture

Stay in touch and get notified when new unrolls are available from this author!

Read all threads

This Thread may be Removed Anytime!

PDF

Twitter may remove this content at anytime! Save it as PDF for later use!

Try unrolling a thread yourself!

how to unroll video
  1. Follow @ThreadReaderApp to mention us!

  2. From a Twitter thread mention us with a keyword "unroll"
@threadreaderapp unroll

Practice here first or read more on our help page!

More from @CIMAFoundation

May 14
È tempo di un nuovo #aggiornamento sullo stato della risorsa idrica nivale in #Italia! Abbiamo superato il picco di marzo-aprile con un surplus importante (+42%), quindi tiriamo le somme per quest’anno.
Ecco 4 lezioni che abbiamo imparato e 3 messaggi per i prox mesi!
Thread🧵👇 Image
Lezione 1⃣: da inizio marzo in poi, la situa #neve è cambiata molto sulle Alpi. Cosa abbiamo imparato? Che per avere neve…serve che nevichi😉In altre parole, serve che il meteo sia fresco (sx) e umido (dx), un po’ come nelle ultime settimane sulle Alpi, ma non sugli Apennini🙁
Image
Image
Infatti sugli Appennini la stagione si chiude praticamente senza essere iniziata (deficit attuale sul Tevere: -12%, ma ormai è una sottostima).
Ecco la lezione 2⃣: NON ESISTE una “#siccità Italiana”, il nostro paese è climaticamente complicato ed esistono tante situazioni locali. Image
Read 12 tweets
Mar 8
Intense nevicate sulle Alpi in questi giorni!❄️
Viceversa, la situazione è ancora molto negativa sugli Appennini. Complessivamente, il #deficit di risorsa idrica nivale nazionale è in ripresa, anche se rimane sotto media: -29%.
Cosa sta succedendo? Scopriamolo con un thread…🧵👇 Image
Un po’ di contesto: dal punto di vista delle #precipitazioni, febbraio è stato più generoso del solito al nord - in particolare al nord ovest. Al centro sud, al contrario, febbraio è stato ancora avaro... Image
Di conseguenza, le condizioni di innevamento sono finalmente migliorate in molte aree alpine italiane. 🎉
Per esempio, per la prima volta in tre anni il #Po vede un deficit all’interno della “normale” variabilità interannuale per questo periodo della stagione: -11%. Image
Read 12 tweets
Feb 16
Nuovo aggiornamento sulla risorsa idrica nivale italiana: anche quest’anno osserviamo un forte #deficit rispetto all’ultimo decennio (-64% a scala nazionale). Le condizioni sono particolarmente gravi nelle aree Appenniniche, dove la stagione nivale ad oggi è non pervenuta. 🧵👇 Image
Partiamo dagli #Appennini allora: ecco la risorsa idrica nivale attuale sul #Tevere. 👇
Abbiamo all’incirca 1/20 dell’#acqua in #neve a monte della Capitale rispetto al periodo recente. Le condizioni sono stazionarie da novembre, dopo l’ultima nevicata significativa (!) Image
Questa situazione non riguarda solo gli Appennini centrali. Ecco il #Simeto (CT): un po’ di neve a inizio gennaio, ma poi caldo e secco = fusione precoce. La neve in questa zona rappresenta un “piccolo” quantitativo in senso assoluto, ma è indice di una #siccità più generale. Image
Read 9 tweets
Mar 10, 2023
Dopo il freddo di fine febbraio, come sta andando il deficit di risorse idriche nivali in #Italia? Le nevicate non hanno cambiato molto, infatti stimiamo ancora un deficit del -63% 👇 Ad oggi abbiamo circa 1/3 della neve degli ultimi anni. @DPCgov
Un thread🧵👇
👆 L'avete notato? A fine gennaio eravamo in una situazione molto migliore.
Cosa è successo da allora?
A febbraio abbiamo avuto un periodo di caldo significativo, che ha esaurito circa 1/3 delle risorse idriche nivali.
Lo abbiamo imparato: temperature calde = meno neve...
Non solo per le #Alpi italiane il deficit è significativo. La maggior parte degli #Appennini è tornata in deficit dopo un gennaio nevoso. Anche qui, temperature così elevate non possono che portare ad una fusione della neve più rapida del solito e a un accumulo più breve.
Read 10 tweets
Feb 16, 2023
It’s mid-Feb and two more weeks have passed in the 2023 Italian #snow-season marathon. Mixed weather, with cold air but overall dry conditions – especially in the Alps.
So, how is the Italian deficit in snow-water resources doing at the moment?

A thread 👇🧵
We haven’t seen much new snow since late-January snowfalls, and thus estimate half of snow water resources at national scale compared to 2011-21 (deficit: -45%). At national scale, conditions remain similar to 2022, which was already a significant #drought year. 👇
A recap about this plot 👆
X axis is time, from autumn to summer.
Y axis is Snow Water Equivalent, i.e., how much water we have in snow (the higher, the better).
Black line: median for 2011-2021; red line: 2023; dashed line: 2022.
Read 12 tweets
Feb 16, 2023
Siamo a metà febbraio e sono passate altre due settimane di maratona per la stagione 2023 della #neve in Italia. ❄️
Aria fredda ma condizioni complessivamente asciutte, soprattutto sulle Alpi... Come sta andando il #deficit italiano di risorse idriche nivali?
Leggi il thread👇🧵
Non abbiamo visto molte nuove nevicate dopo la fine di gen. Al momento, quindi, stimiamo che le risorse idriche nivali su scala nazionale siano la metà rispetto al 2011-21 (deficit -45%).
A livello nazionale, le condizioni rimangono simili al 2022, un anno di #siccità rilevante👇
Un riepilogo su questo grafico 👆
L'asse X è il tempo, dall'autunno all'estate.
L'asse Y è lo Snow Water Equivalent, cioè quanta acqua abbiamo nella neve (più è alta, meglio è).
Linea nera: mediana per il periodo 2011-2021.
Linea rossa: 2023.
Linea tratteggiata: 2022.
Read 12 tweets

Did Thread Reader help you today?

Support us! We are indie developers!


This site is made by just two indie developers on a laptop doing marketing, support and development! Read more about the story.

Become a Premium Member ($3/month or $30/year) and get exclusive features!

Become Premium

Don't want to be a Premium member but still want to support us?

Make a small donation by buying us coffee ($5) or help with server cost ($10)

Donate via Paypal

Or Donate anonymously using crypto!

Ethereum

0xfe58350B80634f60Fa6Dc149a72b4DFbc17D341E copy

Bitcoin

3ATGMxNzCUFzxpMCHL5sWSt4DVtS8UqXpi copy

Thank you for your support!

Follow Us!

:(