Inside bar trading strategy is a popular trading strategy among traders.
𝗔 𝗧𝗵𝗿𝗲𝗮𝗱 🧵 𝗼𝗻 𝗜𝗻𝘀𝗶𝗱𝗲 𝗕𝗮𝗿 by @me__kaushik
RETWEET ♻ if you find it useful.
#StockMarket #StockMarketindia #trading #stocks
𝗔 𝗧𝗵𝗿𝗲𝗮𝗱 🧵 𝗼𝗻 𝗜𝗻𝘀𝗶𝗱𝗲 𝗕𝗮𝗿 by @me__kaushik
RETWEET ♻ if you find it useful.
#StockMarket #StockMarketindia #trading #stocks

📍What is Inside bar?
An Inside bar means the high and low of the baby candle is completely within the high and low of the Mother candle.
The image below is an example of an inside bar where we can see the baby candle is completely inside the Mother candle.
An Inside bar means the high and low of the baby candle is completely within the high and low of the Mother candle.
The image below is an example of an inside bar where we can see the baby candle is completely inside the Mother candle.


📍When to trade Inside Bar?
Inside bars can be traded in trending markets in the direction of the trend.
Inside bars can also be traded near demand and supply zone, when traded this way they are often referred to as inside bar reversals.
Inside bars can be traded in trending markets in the direction of the trend.
Inside bars can also be traded near demand and supply zone, when traded this way they are often referred to as inside bar reversals.
📍How to trade Inside Bar?
For Breakout:
•Entry above Mother candle high.
•Stop loss below mother candle low.
For Breakdown:
•Entry below Mother candle low.
•Stop loss above mother candle high.
We can see in the images below, the entry and SL point of BO and BD.
For Breakout:
•Entry above Mother candle high.
•Stop loss below mother candle low.
For Breakdown:
•Entry below Mother candle low.
•Stop loss above mother candle high.
We can see in the images below, the entry and SL point of BO and BD.

📍Trend Continuation
The example below shows what it looks like to trade an inside bar pattern in a trending market.
In the images below, we can see that after the breakout and breakdown, the price continues to move in the same direction.
The example below shows what it looks like to trade an inside bar pattern in a trending market.
In the images below, we can see that after the breakout and breakdown, the price continues to move in the same direction.


📍Trend Reversal
When an inside candle is formed at the key demand zone, we can see a reversal in price as shown in the 1st image.
When an inside candle is formed at the key supply zone, we can see a reversal in price as shown in the 2nd image.
When an inside candle is formed at the key demand zone, we can see a reversal in price as shown in the 1st image.
When an inside candle is formed at the key supply zone, we can see a reversal in price as shown in the 2nd image.


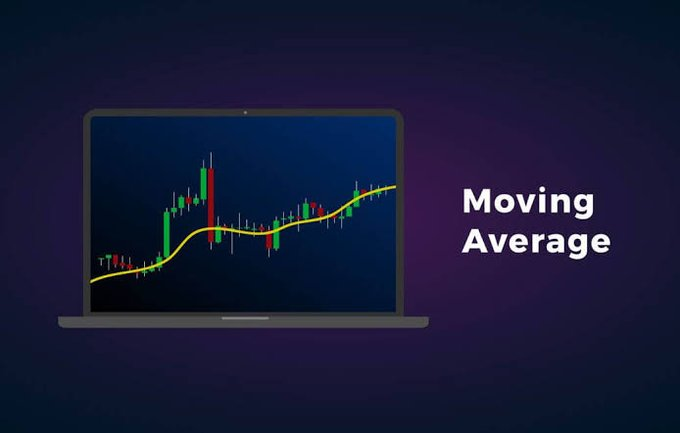
📍Inside bar acts as support and resistance near 20 EMA.
In the image below, we can see the price bounced from 20 EMA and then formed an inside bar. After the inside bar breakout, we can see that price continues to rally upside as marked by the yellow arrow.
In the image below, we can see the price bounced from 20 EMA and then formed an inside bar. After the inside bar breakout, we can see that price continues to rally upside as marked by the yellow arrow.

In the image below, we can see the price got rejected from 20 EMA and then formed an inside bar. After the inside bar breakdown, we can see that price continues to rally downside as marked by the yellow arrow.

📍Inside bar scalping strategy
When an inside bar breakout is given with RSI above 60, we can see an upside move as shown in the image below by the yellow arrow
Entry: Mother candle high on closing basis
SL: Mother candle low on closing basis
Target: 1:2 and above
Accuracy-70%
When an inside bar breakout is given with RSI above 60, we can see an upside move as shown in the image below by the yellow arrow
Entry: Mother candle high on closing basis
SL: Mother candle low on closing basis
Target: 1:2 and above
Accuracy-70%

When an inside bar breakdown is given with RSI below 40, we can see a downside move as shown in the image below by the yellow arrow.
Timeframe- 15 min
Entry: Mother candle low on closing basis
SL: Mother candle high on closing basis
Target: 1:2 and above
Accuracy- 70-75%
Timeframe- 15 min
Entry: Mother candle low on closing basis
SL: Mother candle high on closing basis
Target: 1:2 and above
Accuracy- 70-75%

📍Advice on trading the Inside Bar
• Inside bars can have multiple inside bars within the mother candle, sometimes you’ll see 2, 3,4 inside bars within the same mother candle structure, it simply shows a longer period of consolidation, which often leads to a stronger breakout.
• Inside bars can have multiple inside bars within the mother candle, sometimes you’ll see 2, 3,4 inside bars within the same mother candle structure, it simply shows a longer period of consolidation, which often leads to a stronger breakout.
• Inside bars work best on the higher time frame.
• For swing trading, weekly inside bars work best.
• For breakout, when the mother candle is too big, one can place stop loss on the opening( for green candle) or closing basis (for red candle) of the mother candle.
• For swing trading, weekly inside bars work best.
• For breakout, when the mother candle is too big, one can place stop loss on the opening( for green candle) or closing basis (for red candle) of the mother candle.
• For breakdown, when the mother candle is too big, one can place the stop loss on the opening(for red candle) or closing basis( for green candle) of the mother candle.
• Use half quantity, when inside bar breakout/breakdown is given against the trend.
• Use half quantity, when inside bar breakout/breakdown is given against the trend.
Here is an Inside bar scanner
chartink.com/screener/insid…
chartink.com/screener/insid…
• • •
Missing some Tweet in this thread? You can try to
force a refresh