Moving average is one the simplest indicator which many traders and investor use for technical analysis.
𝗔 𝗧𝗵𝗿𝗲𝗮𝗱 𝗼𝗻 𝗠𝗼𝘃𝗶𝗻𝗴 𝗔𝘃𝗲𝗿𝗮𝗴𝗲 🧵 by @me__kaushik
Retweet ♻ for maximum reach.
𝗔 𝗧𝗵𝗿𝗲𝗮𝗱 𝗼𝗻 𝗠𝗼𝘃𝗶𝗻𝗴 𝗔𝘃𝗲𝗿𝗮𝗴𝗲 🧵 by @me__kaushik
Retweet ♻ for maximum reach.
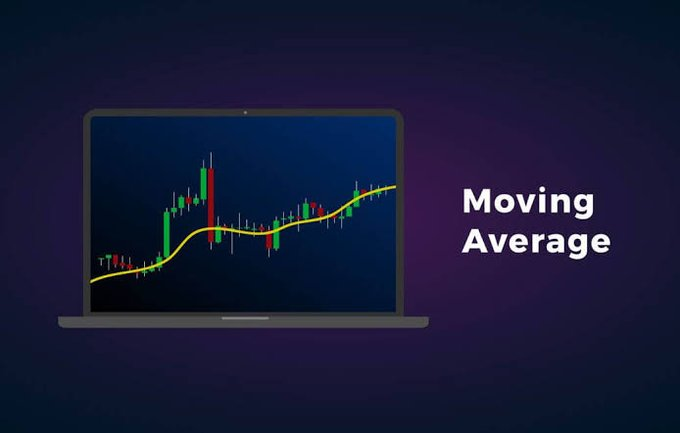
📍What is Moving Average?
A moving average is a technical indicator that investors and traders use to determine the trend direction of a stock or to determine its support and resistance levels.
It is a trend-following or lagging indicator because it is based on past prices.
A moving average is a technical indicator that investors and traders use to determine the trend direction of a stock or to determine its support and resistance levels.
It is a trend-following or lagging indicator because it is based on past prices.
📍Types of Moving Average
👉 Simple Moving Average (SMA): SMA is a technical indicator calculated by adding the most recent data points in a set and dividing the total by the number of time periods.
👉 Simple Moving Average (SMA): SMA is a technical indicator calculated by adding the most recent data points in a set and dividing the total by the number of time periods.
👉 Exponential Moving Average (EMA): EMA gives more weight to recent prices in an attempt to make them more responsive to recent data points.
👉 Weighted Moving Average (WMA): WMA assigns greater weighting to recent data points and less weighting to past data points.
👉 Weighted Moving Average (WMA): WMA assigns greater weighting to recent data points and less weighting to past data points.
📍Application of different Moving Averages
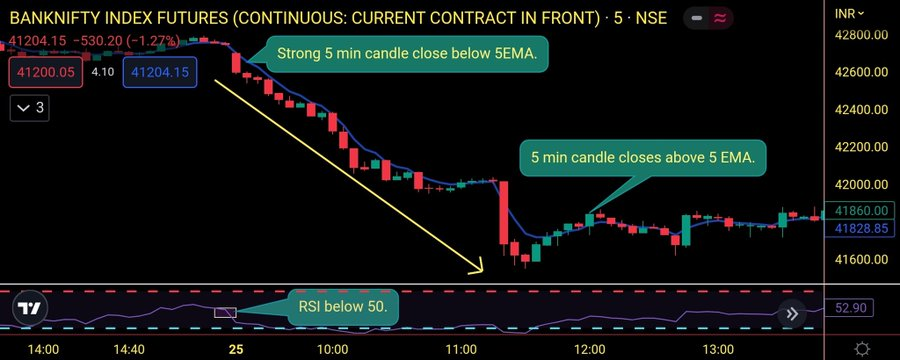
👉 5 EMA: 5 EMA helps to determine the strength of the trend and helps catch big intraday trending moves.
👉 5 EMA: 5 EMA helps to determine the strength of the trend and helps catch big intraday trending moves.
When a 5 min strong candle closes below 5 EMA(blue line) with RSI below 50, we can see a strong downside move as depicted in the below image(yellow arrow).
Exit when a 5 min candle closes above 5EMA as shown in the below image.
For entry, RSI should be below 50 and above 20.
Exit when a 5 min candle closes above 5EMA as shown in the below image.
For entry, RSI should be below 50 and above 20.

When a 5 min strong candle closes above 5 EMA(blue line) with RSI above 50, we can see a strong upside move as depicted in the below image(yellow arrow).
Exit when a 5 min candle closes below 5EMA as shown in the below image.
For entry, RSI should be above 50 and below 80.
Exit when a 5 min candle closes below 5EMA as shown in the below image.
For entry, RSI should be above 50 and below 80.

👉 21 EMA: 21 EMA acts as support and resistance for short term.
In the below image, price bounced from 21 EMA(support) multiple times and kept going upside as marked by the yellow arrow.
However, once price breaks 21 EMA, we can see a downside move as shown in the below image.
In the below image, price bounced from 21 EMA(support) multiple times and kept going upside as marked by the yellow arrow.
However, once price breaks 21 EMA, we can see a downside move as shown in the below image.

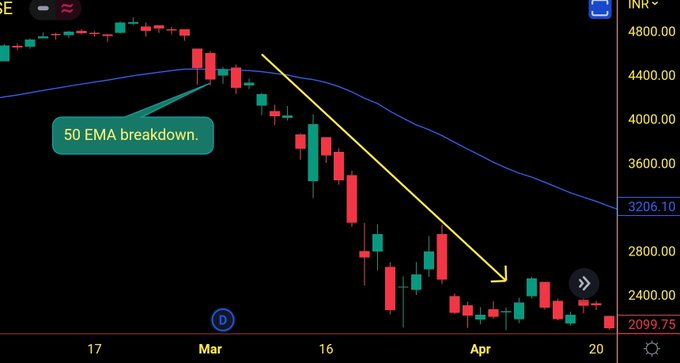
👉 50 EMA: 50 EMA acts as support and resistance for mid-term.
In the below image, price bounced from 50 EMA(support) multiple times and kept going upside as marked by the yellow arrow.
However, once price breaks 50 EMA, we can see a downside move as shown in the below image.
In the below image, price bounced from 50 EMA(support) multiple times and kept going upside as marked by the yellow arrow.
However, once price breaks 50 EMA, we can see a downside move as shown in the below image.

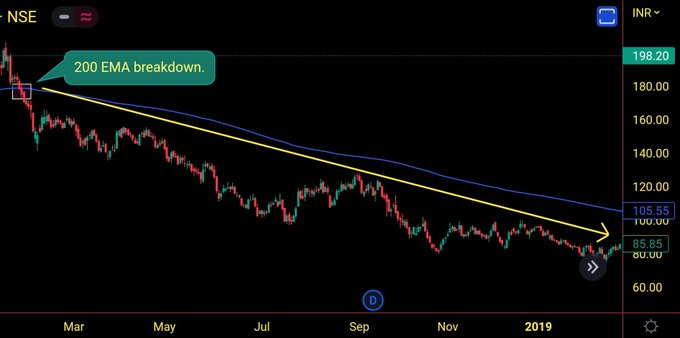
👉 200 EMA: 200 EMA acts as support and resistance for long term.
In the below image, price bounced from 200 EMA(support) multiple times and kept going upside as marked by the yellow arrow
However, once price breaks 200 EMA,we can see a downside move as shown in the below image
In the below image, price bounced from 200 EMA(support) multiple times and kept going upside as marked by the yellow arrow
However, once price breaks 200 EMA,we can see a downside move as shown in the below image

📍Moving Averages Cross-over
👉 Golden Cross-over: The golden cross occurs when a short-term moving average crosses over a long-term moving average to the upside.
Generally, when 50 EMA crosses 200 EMA from below we can say it as golden cross-over.
👉 Golden Cross-over: The golden cross occurs when a short-term moving average crosses over a long-term moving average to the upside.
Generally, when 50 EMA crosses 200 EMA from below we can say it as golden cross-over.
In the below image, we can see 50 EMA(green line) crosses 200 EMA(pink line) from below and the price continues to move upside.
Moreover, as the gap widens between the 50 EMA and 200 EMA, the price shows more intensity.
Moreover, as the gap widens between the 50 EMA and 200 EMA, the price shows more intensity.

👉 Death Cross-over: The death cross occurs when a short-term moving average crosses over a long-term moving average to the downside.
Generally, when 50 EMA crosses 200 EMA from above we can say it as a death cross-over.
Generally, when 50 EMA crosses 200 EMA from above we can say it as a death cross-over.
In the below image, we can see 50 EMA(green line) crosses 200 EMA(pink line) from above and the price continues to move downside.
Moreover, as the gap widens between the 50 EMA and 200 EMA, the price shows more intensity.
Moreover, as the gap widens between the 50 EMA and 200 EMA, the price shows more intensity.

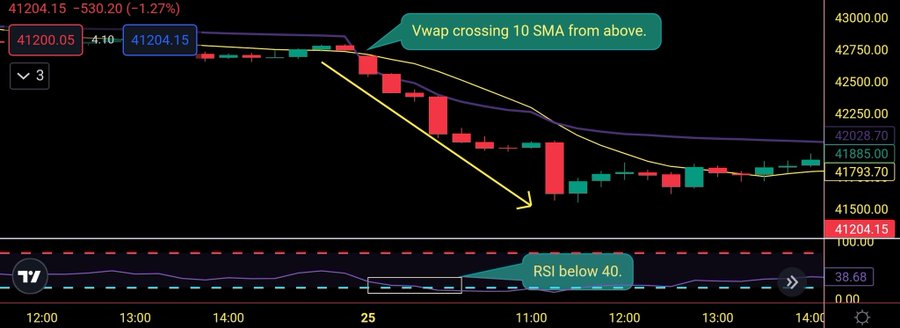
📍Application of 10 SMA and VWAP
When 10 SMA (yellow line) crosses VWAP (purple line) from below with RSI above 60, we can see an uptrend as depicted in the below image by the yellow arrow.
When 10 SMA (yellow line) crosses VWAP (purple line) from below with RSI above 60, we can see an uptrend as depicted in the below image by the yellow arrow.

When 10 SMA(yellow line) crosses VWAP(purple line) from above with RSI below 40, we can see a downtrend as depicted in the below image by the yellow arrow.
#nifty #niftybank #StocksToTrade
#nifty #niftybank #StocksToTrade
📍Cons of Moving Average
👉 Moving averages don’t work well in non-trending or sideways kinds of markets.
👉 Moving average is a lagging indicator. Therefore, don't rely much on moving averages, especially in live trading.
#TradingView
#TechnicalTrades
👉 Moving averages don’t work well in non-trending or sideways kinds of markets.
👉 Moving average is a lagging indicator. Therefore, don't rely much on moving averages, especially in live trading.
#TradingView
#TechnicalTrades
• • •
Missing some Tweet in this thread? You can try to
force a refresh