2022 official statistics update from @OHID
#Dental health of 5 year old children in England
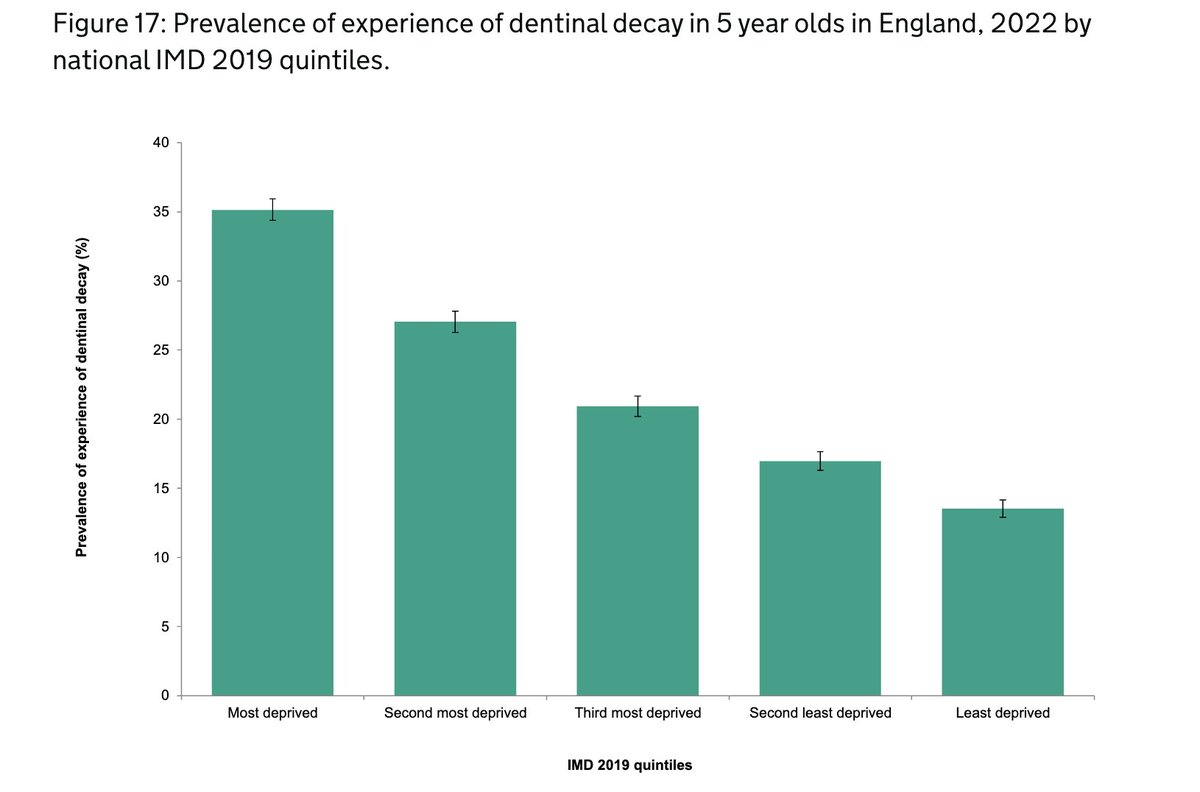
One third of 5 yr olds have tooth decay (29.3%)
Those in the most deprived areas of England are 2.5 times more likely to have decay than in the least deprived (35.1% Vs 13.5%)
🧵/1
#Dental health of 5 year old children in England
One third of 5 yr olds have tooth decay (29.3%)
Those in the most deprived areas of England are 2.5 times more likely to have decay than in the least deprived (35.1% Vs 13.5%)
🧵/1

From 2008 to 2017 there was a clear trend of significant improvement in the prevalence of tooth decay in 5 year olds in England (from 30.9% to 23.3%)
**There have been no further significant improvements in oral health since 2017**
#dentistry #Health #oralhealth
🧵/2
**There have been no further significant improvements in oral health since 2017**
#dentistry #Health #oralhealth
🧵/2

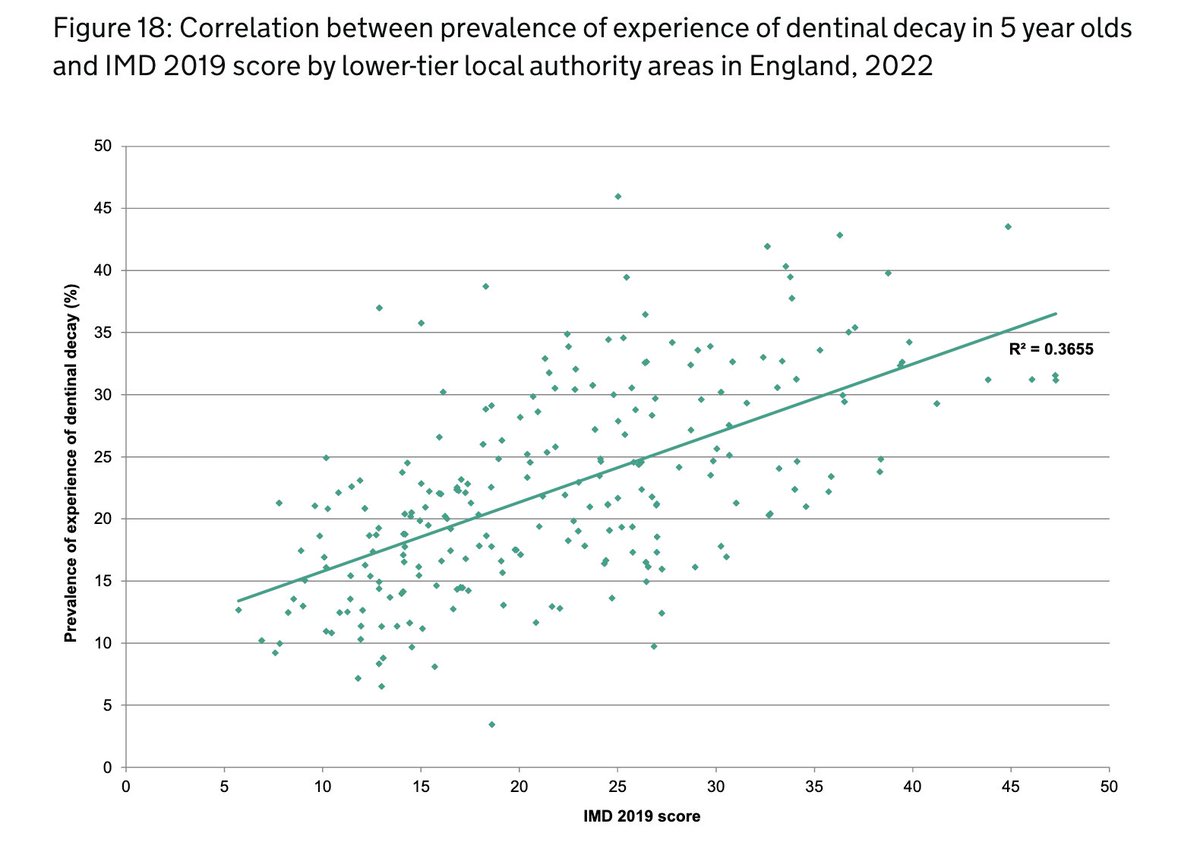
#Oralhealth inequalities have previously been highlighted as a #publichealth problem
There is a positive association between decay experience and deprivation, as deprivation increases so does decay experience
#inequality #dentistry
🧵/3
There is a positive association between decay experience and deprivation, as deprivation increases so does decay experience
#inequality #dentistry
🧵/3
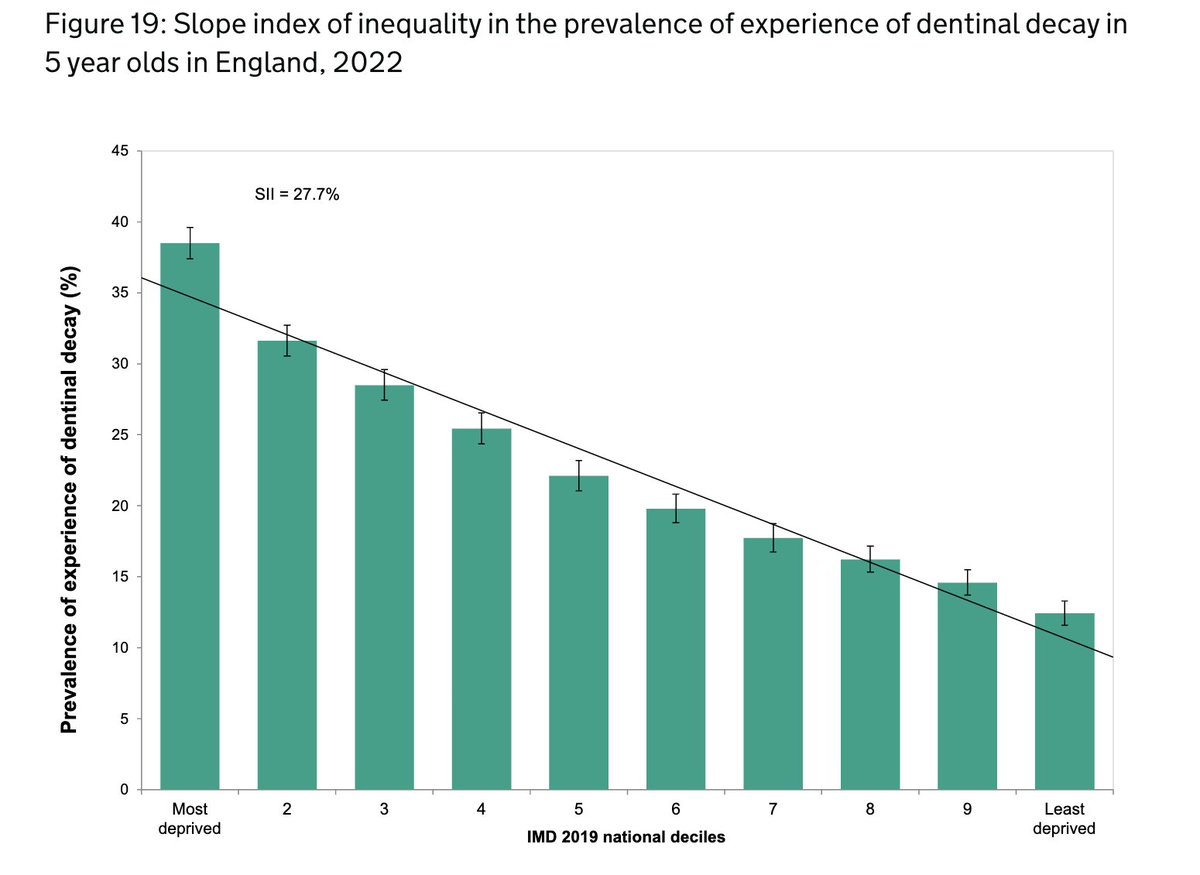
The gradient in the difference of prevalence of a disease across people living in the most & least deprived areas is called the slope index of #inequality
This slope is a measure of absolute inequalities and for tooth decay of 5 year olds in 2022 was 27.7%
#dentistry
🧵/4
This slope is a measure of absolute inequalities and for tooth decay of 5 year olds in 2022 was 27.7%
#dentistry
🧵/4
The slope index of inequality can be used to describe changes in inequalities over time
The absolute inequalities in tooth decay prevalence in 5 year olds reduced from 2008 to 2015 **but** there have been no further reductions in inequalities since then
@bspduk @bascd_uk
🧵/5
The absolute inequalities in tooth decay prevalence in 5 year olds reduced from 2008 to 2015 **but** there have been no further reductions in inequalities since then
@bspduk @bascd_uk
🧵/5

The prevalence of tooth decay in 5 year olds varies by ethnic group being significantly higher in the other ethnic group (44.8%) and the Asian or Asian British ethnic group (37.7%) than for other groups
#dentistry #ethnicity #race #inequality
🧵/6
#dentistry #ethnicity #race #inequality
🧵/6

There are marked regional differences with the North West having the highest prevalence of tooth decay in 5 year old children (38.7%)
#dentistry #Health #inequality #publichealth #NHS #Children #LevelUp
🧵/7
#dentistry #Health #inequality #publichealth #NHS #Children #LevelUp
🧵/7

There is marked variation at upper-tier local authority level with a high children's tooth decay prevalence ranging from 46.0% (Brent) to 9.7% (Brighton and Hove)
At lower-tier local authority level, the highest prevalence is in Leicester
@bascd_uk @bspduk @OHID @TheBDA
🧵/8
At lower-tier local authority level, the highest prevalence is in Leicester
@bascd_uk @bspduk @OHID @TheBDA
🧵/8


The proportion of teeth with tooth decay that had been filled (the Care Index) was 7.4% across England
This varies regionally from 3.8% in the North West to 12.9% in London
*Interesting: Why do 5 year olds have more teeth filled in some regions?
@bspduk #dentistry
🧵/9
This varies regionally from 3.8% in the North West to 12.9% in London
*Interesting: Why do 5 year olds have more teeth filled in some regions?
@bspduk #dentistry
🧵/9

The proportion of teeth that had been extracted due to tooth decay is 6.4%
*Note: the extraction of teeth in young children usually involves admission to hospital & a general anaesthetic
Huge variation in extraction rates from 3.9% (South East) to 13.4% (North East) - WHY?
🧵
*Note: the extraction of teeth in young children usually involves admission to hospital & a general anaesthetic
Huge variation in extraction rates from 3.9% (South East) to 13.4% (North East) - WHY?
🧵

Good #oralhealth is fundamental to ensure general health & wellbeing
Poor oral health in young children can result in pain, infection, difficulties with eating, sleeping, playing & socialising
#Dental decay is also the commonest cause of hospital admission in young children
🧵
Poor oral health in young children can result in pain, infection, difficulties with eating, sleeping, playing & socialising
#Dental decay is also the commonest cause of hospital admission in young children
🧵
There are also significant costs on society associated with oral diseases, not least the costs of hospital admissions for tooth extractions.
These impacts & costs are mostly avoidable as dental decay is a largely preventable disease.
#dentistry #Health @bspduk @OHID
🧵/12
These impacts & costs are mostly avoidable as dental decay is a largely preventable disease.
#dentistry #Health @bspduk @OHID
🧵/12
Information from @OHID surveys is vital to inform #oralhealth needs assessments at a local level
NHS & local authority commissioners should use the information when planning and evaluating local health services and health improvement interventions.
@ADPHUK #dentistry #NHS
🧵
NHS & local authority commissioners should use the information when planning and evaluating local health services and health improvement interventions.
@ADPHUK #dentistry #NHS
🧵
Note:
This is the 6th in the @OHID series of surveys on #Dental health of 5 yr old children in England
It includes estimates from 132 upper-tier & 234 (from 309) lower-tier local authorities
With 62,649 children included in the analysis (9.1% of the popn of this age cohort)
🧵
This is the 6th in the @OHID series of surveys on #Dental health of 5 yr old children in England
It includes estimates from 132 upper-tier & 234 (from 309) lower-tier local authorities
With 62,649 children included in the analysis (9.1% of the popn of this age cohort)
🧵

Methods note: The survey was undertaken during the 2021 to 2022 school year according to a national protocol @bascd_uk
It includes 2 (visually observed) measures of tooth decay:
1. Decay into dentine (dentinal decay)
2. Decay confined to the tooth enamel (enamel decay)
🧵😅
It includes 2 (visually observed) measures of tooth decay:
1. Decay into dentine (dentinal decay)
2. Decay confined to the tooth enamel (enamel decay)
🧵😅
• • •
Missing some Tweet in this thread? You can try to
force a refresh