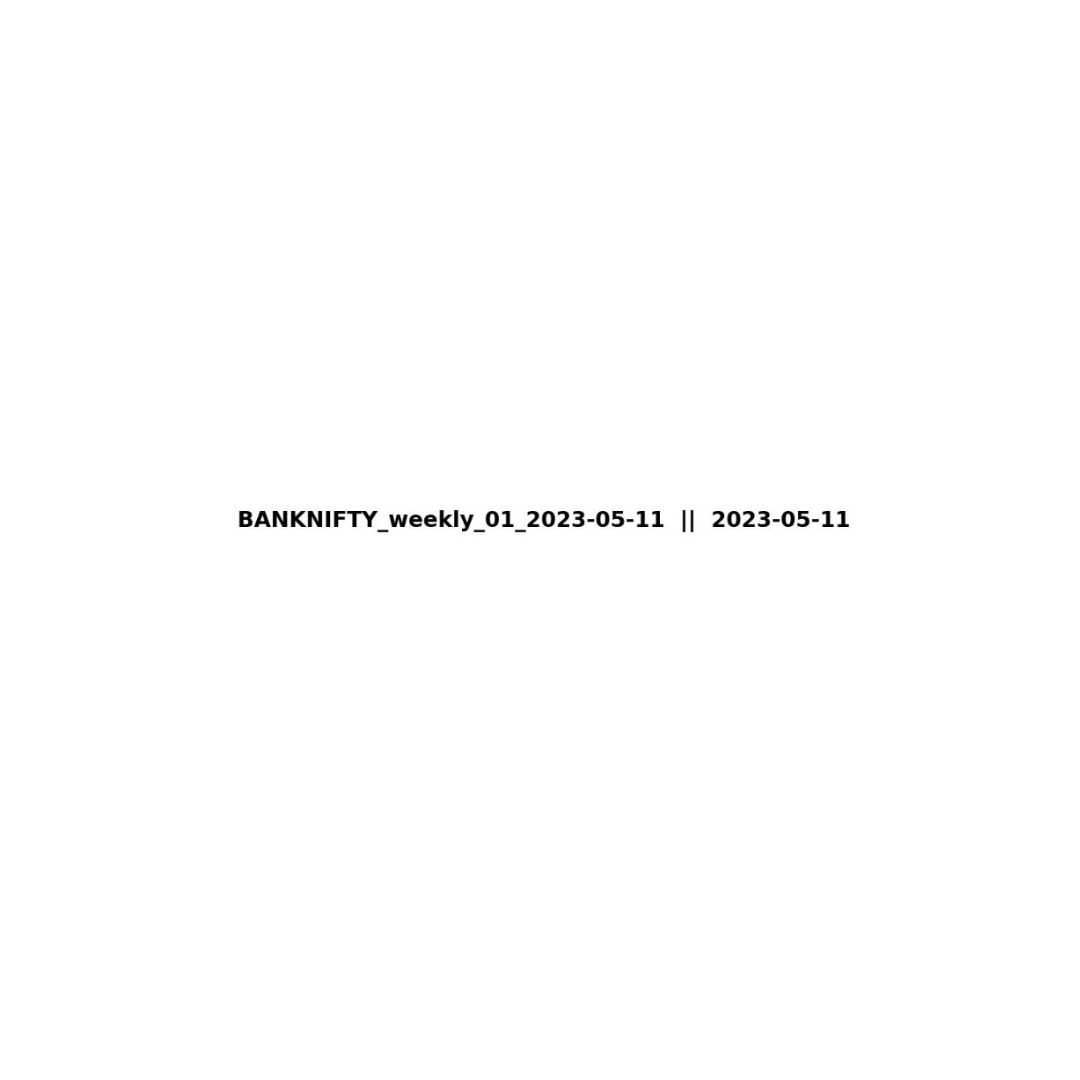
How to decode THE VOLATILITY REPORT ?
#trading #nifty #banknifty #nse #wealth #investing #stockmarkets
#trading #nifty #banknifty #nse #wealth #investing #stockmarkets

SYMBOL+TENOR+SL NO+EXPIRY DATE || TODAY
SYMBOL: Underlying name (e.g., Banknifty, Reliance)
TENOR: Maturity type (Weekly, Monthly, LEAPs)
SL NO: Maturity priority (1st = closest weekly expiry)
EXPIRY DATE: Contract maturity date
TODAY: Recording date
SYMBOL: Underlying name (e.g., Banknifty, Reliance)
TENOR: Maturity type (Weekly, Monthly, LEAPs)
SL NO: Maturity priority (1st = closest weekly expiry)
EXPIRY DATE: Contract maturity date
TODAY: Recording date

Future v/s Straddle chart - The front month future (blue) and the straddle (red). Consider a strike price of call+put having the lowest premium.Roll the strike price dynamically to plot the premium for at-the-money straddle. 

Vega and Theta PnL charts - The theta greek represents the time-value of money and vega represents the PnL multiplier for 1% change in IV. We have converted the net PnL contribution from these two Greeks in rupee terms separately. 

Considering long option contracts,‘Theta PnL’ chart (magenta) explains theta decay PnL in rupee terms and the Vega PnL chart (green) explains the PnL from implied volatility of the option contracts.
This helps you understand the source and magnitude of ATM straddle PnL.
This helps you understand the source and magnitude of ATM straddle PnL.
Future v/s IV charts - The IV chart (black) here represents the implied volatility of the underlying. You can use synthetic future, future, spot market as delta hedging instrument to price the IV of the options contracts. We used front month future. 

Synthetic is the ideal solution when future maturity date =/= option expiry date. This is done to get the correct delta hedge ratio for the options contracts.
The IV contributes greatly to the option PnL when time-to-expiry is > 7 days. As the option comes closer to expiry it loses vega and hence the PnL multiplier effect due to IV also reduces.
Monthly contracts are always preferred by volatility traders. Monthly contracts are rich in vega exposure/multiplier/sensitivity while the theta and gamma exposure remains minimum.
Hence it is easier to delta hedge the option contracts and removes the directional profit/loss component of the underlying from your portfolio, this allows the trader to have a clean bet on only the direction of the implied volatility of the options contracts.
• • •
Missing some Tweet in this thread? You can try to
force a refresh

 Read on Twitter


