Nooresh Merani Profile picture
May 17, 2023 11 tweets 10 min read Read on X
#FlashBack Thread.

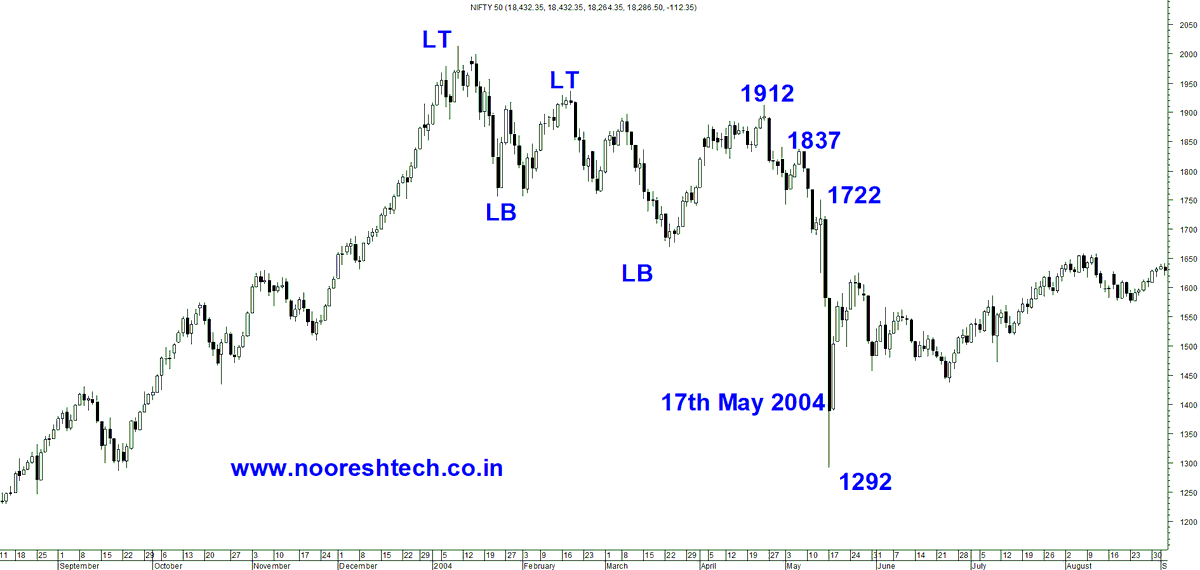
17th May 2004 - #BlackMonday LowerCircuit Day.

Started learning Technicals from @nsfidai just a week or two before this event.

Remember him and his friend discussing how markets are heading lower irrespective of results.

Let's see what happened.
#IndianElections & the Impact.

#Nifty fell almost 20% in a single day. Closed 12-13 % lower.

Down 32% from April to May. Peak to Bottom.

On Close 24% fall.

#BJP lost elections.

Remember the "India is Shining " Campaign.

Learnt Lower Top Lower Bottom Pattern ImageImage
#Global Impact of Indian Elections.

#US Markets fell by 6-7% in April-May 2004.

Was down 1% on 17th May 2004. Image
#Dax fell by 10% in April-May 2004

Down 1% on 17th May 2004 Image
#HangSeng down 17% in April-May 2004.

Down 2.7% on 17th May 2004. Image
#Nikkei Japan fell 14% in April-May 2004

Down 3% on 17th may 2004. Image
#Taiwan down 24% in April-May 2004.
Down 5% on 17th May 2004. Image
#Conclusion -

#IndianElections impact the whole world.

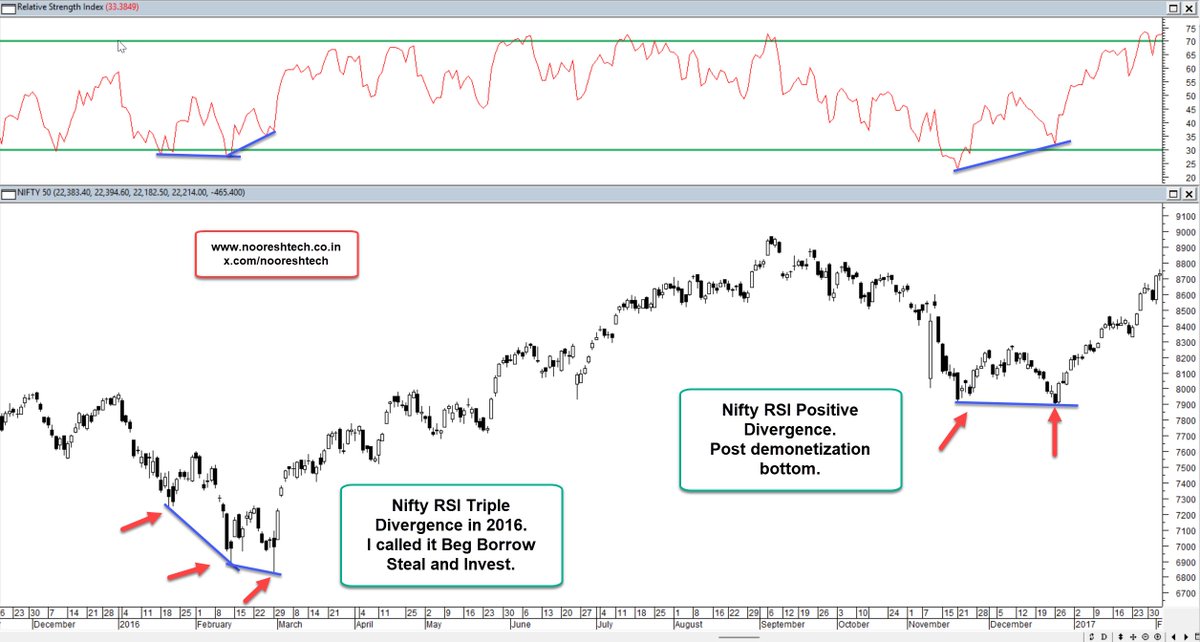
#Demonetization led to a Global Rally in 2017
(Global mkts up 25% in 2017.)

Or accept #GlobalMarkets are interrelated but Magnitudes could be different.
Learning from 2004 was to focus and give more weight to #GlobalTrends during major Local events like #IndianElections #Budget #Demonetization.

This helped us in the 2009/2014/2019 elections and #Budget 2016 and other such events.
2009 - #India was lagging, caught up with #UpperCircuits.

2014- #India caught up too.

#Budget2016 #LTCG rumor. World had already bounced. #Nifty bottomed on budget day.
( Search IIF Meet Video on my youtube )

Levered Long for me in 2014 was a game-changer personally.
Interesting to see we are at 10x of #Nifty since then. Just add a zero to the Chart and suddenly #Volatility #TradinRange seems way lower nowadays :)

The above charts are from a Report done in #MarchApril of 2014.

Search #IndianElections on our Blog to read the older Note Image

• • •

Missing some Tweet in this thread? You can try to force a refresh
 

Keep Current with Nooresh Merani

Nooresh Merani Profile picture

Stay in touch and get notified when new unrolls are available from this author!

Read all threads

This Thread may be Removed Anytime!

PDF

Twitter may remove this content at anytime! Save it as PDF for later use!

Try unrolling a thread yourself!

how to unroll video
  1. Follow @ThreadReaderApp to mention us!

  2. From a Twitter thread mention us with a keyword "unroll"
@threadreaderapp unroll

Practice here first or read more on our help page!

More from @nooreshtech

Mar 2
#LTCG - #LTCG - Not Much Revenue Gain for Lower Foreign Capital and Market Cap.

A Thread

India is the only country that taxes Foreign Capital
Foreigners own 25.6%
( FPIs= 17.4% & Foreign promoters= 8.2% )

Also when Indian Domestic Money has just started coming in Equity
2) Revenues for Government

This article suggests Long Term Capital Gains collection from Direct Equities was nearly 1 lakh crore.

But there is no Data for only Securities LTCG but this data matches for total LTCG.

Let's see the data.Image
3) Income Tax Data Clubs Equity + Real Estate etc

LTCG announced in Jan 2018.
So that implies AY 2017-2018 or before had no tax on long-term in Equity/MF.

There is still data for LTCG
Implies it's for Real Estate and other AssetsImage
Read 12 tweets
Feb 21
Insider buying / Promoter buying –
What to Look For & What to Avoid ?

A thread 🧵

In simple terms – Insider is someone who knows about the company more than we do – Promoters, Directors and any other connected person with UPSI
Why do we look at Insider Buying ?

👉No risk of Hostile Takeover, Activist Investing in India. More examples of promoters having board control with 5% ownership also.

👉Selling is taken more Negatively ( Much tougher to sell in bear market). So one way entry.

👉So why would a Promoter put more Money & increase Stake. Promoter Cash Flow is too less compared to Market Cap !!
Few Good Reasons that make sense for Promoters

👉Undervalued as Stock has fallen a Lot. ( 400-500 companies saw Insider buying March-May 2020)

👉 Future Potential

👉 Giving exit to Family/Funds/Private Equity etc. (Non operative brother selling)
Read 9 tweets
Feb 9
Multi-Year Range Breakouts in Nifty50 Stocks but Nifty50 Making Lower Tops –What to Do ?

Apart from that

1) Global Indices – US and Europe near all time highs but India continues to struggle and making lower tops.
2) Stocks in Same Sector – One at all time high the other one at 30% drawdown.

3) What to trust the Breakout Moves or Breakdown Moves ?

This creates a dilemma for a Trader – To trust the Breakout/Breakdown or Not ?
Now lets c the Charts

The Struggling Nifty50

Positive divergences on new lows.
Still in lower tops.
Last major swing highs at 24200.
Swing lows at 22800.
Every big positive candle does not see any follow up action over next 1-3 sessions. Wait for this to change.Image
Read 14 tweets
Feb 4
Midcap Over-Ownership & Over-Valuation !!

#Retail Inflows continue to be strong but Sebi categorization of Stocks > 33k cr Mkt cap being considered Midcap has led to over-ownership and overvaluation in the Top Midcap & Smallcap ( > 20k cr )

Data from Monarch AIF Note.
1) Price CAGR >> Earnings CAGR

Nifty50 and Nifty500 have moved inline with earnings cagr.

NiftyMidcap 100 has seen max re-rating. A price cagr of 27.3% against 11.7% earnings. Image
2) Concentrated Flows

Mid + Small + Thematic = 55-60% share of MF pure equity net inflows in CY23 and CY24 Image
Read 10 tweets
Nov 13, 2024
Nifty & RSI Positive Divergence

Nifty – Oversold and Triple Divergence

Like I have said in my earlier posts that RSI is a good indicator for bottoming out analysis on Nifty50.

Now is the time with RSI being oversold it gets into practice for us.

Oversold and a possible Triple Divergence in making.

In majority of the instances a RSI divergence has led to a Strong Bounce.

A cluster of supports closer to 23300-23600.

Recent lows can be broken tomorrow and ideally one would expect a good bounce from the support band.

The trade is to look for longs in the band of 23300-23600 or as close to it or stock specific.

A bottoming out can take a few sessions as per previous instances. A stoploss of 2% from entry closer to 23000.

A bounce to the tune of 30-50% of the downmove is the initial target. That would come to 24500-25000.Image
The past instances

The 2021-2023 – RSI divergence bounces

Nifty from top to bottom corrected 18% but there were multiple bounces and sideways range.

In the same period many stocks/sectors did really well.

For example the June 2022 bounce was led by Banks.Image
The RSI Divergences in 2015-2016

Although the trend was down there were many bounces.

Textiles/Chemicals and many sectors continued to do well.Image
Read 4 tweets
Sep 28, 2024
Nifty50 RSI at 80. Sell Everything and Run Away

Did you all get this Forward/Post of how #Nifty of how 80 RSI was followed by a Correction !!

A Thread.
Image
Image
A) March 1992.

Nifty50 index started in 1996 with a 1-2 year backdated data. NSE started operations in 1994.

So I have no clue where the 1992 data came from. Sensex monthly RSI was 92 in 1992 in 1985. So that also does not match
B) Dec 2003.

My data shows 78.5. But fits the Curve and Narrative.

The next 4 months are sideways. May 2004 elections led to the 30% correction.

So now we start with the actual 80 + RSI instances.
Read 11 tweets

Did Thread Reader help you today?

Support us! We are indie developers!


This site is made by just two indie developers on a laptop doing marketing, support and development! Read more about the story.

Become a Premium Member ($3/month or $30/year) and get exclusive features!

Become Premium

Don't want to be a Premium member but still want to support us?

Make a small donation by buying us coffee ($5) or help with server cost ($10)

Donate via Paypal

Or Donate anonymously using crypto!

Ethereum

0xfe58350B80634f60Fa6Dc149a72b4DFbc17D341E copy

Bitcoin

3ATGMxNzCUFzxpMCHL5sWSt4DVtS8UqXpi copy

Thank you for your support!

Follow Us!

:(