@andrew_lilico Okay @andrew_lilico, you need to download the tables from the Ipsos Mori survey you cited in reply to @Sime0nStylites. You need Table 43 and Table 46 from here: ipsos.com/sites/default/…
#CPC18
1/X
#CPC18
1/X
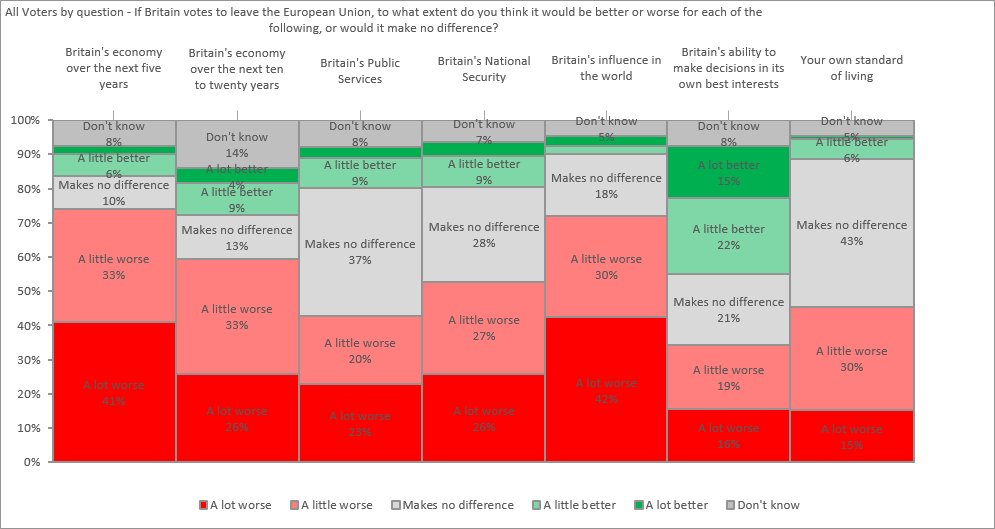
@andrew_lilico @Sime0nStylites Let's look at the detail with some carpet charts. All are prefaced with "If Britain votes to leave the European Union, to what extent do you think it would be better or worse for each of the following, or would it make no difference?"
2/X
2/X
@andrew_lilico @Sime0nStylites We're testing if voters voted for Brexit, despite expecting to be worse off after 5 years and about even after 20 years. So we're looking at the Leave breakdown.
3/X
3/X
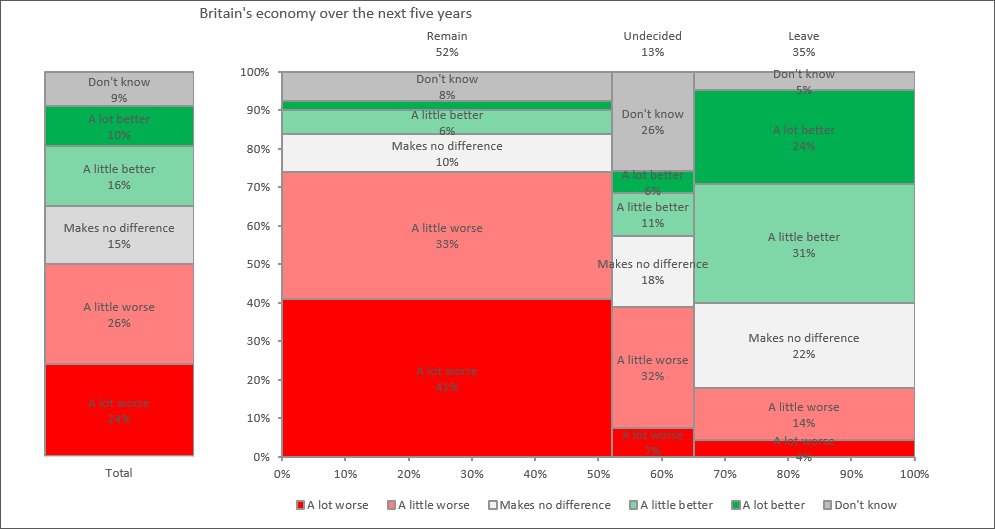
@andrew_lilico @Sime0nStylites First off we have table 43 - Britain's economy over the next five years.
You can see 49.9% of the total voters thought it would be worse after Brexit, but 55.3% of leave voters thought it would be better.
4/X
You can see 49.9% of the total voters thought it would be worse after Brexit, but 55.3% of leave voters thought it would be better.
4/X
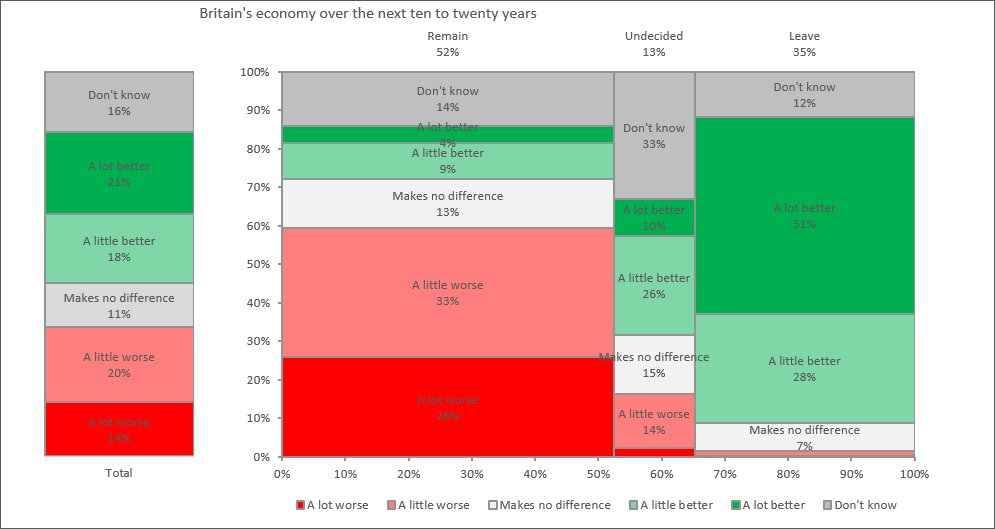
@andrew_lilico @Sime0nStylites Table 46 - Britain's economy over the next ten to twenty years.
You can see 39.3% of the total voters thought it would be better after Brexit, but this rises to 79.5% of leave voters.
5/X
You can see 39.3% of the total voters thought it would be better after Brexit, but this rises to 79.5% of leave voters.
5/X
@andrew_lilico @Sime0nStylites So from these two we can see you were mistaken. People voted for Brexit expecting Britain to be better off in the next years, and significantly better off in the next 10-20 years.
Let's look at the other tables though so we can see what people's expectations were.
6/X
Let's look at the other tables though so we can see what people's expectations were.
6/X
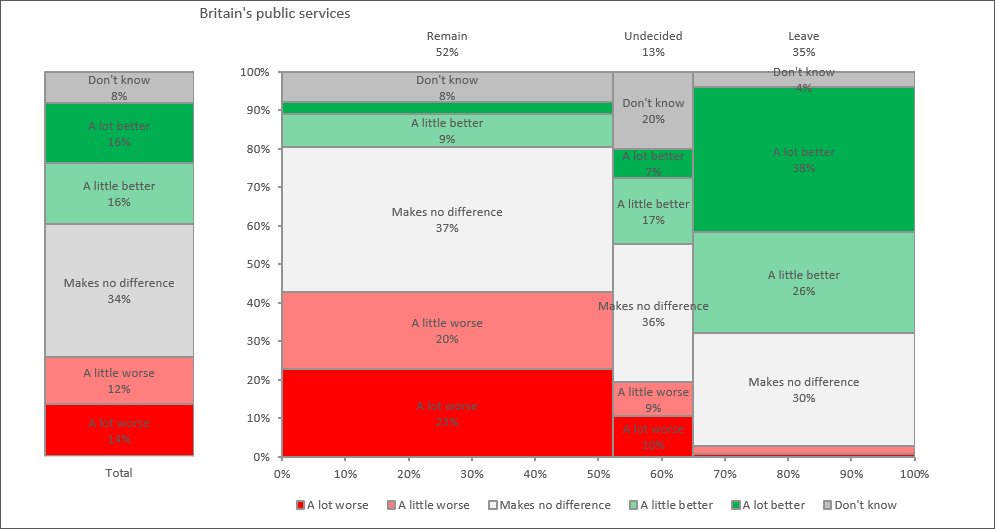
@andrew_lilico @Sime0nStylites Table 49 - Britain's Public Services
34.4% of total voters thought it would make no difference, but 63.7% of Leave voters thought Brexit would make it better.
7/X
34.4% of total voters thought it would make no difference, but 63.7% of Leave voters thought Brexit would make it better.
7/X
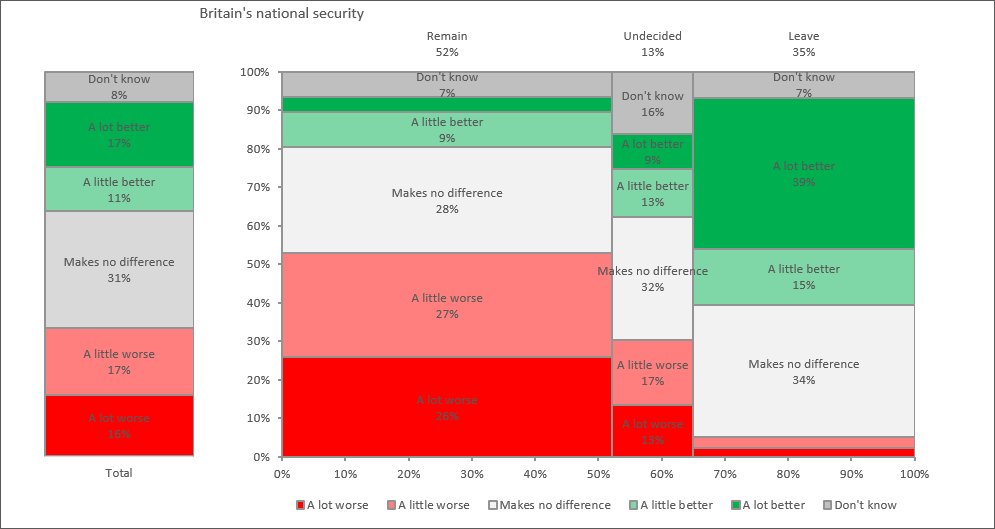
@andrew_lilico @Sime0nStylites Table 52 - Britain's National Security
33.3% of total voters thought this would be worse after Brexit, but 53.8% of leave voters thought it would be better.
8/X
33.3% of total voters thought this would be worse after Brexit, but 53.8% of leave voters thought it would be better.
8/X
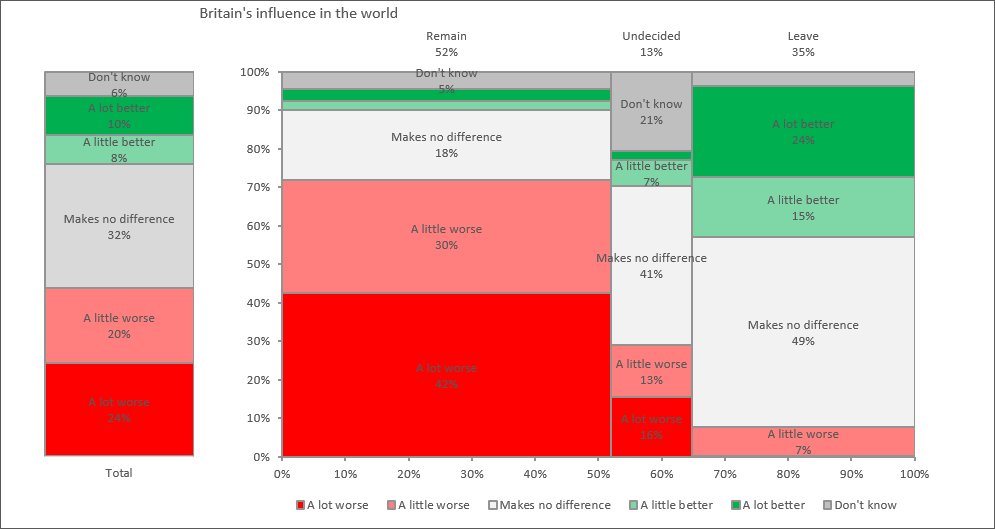
@andrew_lilico @Sime0nStylites Table 55 - Britain's influence in the world
43.8% of total voters thought this would be worse after Brexit, but 49.5% of Leave voters thought it would make no difference (39.1% thought it would be better).
9/X
43.8% of total voters thought this would be worse after Brexit, but 49.5% of Leave voters thought it would make no difference (39.1% thought it would be better).
9/X
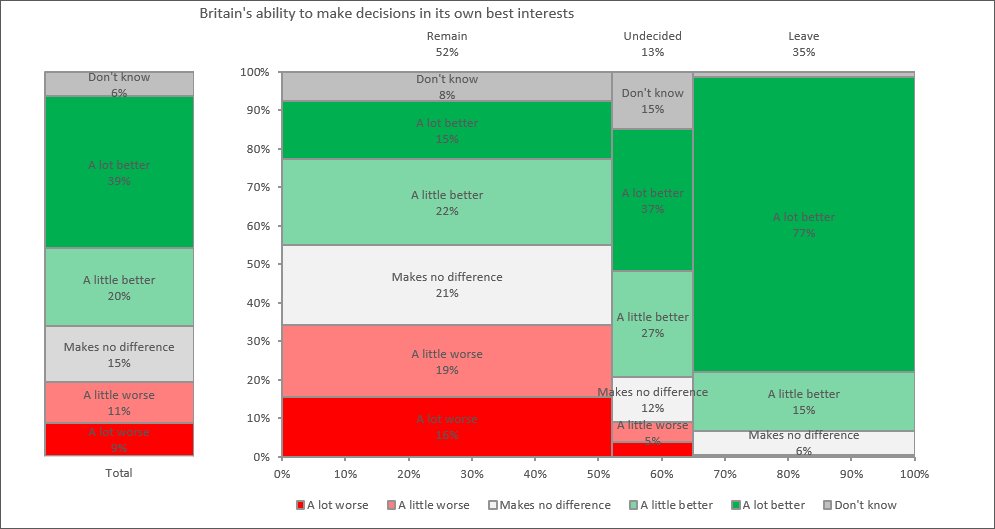
@andrew_lilico @Sime0nStylites Table 58 - Britain's ability to make decisions in its own best interests
49.8% of total voters thought this would be better after Brexit, rising to 91.9% of Leave voters.
10/X
49.8% of total voters thought this would be better after Brexit, rising to 91.9% of Leave voters.
10/X
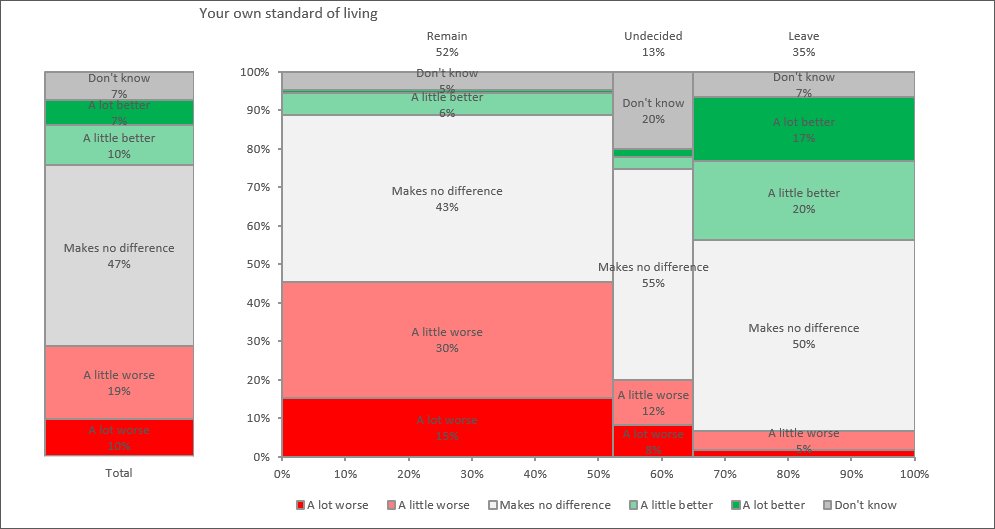
@andrew_lilico @Sime0nStylites Table 61 - Your own standard of living.
This is interesting, it's the voter's standard of living, rather than the economy. 47% of all voters thought it'd make no difference, 49.6% of Leave thought it would make no difference, but 37.1% thought it'd be better after Brexit.
11/X
This is interesting, it's the voter's standard of living, rather than the economy. 47% of all voters thought it'd make no difference, 49.6% of Leave thought it would make no difference, but 37.1% thought it'd be better after Brexit.
11/X
@andrew_lilico @Sime0nStylites Let's look at what each group of voters expected combined. Here's the total voter base.
12/X
12/X
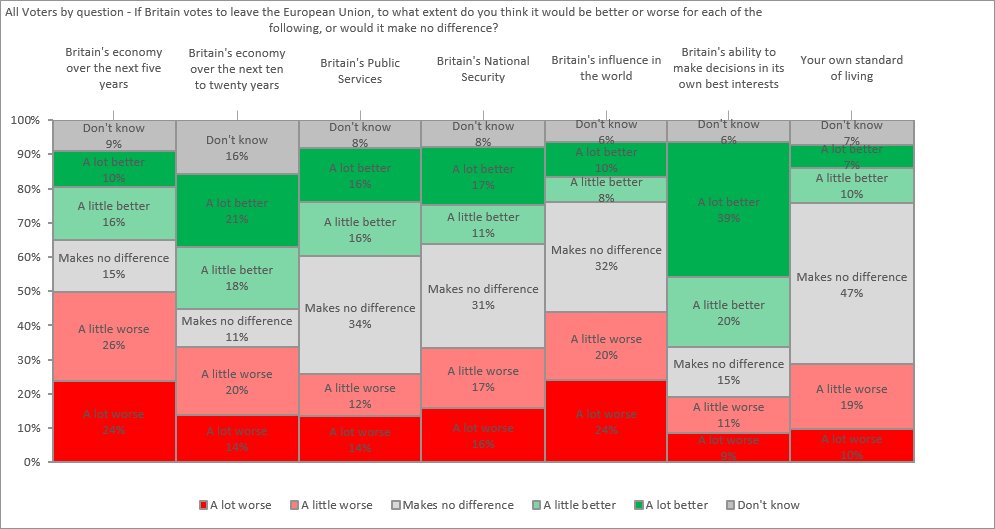
@andrew_lilico @Sime0nStylites We can see the big expectation on the economy being worse in the next 5 years, along with Britain losing influence in the world, but being able to make decisions in its own best best interests. No worse than now expected in all other areas though.
13/X
13/X
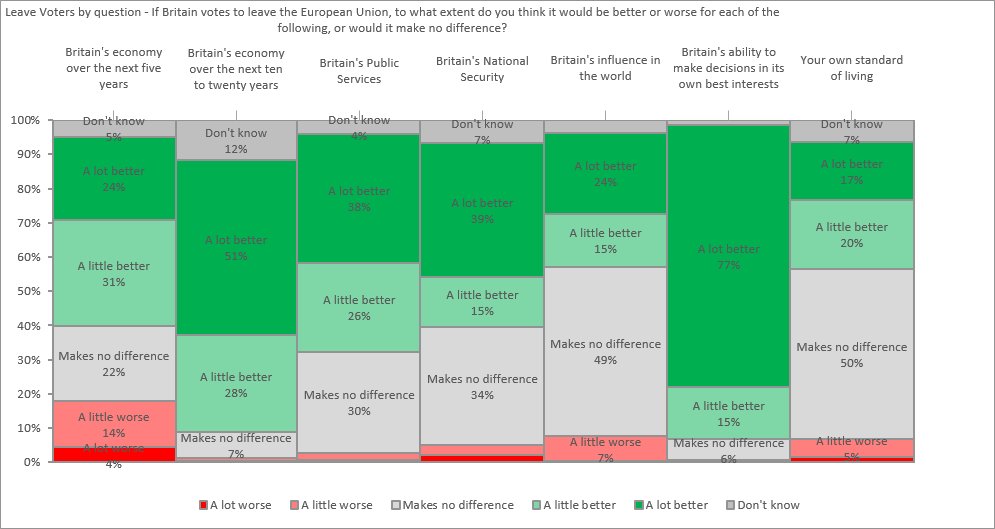
@andrew_lilico @Sime0nStylites Leave voters alone though is a different story. Leave voters expected NOTHING to be worse, with only 18% thinking the economy would be worse in the next 5 years. Everything else has near 90% being sure that it would be better or would make no difference.
14/X
14/X
@andrew_lilico @Sime0nStylites Remain voters alone isn't the opposite though. Most things are expected to be worse, with the big stand outs being the economy and our influence around the world.
15/X
15/X
@andrew_lilico @Sime0nStylites Most of the subjects have at least 10% who think it could be better after Brexit though - up to 37% who think would be better able to make decisions in its own interests (short term economy, influence and standard of living are the sub-10%).
16/X
16/X
@andrew_lilico @Sime0nStylites More thought status quo+ (better and makes no difference) than worse for Public Services and their standard of living too.
17/X
17/X
@andrew_lilico @Sime0nStylites So to summarise a long threaded reply, overall Leave voters did not expect ANY negative outcomes from Brexit. They had relentlessly positive expectations.
18/X
18/X
@andrew_lilico @Sime0nStylites Whether they would accept negatives is another question, but the survey data you've cited shows they definitely did not vote for for Brexit in spite of anticipated negatives.
19/ENDS
19/ENDS