,
93 tweets,
27 min read
Read on Twitter
Let's try something new: *7 days, 7 statistical misconceptions*.
Over the next 7 days I'll post about 1 statistical misconception a day. Curious to hear your favorite #statsmisconceptions, so feel free to add you own to this thread
Over the next 7 days I'll post about 1 statistical misconception a day. Curious to hear your favorite #statsmisconceptions, so feel free to add you own to this thread
Day 1: "Sample size has nothing to do with bias"
👆 is something I still hear regularly. This misconception seems to be based on the oversimplified idea that sample size only affects precision - something I was told repeatedly in the first years of my studies
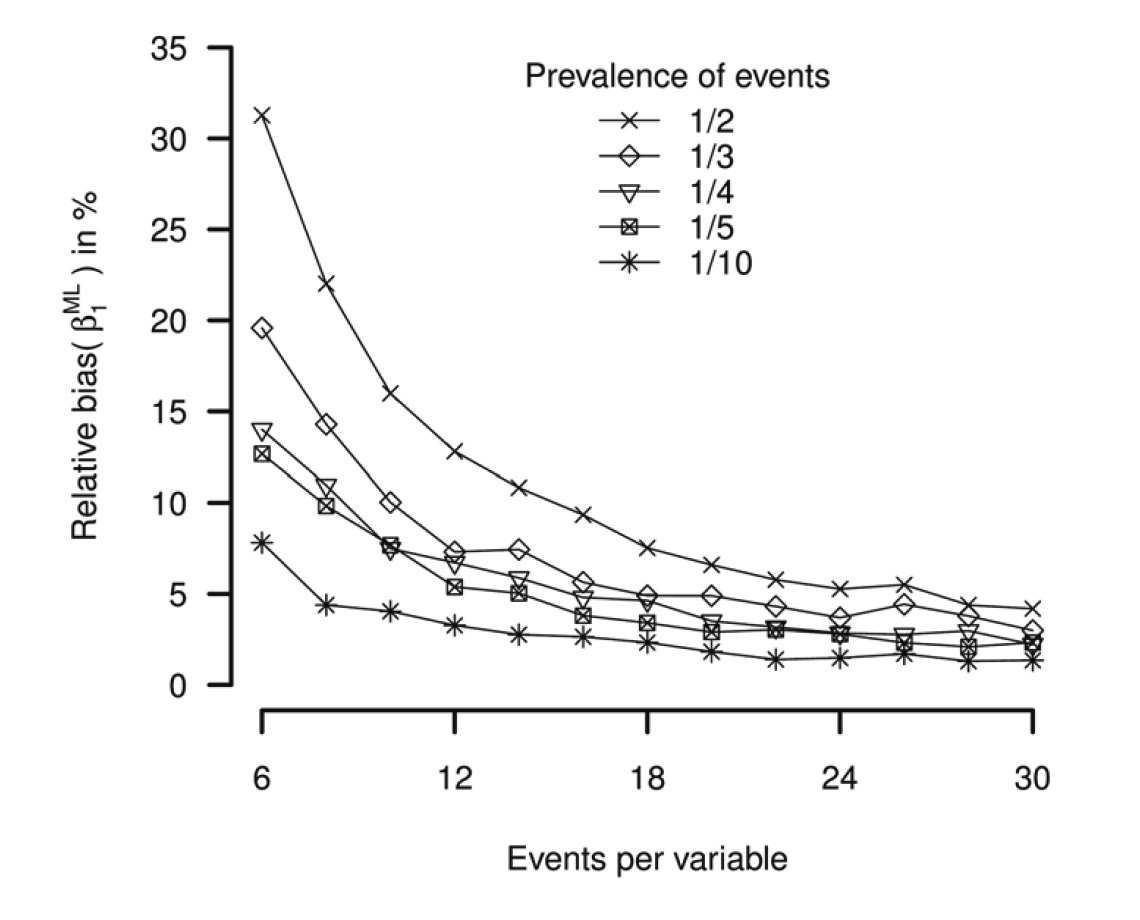
One of my favorite examples showing that sample size and bias *can* be related is the bias in ratio measures such as odds ratios or hazard ratios. This so-called small sample bias (i.e. sparse data bias) phenomenon is nicely explained here: bmj.com/content/352/bm…
Small sample bias can actually be substantial in very small data sets or in data sets with a large number of covariates (figure from bmcmedresmethodol.biomedcentral.com/articles/10.11…, % relative bias log(OR) for a logistic regression) 
Another example is "testimation bias" (book @ESteyerberg springer.com/us/book/978038…): "Overestimation of effects of predictors because of selection of effects that withstood a statistical test". Similar to the small sample bias, this type of bias decreases when sample size increases
To summarize #statsmisconception #1: the saying that sample size only affects precision is an oversimplification: sample size *can* also affect bias
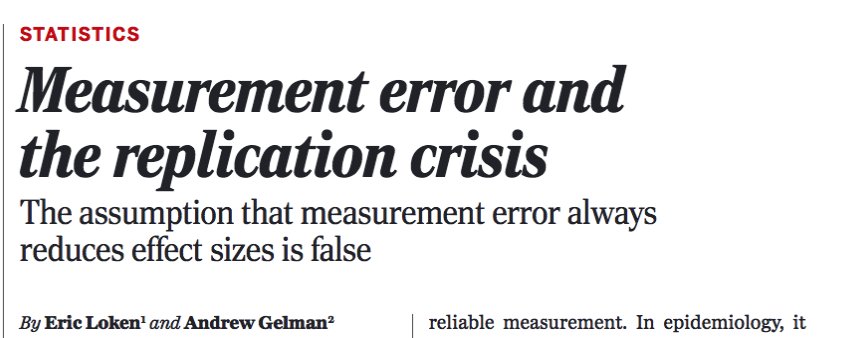
Day 2: “Due to the measurement error in our data, our estimated effect should be considered a conservative estimate”
Another term for this phenomenon is “attenuation” or “regression dilution bias” bmj.com/content/340/bm…
Anticipating attenuation of an effect estimate due to measurement error (= in continuous variables) or misclassification (= in categorical variables) isn’t wrong per se, but it is not nearly as generally applicable as most of us like to think
(I use the term “effect” very generally here as the parameter of primary interest in a scientific study. It may, for instance, represent an estimated difference in means or - more generally - a regression coefficient)
Starting point: the signal-to-noise analogy for analysis of data with measurement error. By this analogy, effects that “survive” noise must be strong effects that tend to be underestimated because of the noise. This analogy doesn’t have much truth to it: science.sciencemag.org/content/355/63…
So what actually happens to an effect estimate? It depends on
- structure of error (is it random error?)
- statistical model (linear regression isn’t logistic regression so to speak)
- role of the variable with error (is it the outcome?)
- other variables in the model
- structure of error (is it random error?)
- statistical model (linear regression isn’t logistic regression so to speak)
- role of the variable with error (is it the outcome?)
- other variables in the model
It turns out to be difficult to predict even the direction of measurement error induced bias. For a simple illustration of this, see: journals.plos.org/plosone/articl…
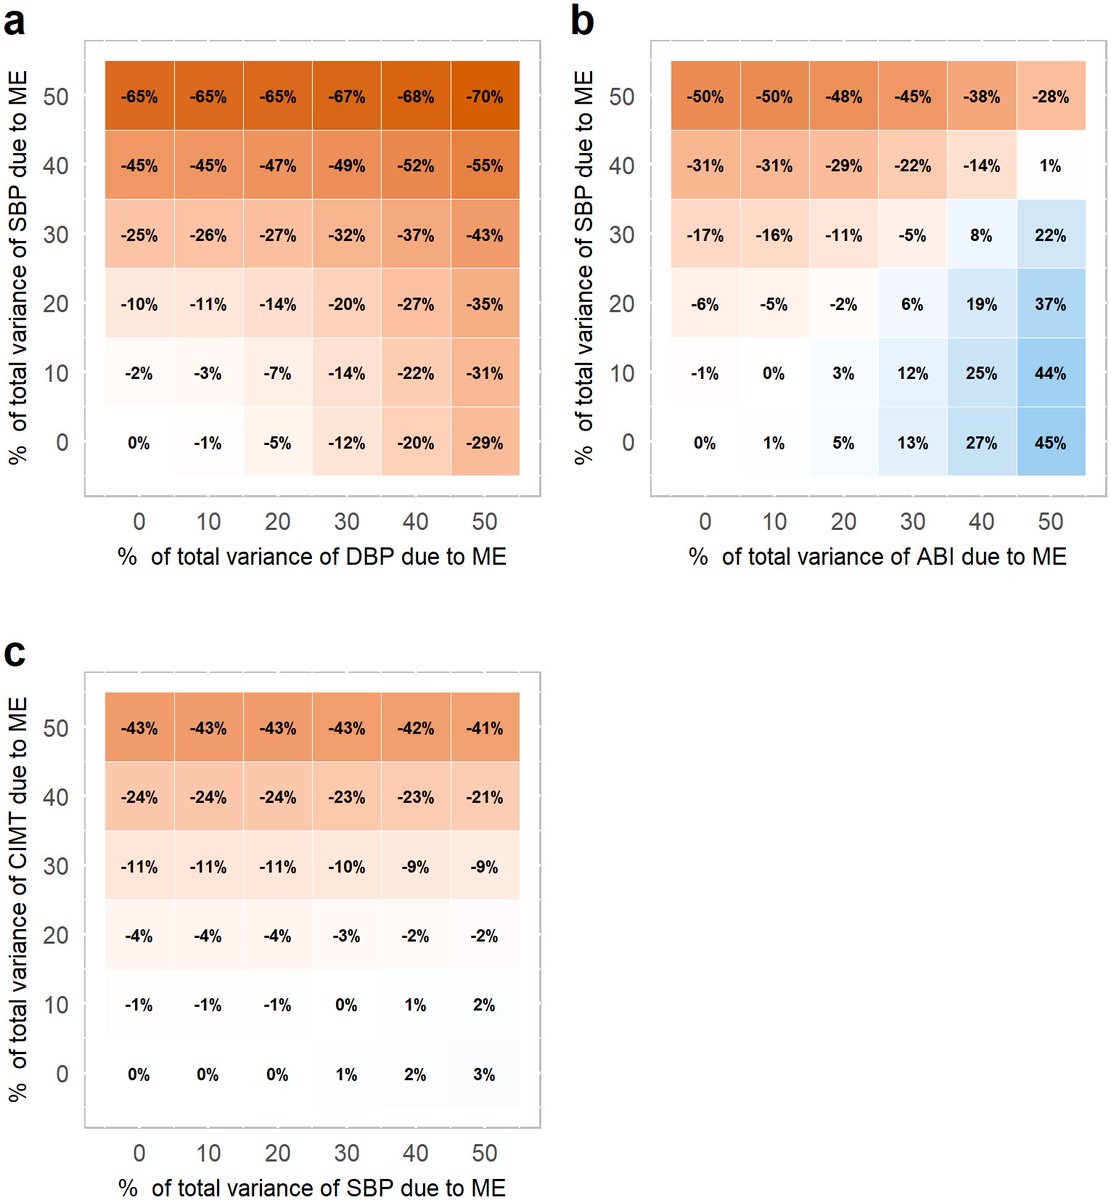
For an even more sobering example, see: academic.oup.com/aje/article-ab…. (spoiler: effect estimate can go up or down and even change direction, even though the correlation between the "truth" and the error variable was >0.95)
Are there exceptions? Yes there are, but few. Even in randomized controlled trials measurement error in the outcome doesn’t always cancel out (pre-print): arxiv.org/abs/1809.07068
To finalize this #statsmisconceptions with a positive note: many books and papers have been written about methods that aim to correct for measurement error. A personal favorite paper was written by @RuthHKeogh: onlinelibrary.wiley.com/doi/full/10.10…
To summarize #statsmisconception #2: the saying that analysis of data containing measurement error produces conservative estimates is an oversimplification: magnitude and direction of impact is generally a guessing game unless appropriate analysis steps (corrections) are taken
This is an important contribution to the discussion about #statsmisconception #2:
Day 3: The normality assumption and the response variable
I’ve seen many examples in the medical literature where a linear regression analysis or an analysis of (co-)variance is preceded by a reported test of normality of the response variable (i.e. outcome/dependent variable)
What often follows is a statistical procedure to try to force the response variable into a bell shape or a flee to non-parametric testing if the response isn’t bell shaped enough. Do you realize non-parametric isn’t the same as assumption free?
BUT. There is hardly ever a statistical reason to check or test whether the distribution of a response variable is bell shaped, with very few exceptions that I’ll discuss at the end
(A few of you already mentioned misconceptions about response variable distributions in this thread, I’m looking at you @CaAl, @DanielOberski and @statsepi, @robertstats supporting my assessment that it is a common thing to do)
The #1 problem with a test for normality of the response variable is: there are no assumptions made about the shape of the distribution of the response! If there is an assumption about normality, it’s about the distribution (and independence) of errors
It’s the *residuals*, stupid!
We often check the residuals visually via QQ-plots or histograms. Forgot about residuals and QQ, here is a refresher: discoveringstatistics.com/repository/exp… (by @ProfAndyField)
Does it matter whether you check the residuals or the response variable? Yes, it can matter. It is very well possible that the response variable clearly isn’t bell shaped, but the residuals are. For an illustration see here: psychometroscar.com/2018/07/11/nor… (by @oscar_olvera100)
The second problem is with the testing. A non-significant result on a normality significance test – such as the Kolmogorov-Smirnov test – is often mistaken for evidence of absence of violation of normality instead of absence of evidence for violation of normality
(This seems to be the perfect opportunity to point again to one of my favorite educational papers about absence of evidence versus evidence of absence by the late Doug Altman: bmj.com/content/311/70…)
A more practical problem with the normality tests is that they will likely fail you in small datasets due to a lack of power. It is in small datasets that the distributional assumptions about errors matter most - if at all
So how important it is that the errors are normally distributed? It depends on the goal of the analysis, the size of the data, and the statistical model. This thread is too short for more nuance, but welcoming any of you to give it a go
Finally, the exception. Multivariate normality of responses (at a population level) is sometimes required in a Structural Equation Model. There must be other settings too, but they seem to be very rare
To summarize #statsmisconception #3: a response variable doesn’t need to have a bell shape (“normal distribution”) for almost any statistical analysis imaginable. If there is an assumption about normality it’s usually about the errors. Check your residuals.
Final thought about #statsmisconception #3: as @DanielOberski has rightfully pointed out: even the mentioned exception (SEM) often doesn't need to require normality of responses
Day 4: interpretation of the p-value as the probability that the tested hypothesis is true
Clearly, p-values are among the most commonly used tools today for making inference about the world from the data we collect. Meanwhile their misinterpretation is very common as many statisticians before me have pointed out for many, many years
So what is the misinterpretation of p-values? It seems that there are many. This is a great list of 24 p-value misconceptions: link.springer.com/article/10.100…
This another good source with 12 p-value misconceptions: sciencedirect.com/science/articl…
(by @goodmanmetrics)
(by @goodmanmetrics)
And another good read with 5 p-value misconceptions:
daniellakens.blogspot.com/2017/12/unders… (by @lakens)
daniellakens.blogspot.com/2017/12/unders… (by @lakens)
Today I’ll focus on just 1 of the misconceptions: the interpretation of a p-value as the probability that the tested hypothesis is true (this particular misconception was mentioned in this thread already by @ADAlthousePhD, @danleisman and @mohsinali90)
For simplicity, I’ll assume that the hypothesis tested is a null hypotheses. Something like: the average blood pressure is the same after treating patients with drug A or B
In a world where the rules of mathematics don't apply we would perhaps directly calculate the *probability that the null hypothesis is true* after collecting and analyzing data from some kind of experiment where A and B were randomly allocated (to make it easy for ourselves)
The p-value is too often mistaken for this 👆 probability. But the p-value – loosely defined - provides a probability for the *extremeness of the data* while assuming the null hypothesis is true
It is data given hypothesis instead of hypothesis given data. Does it matter? Replace “hypothesis” by “shot by gun” and “data” by “death”. See? Many more analogies here:
In summary, #statsmisconception #4: the p-value isn’t the probability that the tested (null) hypothesis is true. The p-value is a statement about data in relation to a hypothesis, not a statement about the hypothesis itself
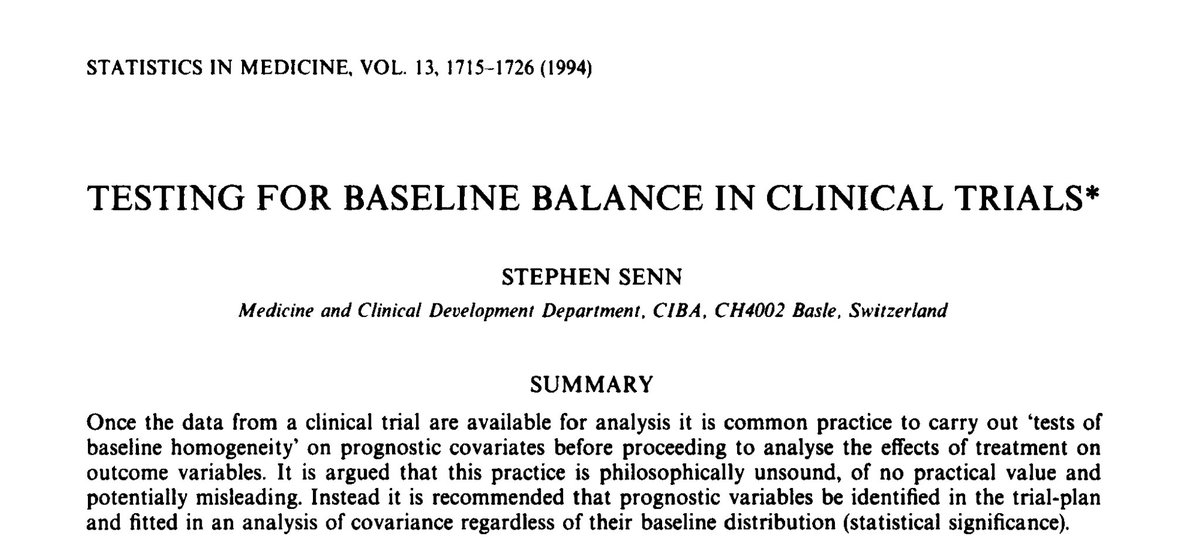
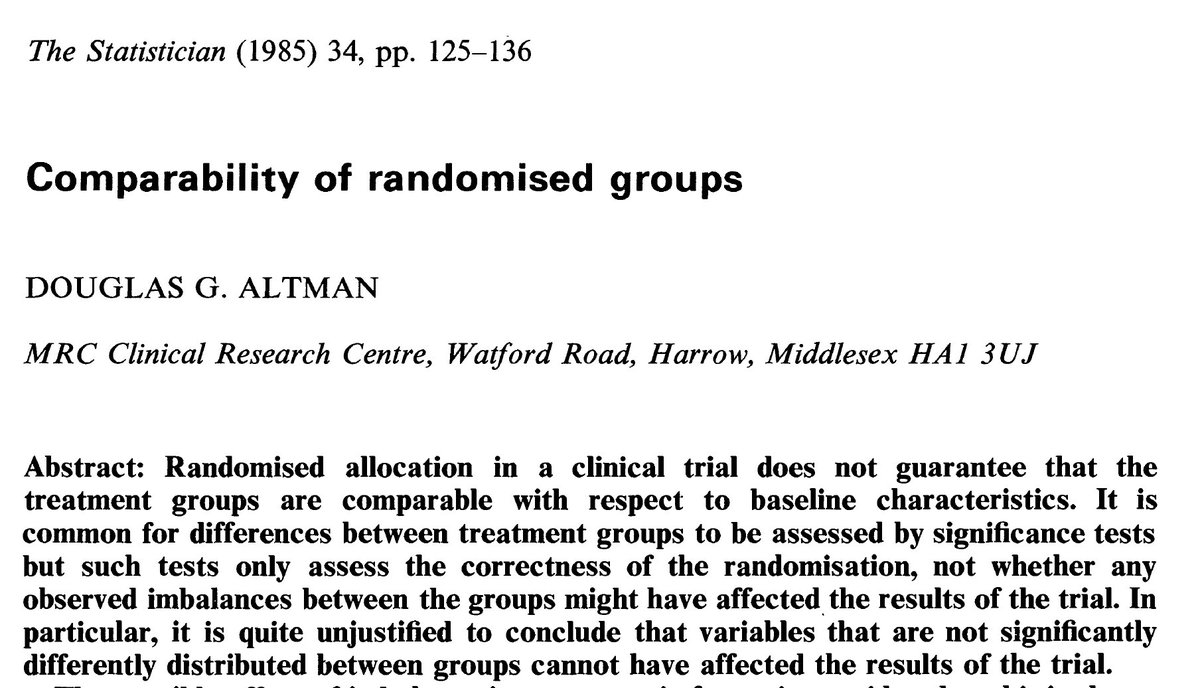
Day 5: baseline balance in a randomized clinical trial
In a randomized clinical trial (or other randomized experiment), participants are randomized into 2 or more groups. Let’s call these “intervention groups”. The randomization procedure ensures that there are no factors besides chance that influence intervention allocation
The intervention groups should thus be comparable in every respect except the receiving intervention at baseline, that is, before receiving the intervention
Nearly every clinical trial paper starts with a table (the infamous Table 1) to demonstrate the “balance” achieved. The intervention groups are compared on several characteristics measured at or before baseline, often using p-values
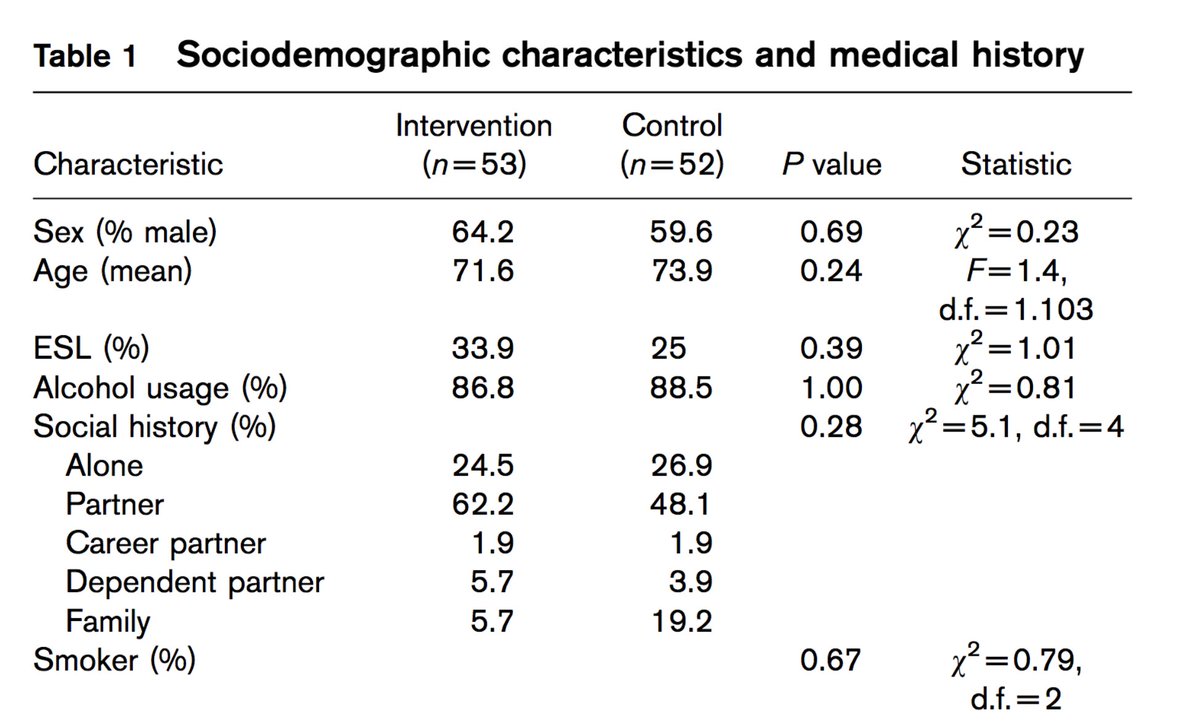
If you have read #statsmisconception #3 and #4 you might immediately spot a problem with this approach for confirming balance between the intervention groups. Indeed, the absence of evidence for imbalance is treated as evidence for balance
More importantly: baseline balance is not even a requirement for valid inference in a clinical trial!
Any clinical trial is almost guaranteed to show “significant” imbalance on at least one baseline characteristic if one would test a large enough number of characteristics
Fortunately, such chance imbalance *doesn’t* make the conventional analysis (e.g. t-test/an(c)ova/regression) of the trial invalid
To put it differently: if – in theory - we would be able to force perfect balance between the intervention groups in some supernatural way, the conventional analysis would be invalid
Intuitively, the analysis in the supernatural hypothetical scenario becomes invalid for the same reasons that methods that assume the data aren’t paired (e.g. your conventional t-test) for data that are paired
For more details about baseline (im)balance, consider reading these two classical papers:
pdfs.semanticscholar.org/e834/97a00c43c…
jstor.org/stable/2987510…
pdfs.semanticscholar.org/e834/97a00c43c…
jstor.org/stable/2987510…
So, what do you do when you find a significant imbalance in a trial?
In summary #statsmisconception #5: in randomized clinical trials, perfect baseline balance is neither attempted nor necessary. Differences between intervention groups on baseline characteristics that occur by chance do not invalidate the conventional analysis of the trial
I forgot to mention related to #statsmisconception #5: p-values in Table 1 was already mentioned in this thread by @JLRohmann
Day 6: More covariates is always better
A prevalent #statsmisconception is that adding covariates to a regression analysis always produces a better estimate of effect (= relation between a particular variable of interest and an outcome). @sTeamTraen pointed this out early in this thread
There are many reasons why putting all the covariates one has measured during a study in a multivariable analysis model isn’t a good idea
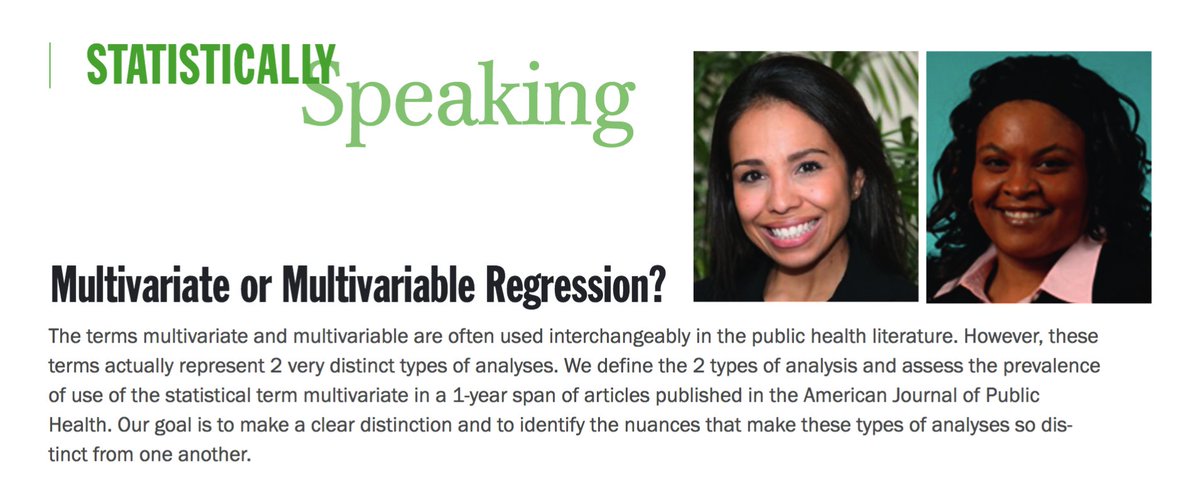
(Small side step: do you know difference between multi*variate* and multi*variable* analysis? If in doubt you probably mean multivariable. Read here about this small #statsmisconception: goo.gl/NJk3Bi)
Not to say that multivariable models should be avoided. Multivariable models are key in analysis of trials (goo.gl/2Eyjfh), causal inference with non-experimental data (goo.gl/jKRcUF), development of prediction models (goo.gl/KossDb), etcetera
There are misconceptions as to why certain covariates should be included in any particular analysis. I will address 3 of these here
1: “To study cause and effect I need to make the groups as equal as possible by including as many variables as I can”
In statsmisconception #4 we saw that in randomized trials, groups don’t have to be perfectly equal for valid cause and effect estimates. Including predefined covariates predictive of the outcome in the analysis might still be a good idea for other reasons: goo.gl/2Eyjfh
With non-experimental data (“observational”) it is a different story. There is a big role for covariates to study cause and effect. Many books have been written about this (highly recommended are: goo.gl/DKuJ5G and goo.gl/99bDqh)
What to do with any particular covariate depends on the role of the covariate in the causal pathway. Covariates can have many roles, including: confounder, effect modifier, intermediate, collider and instrumental variable
2: “The more covariates I include, the more precise my estimate of effect will be”
As a general statement this simply isn’t true. In medicine, where many analyses are done with a binary outcome (logistic regression) or time-to-event outcome (Cox regression), the contrary is more likely to be true: goo.gl/M41QVN
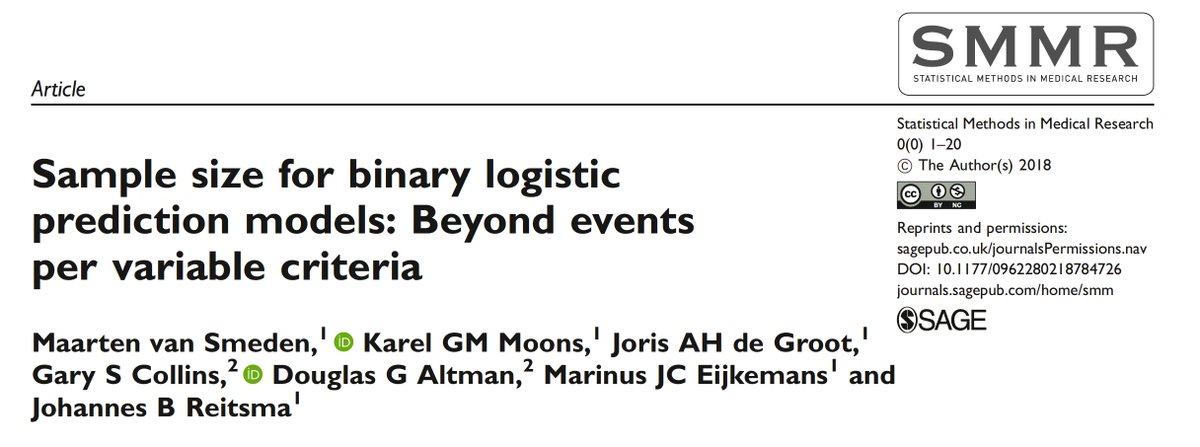
3. “More covariates (i.e. predictors) makes a better prediction model”
Also not true. In fact, a prediction model can easily become severely overfitted with small to medium sized datasets and a large number of covariates, making the prediction model useless and untrustworthy: journals.sagepub.com/doi/full/10.11…
In summary #statsmisconception #6: an increase in the number of covariates in a multivariable regression model doesn’t always make a superior model. As for many things in life, more isn’t always better
Day 7: misconceptions about involving statisticians in applied academic research
As an academic statistician primarily focussed on research on methods and still early in my career, I’ve already come across a respectable amount of help request from junior and more senior researchers working in the same hospital as I do
While these “assisting” or “collaboration” request vary in all kinds of way, they almost all have this one thing in common: data were collected and suddenly an unanticipated problem occurs with the analysis of the data
I will share a few anonymous anecdotes of unrealistic expectations and misconceptions by clients (C) requesting assistance. I’ll also share my go to responses (R) to those expectations that I’m sure can be improved and nuanced. Please share your own thoughts
First meeting, C: can we directly schedule some extra meetings within the next few weeks. I have to finish this quick
R: This is our first meeting. Let’s talk for a maximum of 45 min about the problem and see if I am the right person to help you. I have other things to do too
R: This is our first meeting. Let’s talk for a maximum of 45 min about the problem and see if I am the right person to help you. I have other things to do too
I have deep respect for some of my colleagues who spend almost their entire career helping others with analyses for all kinds of problems. Know that this isn’t the career every statistician you will meet is looking for
C: Did you look at my code that I send you?
R: No, what specific part of the code do you want me to look at?
R: No, what specific part of the code do you want me to look at?
Codes can be hundreds of lines long, sometimes in a language that I don’t see often / have never seen. If you are asking for a short consult, be very specific what part of the code you want checked
C: You must really like working on a real medical research problem for a change
R: Not exactly. You want my help to fix a problem you have. I rather would have been involved from the start of the project
R: Not exactly. You want my help to fix a problem you have. I rather would have been involved from the start of the project
C: If this all works out we can even talk authorship
R:. I’ll give you these 45 minutes for free. Then if we continue we have to talk about time schedule, authorship - I’m just another academic, and financial compensation – authorships just don’t pay my bills
R:. I’ll give you these 45 minutes for free. Then if we continue we have to talk about time schedule, authorship - I’m just another academic, and financial compensation – authorships just don’t pay my bills
I don’t always play it this hard, tbh. Please realize that academic statisticians *are* sometimes also reliant on their "consultancy fees". It’s good practice to at least discuss the potential need for financial compensation and authorship for the work that you ask them to do
C: This feels like a waste: first I spend time and money on following courses on statistics and now I still need your help
R: The things you want to do are very complicated. You also spend less time on learning about statistics than I did learning French. I don’t speak French
R: The things you want to do are very complicated. You also spend less time on learning about statistics than I did learning French. I don’t speak French
Spending time (and money) on courses about critical appraisal and statistical thinking is very worthwhile. It is much more pleasant and effective for a statistician working with clients that are well taught in statistics. Also, I should have been better in talking French by now
A worrying sign is the high number of help requests for statistical emergencies that I get. When an emergency arises, there is generally no written down detailed analysis plan. I often only see the (frustrated) junior researcher that is doing her/his best to get some output
IMHO, the way to move forward is with real long term collaborations between applied researchers and statisticians (and epidemiologists). Get the statistician involved in the design of the study and co-authoring papers, and reserve some grant money to pay for her/his work
Someone once told me that this plan would be so expensive, some of the research done today wouldn’t be possible anymore. That reminded me of the famous quote by Doug Altman that still rings true: “we need less research better research and research done for the right reasons”
In summary #statsmisconception #7: getting statisticians involved once you run into problems while analyzing your data is generally too late. Let’s try to reduce err due to #statsmisconceptions by collaborating more
This is the end of 7 #statsmisconceptions in 7 days and the end of this thread.