1/ I admire Scott's work and he has taught me a lot over the years about how best to interpret economic data. But he is really straining here to find data that avoids the obvious conclusion that our labor market is severely broken for a large segment of society.
2/ To go in order, Scott suggests that using data by education level is unreliable because "we've all gotten more educated." But that's simply untrue. In both 1969 and 2007, the person at the 50th percentile of the distribution had a HS degree.
3/ Scott is right that the "share with a BA doubled," but that wildly overstates the rate of change. Relevant for our purposes is that the share with less than a BA fell from 85 to 69 percent. That's still a change, but it puts in proper perspective the proportional effect.
4/ And remember that some also make the opposite argument, that median wage data is unreliable because millions of (disproportionately lower-earning) people have dropped out of the labor force. Count what they could earn, or count them at $0 wage, and the median gets lower.
5/ Point being, no measure is perfect and things change over time. But that's not an argument for dismissing the best available data for telling us what is happening at least directionally to the vast swath of the population (still a super-majority in Scott's data!) without a BA.
6/ Note, by the way, how unimpressive Scott's preferred measure looks. Looking at raw earnings percentile, he still finds stagnant wages at the 20th percentile and a small increase (looks like about 10%?) at the 50th percentile. 10% over 40 years is a real problem!
7/ A labor market in which the median American gains ~10% during a 40-year period in which GDP per capita more than doubles is very, very broken. That's not a fairness claim. Stipulate that wages have tracked productivity perfectly. Still a lousy outcome. And unsustainable.
8/ In terms of mobility, I'm not sure where Scott's data is from, but Chetty's research comparing children to their parents at age 30 shows a sharp decline in absolute mobility. I also consider relevant this Census report: census.gov/content/dam/Ce… 
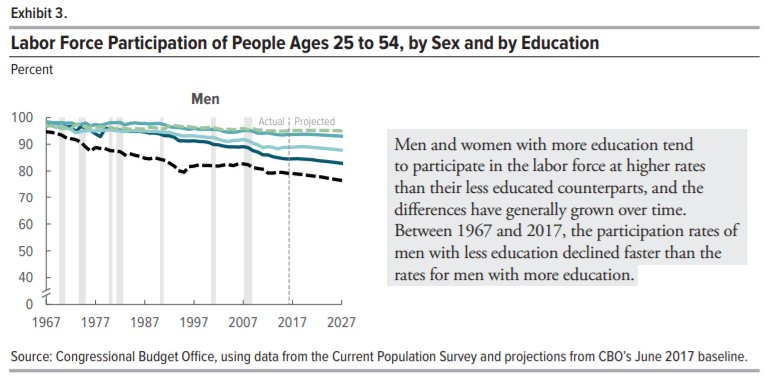
9/ As for labor-force participation, Scott is glossing over the issue when he says "it has fallen among college men too." Sure, but not nearly as much. See CBO: "participation rates of men with less education declined faster." cbo.gov/system/files?f…
10/ The fact that many inactive men don't say they are looking for work doesn't really tell us anything. A rising share of men who aren't even trying to find work anymore is hardly an endorsement of labor market health.
11/ Nor does Scott's final chart on post-tax/transfer household tell us anything about the labor market question of what workers earn. It tells us that households have second earners (with attendant increases in household costs) and are receiving lots of transfers.
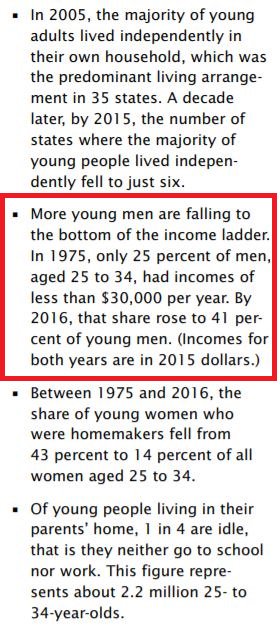
12/ In The Once and Future Worker, I suggest an intuitive measure: median earnings for a male high school graduate compared to the poverty threshold for a family of four. In 1970, that worker earned more than double the poverty line; in 2016, he cleared it by less than 40%.
13/ Or, put another way, median earnings for a male HS grad in 2016 was $34K. To clear the poverty line by as much as he did in 1970, that amount would have to be $54K. That's a massive gap, and the difference between a labor market that supported families and one that doesn't.
14/ And no, the failure is not a function of rising education levels. Even the male HS dropout in 1970 did much better (86% above poverty line) than the HS grad does today.
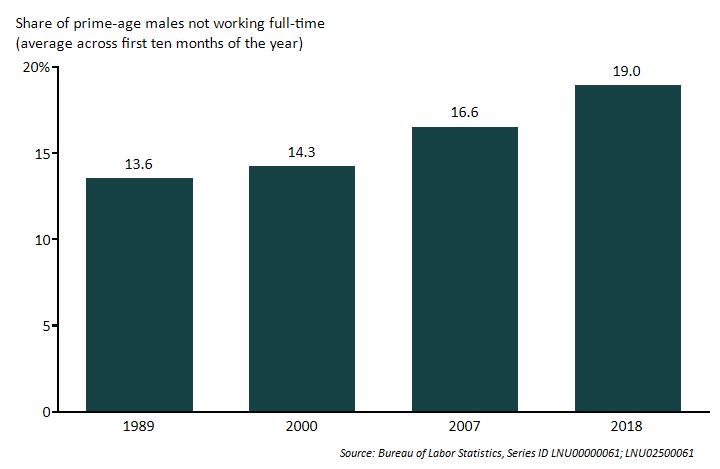
15/ Last point: aggregate data obscures the depth of transformation for particular segments of the population. For instance, in Coming Apart @charlesmurray reports that for "Fishtown," the share of households with a full-time worker fell from 81% in 1960 to 53% in 2010.
@charlesmurray 16/ Likewise, looking regionally, the bottom 80% of U.S. zip codes have fewer jobs than pre-recession and the bottom 20% of zips have more than 40% of prime-age adults not working. @InnovateEconomy eig.org/dci
17/ OK, last-last point: No single statistic is perfect, so we should look for other evidence that's probative even if not conclusive. For instance, most people have long been deeply satisfied with the country's direction and most expect the next generation to be worse off.

18/ Those in the segment we think has faced the worst labor market outcomes are now committing suicide and poisoning themselves at shockingly high rates; contributing to NATIONAL life expectancy FALLING for three years straight.

19/ I should say, I'm sympathetic to Scott's frustration with people who manipulate or misstate data to make the situation look even worse than it is, and he is great at debunking such claims. But that doesn't justify an overcorrection into insisting there is not a real problem.
20/20 We should acknowledge that our economy is failing a significant share of workers, rather than to try and find a statistical view that obscures this reality, and then debate how if at all to respond. The Once and Future Worker attempts to do that. bit.ly/theonceandfutu…