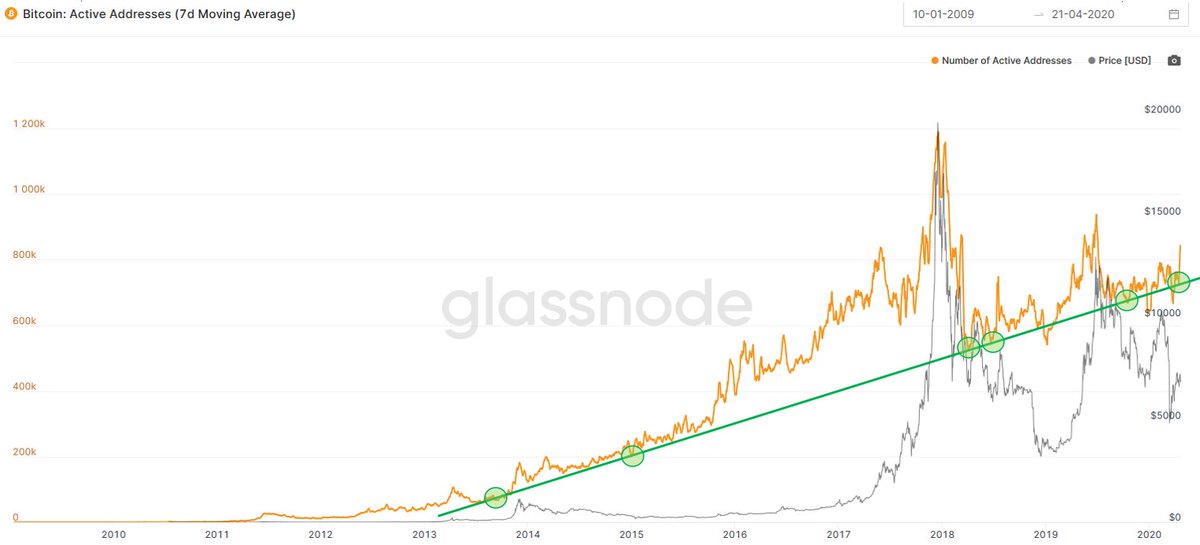
1/ During the last two #Bitcoin bull cycles, price bottoms and tops fluctuated around halving dates in an almost equal ratio. If this relationship were to hold true, we still have more than 570 days of bull market ahead of us, with a cycle top coming in around Sep 2021.

🚀🚀🚀 Image
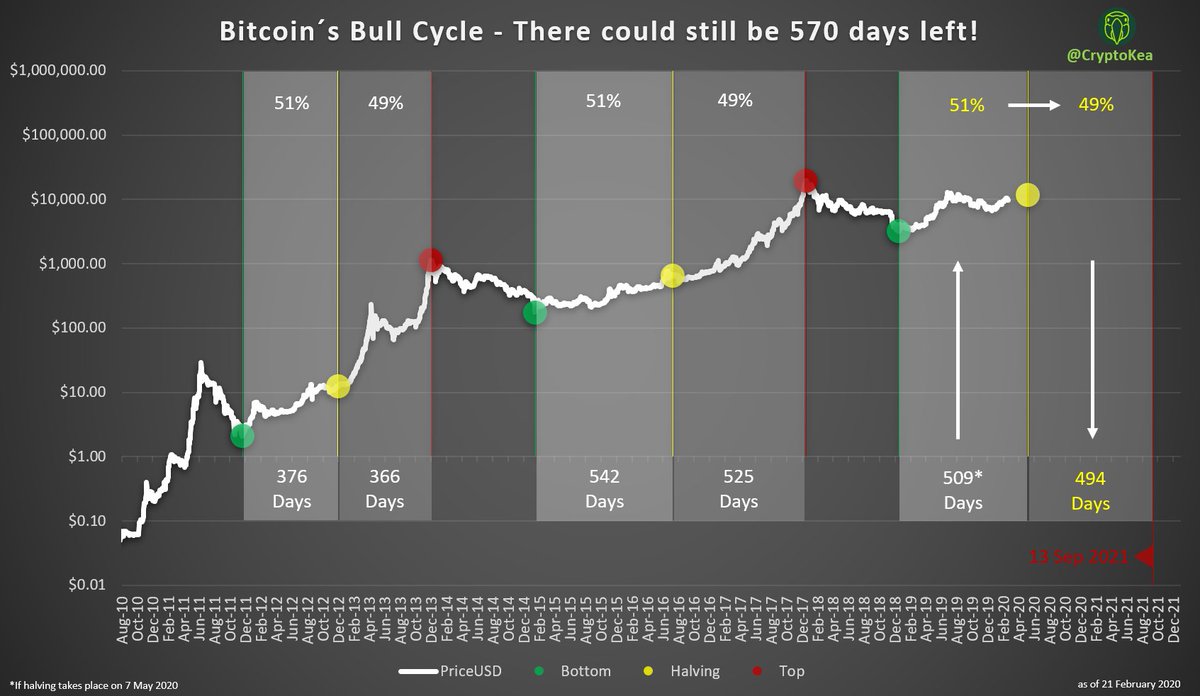
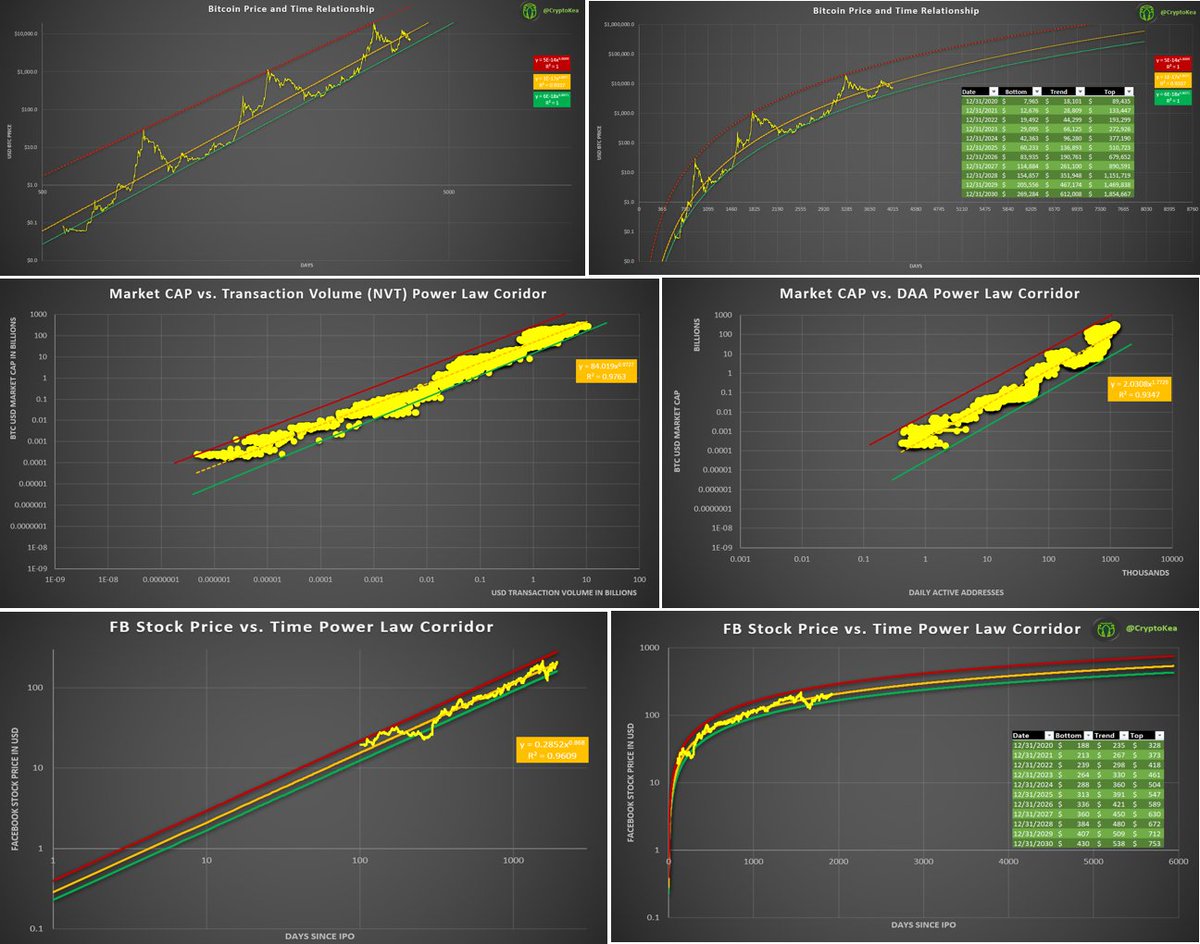
2/ It is still the big question whether Bitcoin´s bull and bear markets take longer each cycle or oscillate around halving cycles. While there are enough good reasons to suggest that cycles are lengthening over time and
3/ likely converge with macro cycles at some point in the future, imo, gravitation around halvings could still be maintained for a while, especially in the early adoption phase of Bitcoin (see #s2f model).

While a sample size of two bull markets is by far too small
4/ to make any prediction, this relationship might eventually not be pure coincidence either (e.g. Stock-to-Flow driven hodl behavior could be one out of many reasons).

We all know history never repeats itself …
BUT it often rhymes. 😉
Awesome, I saw it only now on @TheCryptoZombie 😉👍! Thanks for the mention 🥳🙏

• • •

Missing some Tweet in this thread? You can try to force a refresh
 

Keep Current with CryptoKea

CryptoKea Profile picture

Stay in touch and get notified when new unrolls are available from this author!

Read all threads

This Thread may be Removed Anytime!

PDF

Twitter may remove this content at anytime! Save it as PDF for later use!

Try unrolling a thread yourself!

how to unroll video
  1. Follow @ThreadReaderApp to mention us!

  2. From a Twitter thread mention us with a keyword "unroll"
@threadreaderapp unroll

Practice here first or read more on our help page!

More from @CryptoKea

22 Apr
1/ Is #Bitcoin on track with respect to its latest growth cycle? Daily Active Addresses suggest, we just lifted off from a long-term growth phase support which started end of 2013. This looks quite bullish.

Let´s dive in a bit deeper. 👇
2/ 2 years ago, the low in Daily Active Addresses (DAA) was hit in the latest cycle (DAA is the number of unique addresses active as a sender or receiver on a daily basis). Price followed suit 8 months later at a low of $3.1k. Ever since then we had higher and higher lows in DAA
3/ which translates into a steadily growing user base/interest. But how does this translate to user growth over #BTC's history? As we can see we are back on track of where the latest growth cycle started end of 2013. It also shows what an extraordinary growth we had in 2016-17 to
Read 7 tweets
29 Feb
1/ Are whales and long-term hodlers off-loading their #Bitcoin now? #COVID2019

On-chain data suggests both are still sitting firm & tight on their #BTC . Recent sell-offs are on par with prior bull markets. Nothing extraordinary yet.

Explanation 👇 Image
2/ The above mentioned metric measures the total hodl age of all Bitcoins moved on a given day by multiplying those coins with the number of days they got hodled. This metric is called Coin Days Destroyed (CDD).
3/ To better put CDD into perspective over time, it is helpful to adjust it by the total supply of Bitcoin. This is then called supply-adjusted CDD.
Read 6 tweets
11 Jan
1/ The Log Growth Model also known as power-law corridor has gained a lot of fame recently. Based on it, the bottom is in and we can reach a Bitcoin price as high as 90k this year? The perfect channel fit is too good to be true I thought.

I was very surprised by what I found.
2/ Besides many Bitcoin logarithmic regression models that appeared in recent years (e.g. logarithmic regression by Trololo or Awe & Wonder), the first more scientific approach through defining a power-law channel for price and time was taken by @hcburger1 through the following
3/ Medium article (hcburger.com/blog/powerlaw/…) in September 2019. While many were amazed by this discovery and seemingly perfect relationship of price and time on a log scale, in November 2019, @BurgerCryptoAM published an article officially debunking the model from a statistician´s
Read 47 tweets
24 Dec 19
/1 My personal take on Bitcoin´s current state and short-, mid-, and long-term outlook. In this series, I will take a look at some famous indicators, primarily on-chain metrics, such as aSOPR, VWAP Ratio, Bitcoin Difficulty Ribbon, DAA, RVT Ratio, NVT CAPS, MVRV Ratio and ...
/2 Stock-to-Flow Model.

For the purpose of this analysis, I define short-term up to 3 months, mid-term up to 6 months and long-term > 6 months.
/3 aSOPR – The average Spent Output Profit Ratio by @renato_shira tracks, simply said, the ratio of price sold / price paid through spent outputs and is calculated by dividing realized value (USD) by the value at creation (USD). According to this indicator, a value above 1 is...
Read 49 tweets
16 Jul 19
26/ Bitcoin´s price is very much on track to resemble the first major correction of 2017´s bull market in terms of Mayer Multiples (see full thread for details & targets). Even if we go all the way down to the bottom of the bullish channel, this is still considered a bull market.
For some reason, I cannot attach this post to the prior thread. Please find it here for all the details:
27/ With yesterday´s close, my main targets got hit:

✅Rejection and reversal at 2.5x the 200 DMA (predicted on 24 June with BTC at 11k, hit on 26 June at 12,8k on daily close).

✅Break down to 1.7x the 200 DMA (predicted on 3 July with BTC at 11.9k, hit on 16 July at 9,5k).
Read 38 tweets
24 Jun 19
Will history repeat itself? The @TraceMayer Multiple indicated 4 major trend changes during the last two cycles: (1) Cycle low, (2) Correction #1, (3) Correction #2, (4) Cycle top. If history repeats, we might be close to Correction #1 at around $13k.

#BTC #Bitcoin

Thread 👇
1/ During the last two bull markets, 3 of the 4 major corrections came in exactly at 2.5x the 200 DMA. Assuming that the low is in at $3150 and we are in a bull market, a current 200 DMA of $5070, suggests Correction #1 to take place at around $12,7k. Considering that
2/ the 200 DMA keeps increasing on the way up to 2.5x, the more realistic target would probably be around $13k. What would be the retracement target? During the last bull run, Correction #1 and #2 both came in at around 40%. This would put the downside target at around $7.8k.
Read 26 tweets

Did Thread Reader help you today?

Support us! We are indie developers!


This site is made by just two indie developers on a laptop doing marketing, support and development! Read more about the story.

Become a Premium Member ($3/month or $30/year) and get exclusive features!

Become Premium

Too expensive? Make a small donation by buying us coffee ($5) or help with server cost ($10)

Donate via Paypal Become our Patreon

Thank you for your support!

Follow Us on Twitter!