
,
38 tweets,
11 min read
Read on Twitter
26/ Bitcoin´s price is very much on track to resemble the first major correction of 2017´s bull market in terms of Mayer Multiples (see full thread for details & targets). Even if we go all the way down to the bottom of the bullish channel, this is still considered a bull market. 
For some reason, I cannot attach this post to the prior thread. Please find it here for all the details:
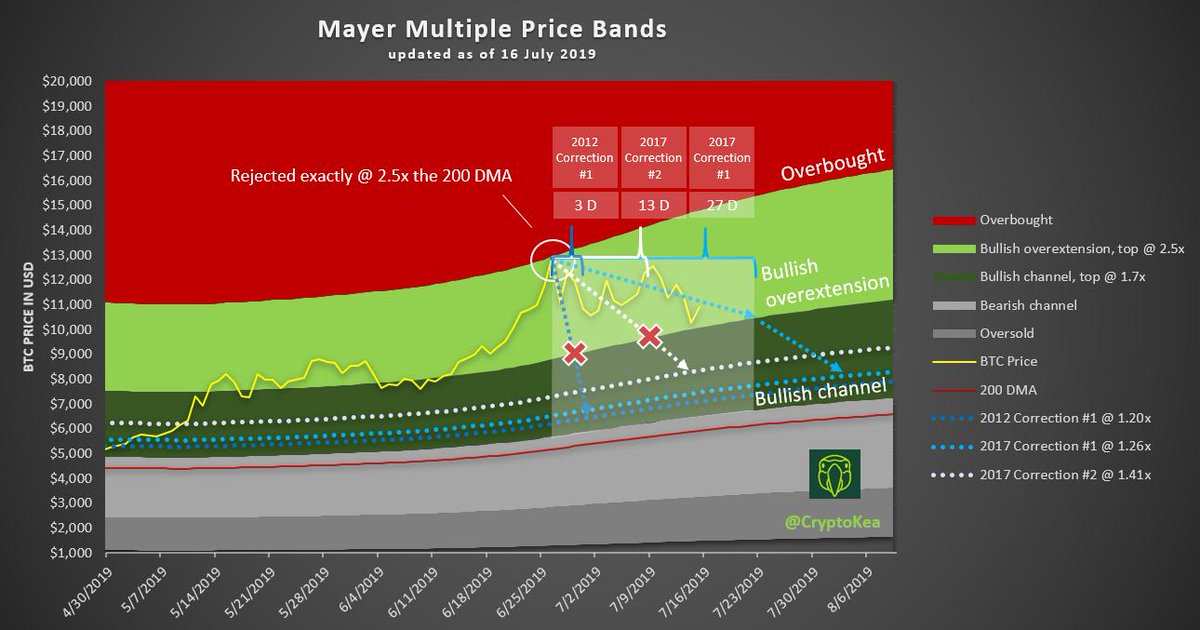
27/ With yesterday´s close, my main targets got hit:
✅Rejection and reversal at 2.5x the 200 DMA (predicted on 24 June with BTC at 11k, hit on 26 June at 12,8k on daily close).
✅Break down to 1.7x the 200 DMA (predicted on 3 July with BTC at 11.9k, hit on 16 July at 9,5k).
✅Rejection and reversal at 2.5x the 200 DMA (predicted on 24 June with BTC at 11k, hit on 26 June at 12,8k on daily close).
✅Break down to 1.7x the 200 DMA (predicted on 3 July with BTC at 11.9k, hit on 16 July at 9,5k).
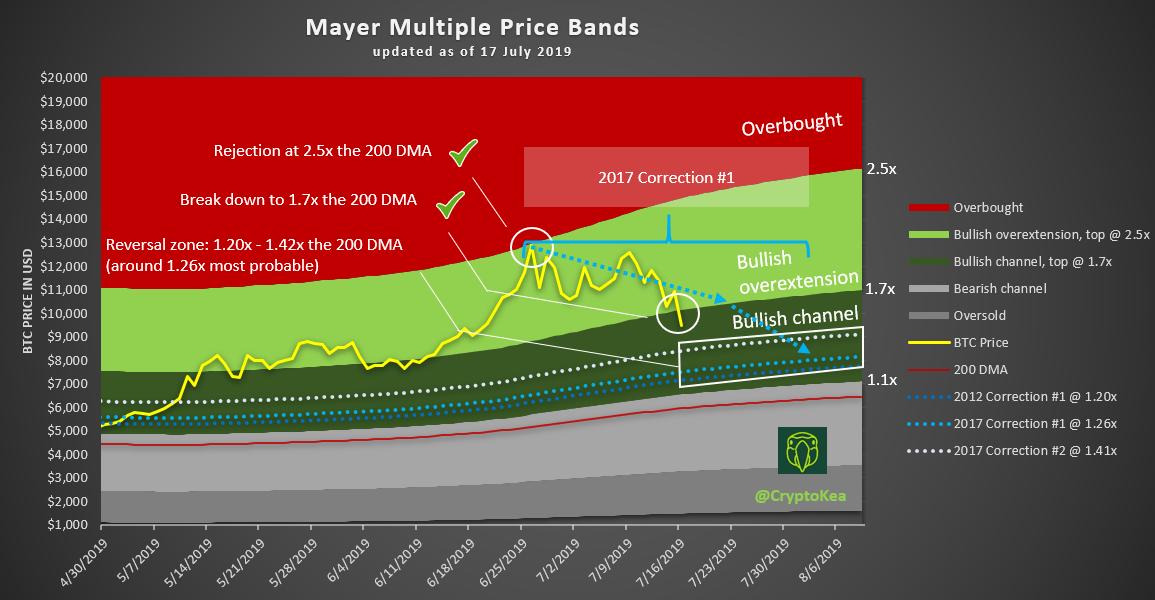
28/ Now left is the possible reversal zone which ranges between 1.20x – 1.46x the 200 DMA. At a current 200 DMA of $5.957, this equals to $7.148 – $8.697 with the most probable target at around 1.26x the 200 DMA (correction #1 of 2017), which currently equals to $7.505.
29/ Very interesting to note is that this would currently not only resemble correction #1 in 2017 in terms of Mayer Multiples but also funny enough equal to a 40% correction off the recent peak at 12,8k based on the daily close. As many people expect $8.5k to hold, I think that
30/ most probably, the majority is due for a decent shock when prices drop ~$1k further. As it will shake out weak hands, long-term hodlers are likely going to step up and buy this up. I expect this to unfold in less than 2 weeks, hopefully with a sharp reversal to the upside.
31/ We are well on track to follow correction #1 of 2017´s bull market in terms of Mayer Multiples and time. I consider the recent price jump to be non-sustainable. We are highly likely due to head lower short-term. Probable reversal zone 1.20x-1.46x of 200DMA of $6k=$7,2k-$8.8k.

32 / Does it feel like the correction is taking longer than expected? You might be surprised how well we are on track when comparing it to correction #1 of the 2017 bull market (blue line). Probable reversal zone 1.20x-1.46x of 200 DMA (currently @ $6156) is now: $7.39k-$8.99k.

33/ UPDATE: Price action still spot on (just hit blue line again). Probable reversal zone slightly moved up to $7.5k-$9.2k (1.20x-1.46x the 200 DMA @$6274). Note: The longer it takes price to get down there, the higher the target range will be as the 200 DMA is still increasing.

34/ This becomes scary now. Price action follows correction #1 of 2017 in terms of Mayer Multiples and time spot on🤯. I expect it to deviate at some point but for now, this is what we´ve got. Price is very close to enter the reversal zone, which is currently at: $7.6k-$9.2k. 🧐

35/ With the daily close on 21 Aug 19, the third and final target got hit:
✅Break down into reversal zone @ 1.42x the 200 DMA
However, this leads to the mother of all questions now: From where do we reverse to the upside?
✅Break down into reversal zone @ 1.42x the 200 DMA
However, this leads to the mother of all questions now: From where do we reverse to the upside?

36/ History has shown that major corrections in Bitcoin bull markets retrace down to the following Mayer Multiples:
2017 correction #2 target at 1.41x the 200 DMA
2017 correction #1 target at 1.26x the 200 DMA
2012 correction #1 target at 1.20x the 200 DMA
2017 correction #2 target at 1.41x the 200 DMA
2017 correction #1 target at 1.26x the 200 DMA
2012 correction #1 target at 1.20x the 200 DMA
37/ If you are new to this thread and would like to know more about the derived targets and why 2012 correction #2 got excluded, please feel free to dive in from the start:
38/ We hit 2017 correction #2 target @ 1.41x, do we reverse to the upside from here? While this level “feels” justified as a point of reversal (it could very well be), assuming that we are in the first-third of a bull market, correction levels of 1.20x-1.26x 200 DMA are typical.
39/ What does this mean in terms of current price targets? (200 DMA @ $7.232 and rising)
1.41x 200 DMA (2017 correction #2) = $10.197 ✅
1.26x 200 DMA (2017 correction #1) = $9.112 (highest probability)
1.20x 200 DMA (2012 correction #1) = $8.678 (2nd highest probability)
1.41x 200 DMA (2017 correction #2) = $10.197 ✅
1.26x 200 DMA (2017 correction #1) = $9.112 (highest probability)
1.20x 200 DMA (2012 correction #1) = $8.678 (2nd highest probability)
40/ As long as the price of Bitcoin stays above 1.20x the 200 DMA (currently at $8.678), I consider any weakness in price as a short-term bull correction.
41/ Are we in a Bitcoin bull market yet? In prior Bitcoin market cycles, the extend to which the price stayed above or below the 200 day moving average, has always been a strong indicator of whether Bitcoin is in a bull or bear market and whether it is over- or undervalued.
42/ @TraceMayer first came up with the idea to measure this relationship and since then, many ideas have sprung off of the so called Trace Mayer Multiple. For example, one could determine certain ranges in which price tends to fluctuate during a specific market cycle.
43/ I found the following price ranges to be very distinctive:
<0.55x the 200 DMA: Oversold
>0.55x and <1.1x the 200 DMA: Bearish Channel
>1.1x and <1.7x the 200 DMA: Bullish Channel
>1.7x and <2.5x the 200 DMA: Bullish Overexentsion
>2.5x the 200 DMA: Overbought
<0.55x the 200 DMA: Oversold
>0.55x and <1.1x the 200 DMA: Bearish Channel
>1.1x and <1.7x the 200 DMA: Bullish Channel
>1.7x and <2.5x the 200 DMA: Bullish Overexentsion
>2.5x the 200 DMA: Overbought
44/ In order to get a better grip on the current market cycle, the above mentioned Mayer Multiple Price Bands can also be visualized as a Bar Code. @TraceMayer
Noteworthy: Whenever #Bitcoin came out of a bear territory (grey), broke through the bullish channel (dark green),
Noteworthy: Whenever #Bitcoin came out of a bear territory (grey), broke through the bullish channel (dark green),
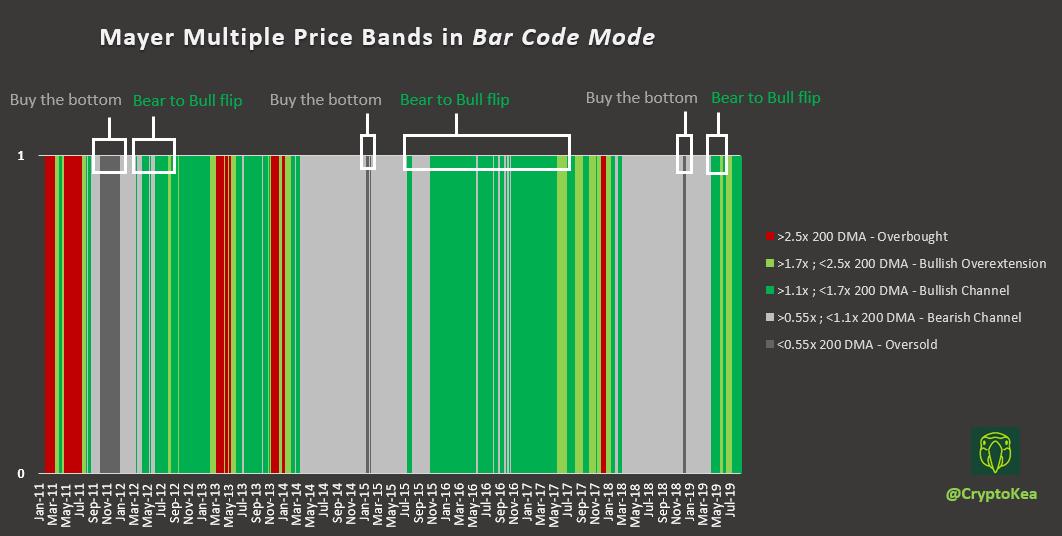
45/ and reached bullish overextension territory (light green), Bitcoin ALWAYS went into overbought territory first (red) before approaching bearish territory again (grey). Current overbought territory would be >2.5x the 200 DMA ($7.334) which equals to > $18.335 and rising.
46/ Even though, the number of data points (two bull markets) are not sufficient to derive a significant relationship and history usually doesn´t repeat itself, it often rhymes.
47/ ~144 days to go until the next halving, how is the Bitcoin price in terms of Mayer Multiple (MM) doing compared to this time before halving 1 & 2? At 1.30, the MM is currently eerily close to halving 1 at 1.27 and halving 2 at 1.24.
But let´s dig a bit deeper.👇
@TraceMayer
But let´s dig a bit deeper.👇
@TraceMayer
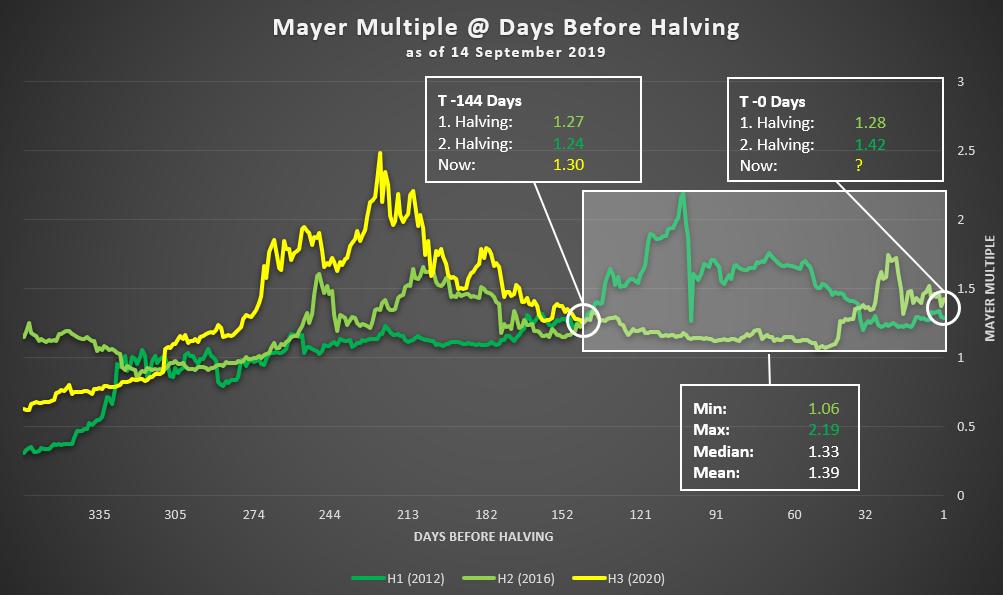
48/ During the remaining 144 days of the last two halvings, the lowest MM reached was 1.06 (during halving 2), the highest was 2.19 (during halving 2), while the median was at 1.33, the mean at 1.39. At a current 200 DMA of $7.974, this suggests a price range of $8.452 - $17.463.
49/ Now, let´s make a fun calculation. What if price took the worst experienced trajectory in terms of Mayer Multiple based on the last two halvings, what if it took the best? What would be the low and high until and price at halving?
50/ Best outcome: Current price follows Mayer Multiple of first halving. The lowest price until halving would be $10.140 (2 day from now), the highest price would be $22.526 (89 days from now). Price at halving would be $20.642.
51/ Worst outcome: Current price follows Mayer Multiple of second halving, the lowest price until halving would be $9.904 (1 days from now), the highest price would be $19.647 (122 days from now). Price at halving would be $16.982. If this fun calculation was to hold any value,
52/ the lows would be behind us in a few days. However, this is really just a fun calculation and not a projection, it should just how positive the Bitcoin price (based on MM) developed during the remaining 144 days until halving. Is history going to rhyme again? Time will tell.
Sorry, it was 244 days to go not 144... My bad! I will provide an update soon!
53/ UPDATE: Based on bitcoinclock.com, we have 226 days to go until the next halving (error in prior version: 144 days). So, how is BTC price in terms of Mayer Multiple (MM) doing compared to this time before halving 1 & 2?
Let´s have a closer look 👇
@TraceMayer
Let´s have a closer look 👇
@TraceMayer

54/ At 1.26, the MM is currently between halving 1 of 1.13 and 2 of 1.35. During the remaining 226 days of the last two halvings, the lowest MM reached was 1.06 (halving 2), the highest was 2.19 (halving 1), while the median was 1.28, the mean was 1.35. At a current 200 DMA
55/ of $8.138, this suggests a current price range of $8.626 - $17.822. Now, let´s make a fun calculation. What if price took the worst trajectory, what if the best in terms of MM based on the last two halvings? What would be the low, high until and price at halving?
56/ Best outcome: Current price follows Mayer Multiple of first halving. The lowest daily closing price until halving would be $10.102 (today), the highest price would be $25.851 (205 days from now). Price at halving would be $22.630.
57/ Worst outcome: Current price follows Mayer Multiple of second halving, the lowest daily closing price until halving would be $9.193 (2 days from now), the highest price would be $26.815 (124 days from now). Price at halving would be $23.920. If this fun calculation was to
58/ hold any value, the lows would be behind us in a few days. However, this is really just a fun calculation, not a price prediction and should just show how positive the Bitcoin price (in terms of MM) usually developed during the remaining 226 days until the next halving.
59/ What a price crash – Does it mean the bull market is over? @TraceMayer´s Mayer Multiple says not yet. In 2013, BTC price broke down to the 200 DMA for 1 day and broke below it for 2 days. What would a similar scenario mean in terms of BTC price and is this a #BTFD?
👇
👇
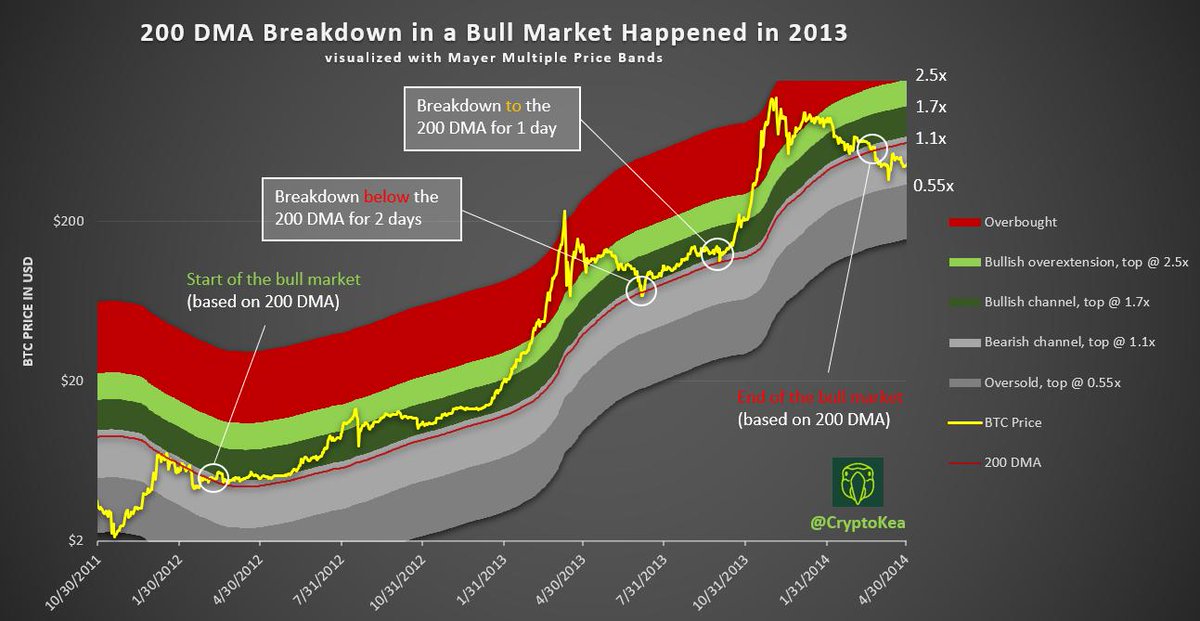
60/ In the bull market of 2013, Bitcoin dropped down below the 200 DMA to a Mayer Multiple of 0.95. IF Bitcoin was to drop down to a Mayer Multiple of 0.95 today, it would translate into a daily closing price of $7.901 (0.95x current 200 DMA of $8.317).

61/ If I didn´t have my full position size in BTC yet, I would slowly scale in further in the MM range of 1.04–0.95. However, as price has never spent more than 2 days below the 200 DMA in a bull market, I would hedge downside risk latest after 1 week <1 or immediately <0.9.#BTFD


