/1 My personal take on Bitcoin´s current state and short-, mid-, and long-term outlook. In this series, I will take a look at some famous indicators, primarily on-chain metrics, such as aSOPR, VWAP Ratio, Bitcoin Difficulty Ribbon, DAA, RVT Ratio, NVT CAPS, MVRV Ratio and ... 

/2 Stock-to-Flow Model.
For the purpose of this analysis, I define short-term up to 3 months, mid-term up to 6 months and long-term > 6 months.
For the purpose of this analysis, I define short-term up to 3 months, mid-term up to 6 months and long-term > 6 months.
/3 aSOPR – The average Spent Output Profit Ratio by @renato_shira tracks, simply said, the ratio of price sold / price paid through spent outputs and is calculated by dividing realized value (USD) by the value at creation (USD). According to this indicator, a value above 1 is...
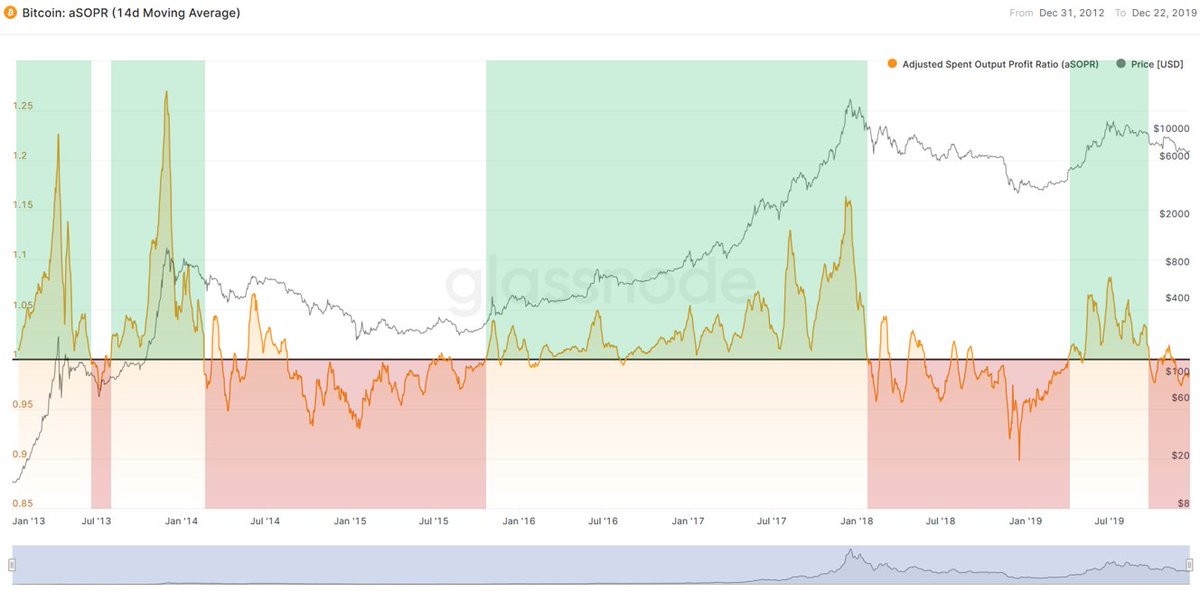
/4 usually typical in a bull and a value below 1 in a bear market. As the ratio has been below 1 for an extended period of time, it suggests people keep selling at a loss, expecting lower prices ahead (bear market signal). The ratio of 1 tends to act as resistance during such a..
/5 bear market and price has yet to get rejected from it. When that happens, we are likely in the late stage of it. As this indicator usually takes month to turn bullish again, short- and medium-term outlook is bearish.
Short-term: Bearish
Medium-Term: Bearish
Long-Term: -
Short-term: Bearish
Medium-Term: Bearish
Long-Term: -
/6 VWAP Ratio – Volume Weighted Average Price as first created by @icoexplorer determines the average price the market paid for their Bitcoin. Therefore, it could be considered an alternative method to the realized price metric.
In the past 8 years, whenever the 30D VWAP...
In the past 8 years, whenever the 30D VWAP...
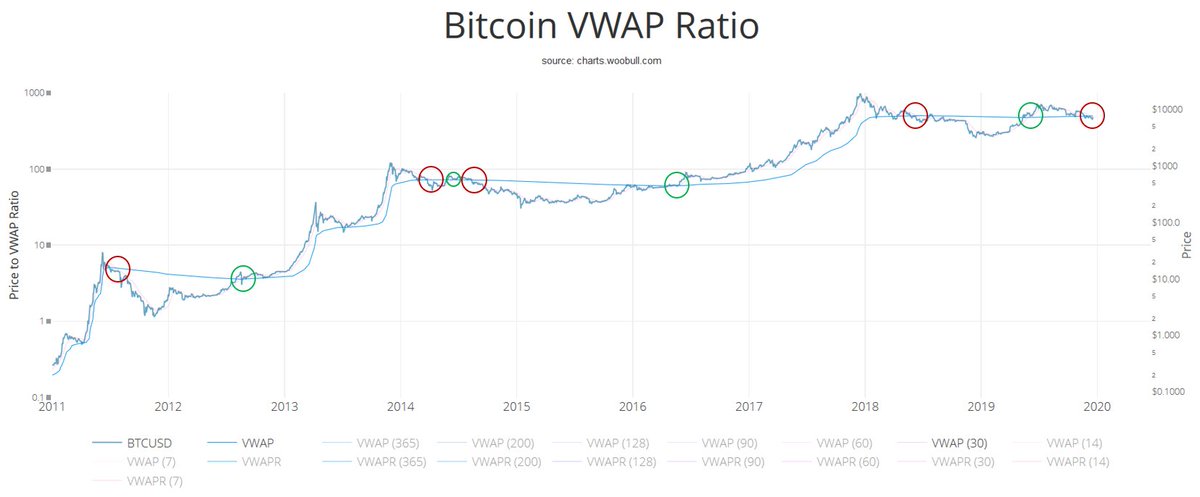
/7 crossed below the VWAP, it marked the beginning of a bear market. This time it could be no different as it is crossing to the downside again. The time it took from crossing to reaching the bottom: From 2011 - 4 months, 2014 - 9 months, and 2018 - 6 months. History never...
/8 repeats itself, but it could rhyme, meaning there is a decent chance of several months of downside ahead. However, this indicator could turn around quickly to the upside if momentum is there. Therefore, short-term outlook is bearish and medium-term outlook bearish to neutral.
/9
Short-term: Bearish
Medium-Term: Bearish to Neutral
Long-Term: -
Short-term: Bearish
Medium-Term: Bearish to Neutral
Long-Term: -
/10 Bitcoin Difficulty Ribbon (BDR) by @woonomic consists of SMAs of BTC network difficulty. Whenever these SMAs compress, it signals that miners are going out of business, leaving only the strong miners behind taking the sell pressure from struggling miners who need to sell...

/11 BTC to cover operating costs away. Assuming that current compression is not due to new miner generation switching or similar, I can only foresee two scenarios based on this indicator so far: (1) The bottom is only a few weeks away (yellow bars), (2) The bottom could be in...
/12 and we are only a few weeks/months away from a parabolic run-up (green bars). Therefore, short-term outlook under (1) is bearish (downside until bottom), under (2) neutral (price goes sideways), mid-term outlook (1) neutral (price likely recovered from bottom by then) and...
/13 under (2) bullish (price is already in first phase of parabolic run-up).
Short-term: Bearish to Neutral
Medium-term: Neutral to Bullish
Long-term: -
Short-term: Bearish to Neutral
Medium-term: Neutral to Bullish
Long-term: -
/14 Daily Active Addresses (DAA) – Is the number of unique addresses active as a sender or receiver on a daily basis.
Despite the bearish price trend, the DAA has stabilized decently above the 2018 median DAA while still keeping the upward trend since 2013 intact.
Despite the bearish price trend, the DAA has stabilized decently above the 2018 median DAA while still keeping the upward trend since 2013 intact.

/15 As Metcalf´s law states: “The effects of a network is proportional to the square of the number of connected users of the system”, suggesting that the continuous growth in DAA could be a very relevant and positive development metric to Bitcoin´s future value growth. It does..
/16 not tell much about short-term prices but quite likely is a positive long-term bullish signal.
Short-term: -
Mid-term: -
Long-term: Bullish
Short-term: -
Mid-term: -
Long-term: Bullish
/17 RVT Ratio – Realized Value to Transaction Volume first created in-house @adaptivefund by @kenoshaking and later created in parallel by @_Checkmatey_ describes the total value the market paid for their coins in relation to the transaction volume and should not only help...
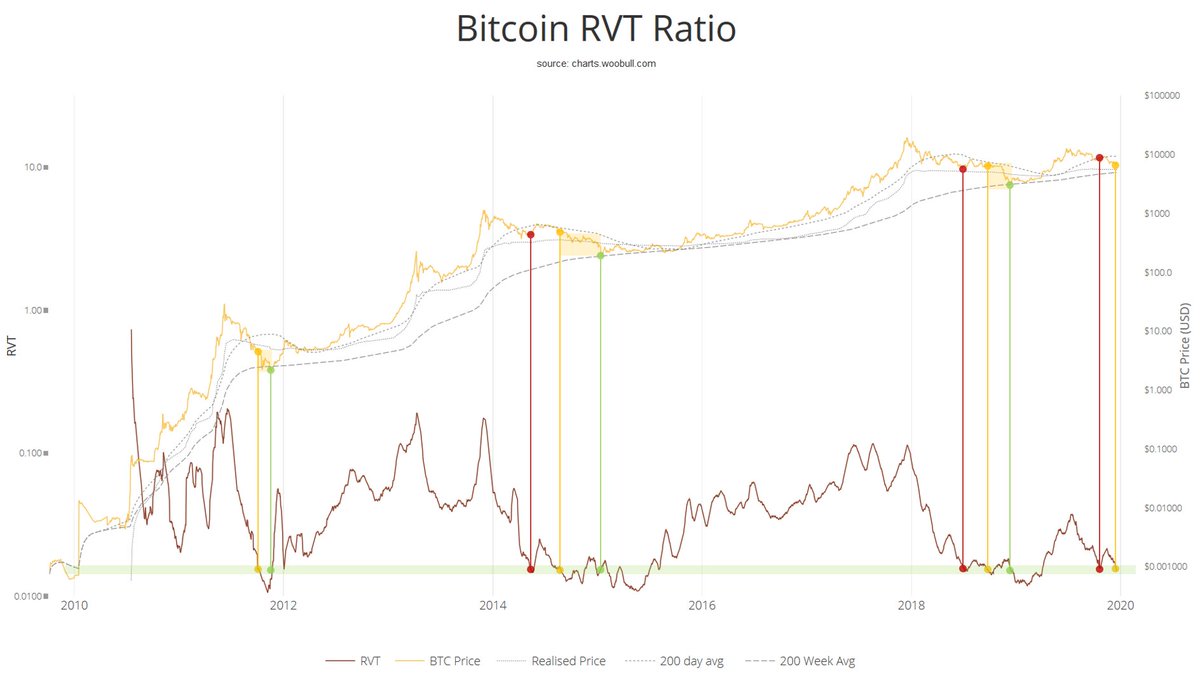
/18 spotting market tops and bottoms but also to locate the market phase Bitcoin is currently in. Looking at the last three times when Bitcoin came down the to the current RVT ratio after an extended period of higher RVTs for the first time (red), price was 1, 8, and 6 months...
/19 away from reaching bottom (in 2011, 2014, 2018), when the ratio came down for the second time (orange), price was 5 and 3 months away from the bear market bottom (2014, 2018). Noteworthy: The last three bottoms happened at almost the exact RVT ratio and current ratio is...
/20 almost spot on.
For fractal lovers: One could infer that the distance between red and orange could be a time indicator for the time distance between orange and green (the bottom). Distance between current red and orange RVT ratio is 1,8 months. This would put a bottom...
For fractal lovers: One could infer that the distance between red and orange could be a time indicator for the time distance between orange and green (the bottom). Distance between current red and orange RVT ratio is 1,8 months. This would put a bottom...
/21 target of mid February 2020 in place.
Short-term: Bearish
Medium-Term: Bearish to Neutral
Long-term: -
Short-term: Bearish
Medium-Term: Bearish to Neutral
Long-term: -
/22 NVT CAPS – This indicator is based on the NVT ratio. The NVT Ratio stands for Network Value to Transaction Value Ratio, first created by @woonomic, could also be described as a PE Ratio equivalent as used in equity markets. It describes by which factor the network value...
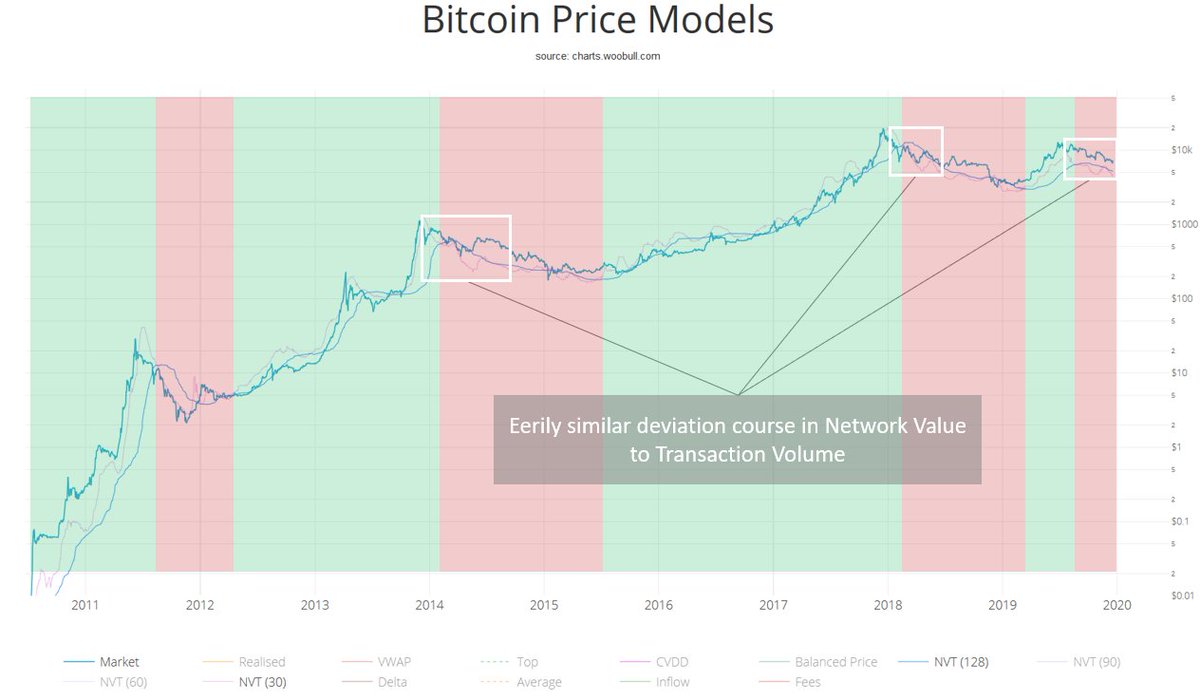
/23 is outstripping the value transmission on-chain. In this chart you can see an iteration of it called NVT CAPS. This indicator is mapping velocity back to market cap through this NVT Ratio. Tops have been confirmed by a steep drop-off in NVT (30D) crossing NVT (90D) to the...
/24 downside (shift from green to red). A strong break to the upside marked the beginning of each bull market (shift from red to green). The breakdown in August this year confirmed the bear market and its NVT development looks eerily similar to the the bear...
/25 market of 2014 and 2018. Therefore, short- to medium-term outlook is bearish.
Short-term: Bearish
Medium-term: Bearish
Long-term: -
Short-term: Bearish
Medium-term: Bearish
Long-term: -
/26 MVRV Ratio – Market Value to Realized Value Ratio was first created by @MustStopMurad and @kenoshaking and is based on the market value of Bitcoin (spot price * supply) and on the Realized Value (sum of market value of BTCs when last moved * supply) which was first...
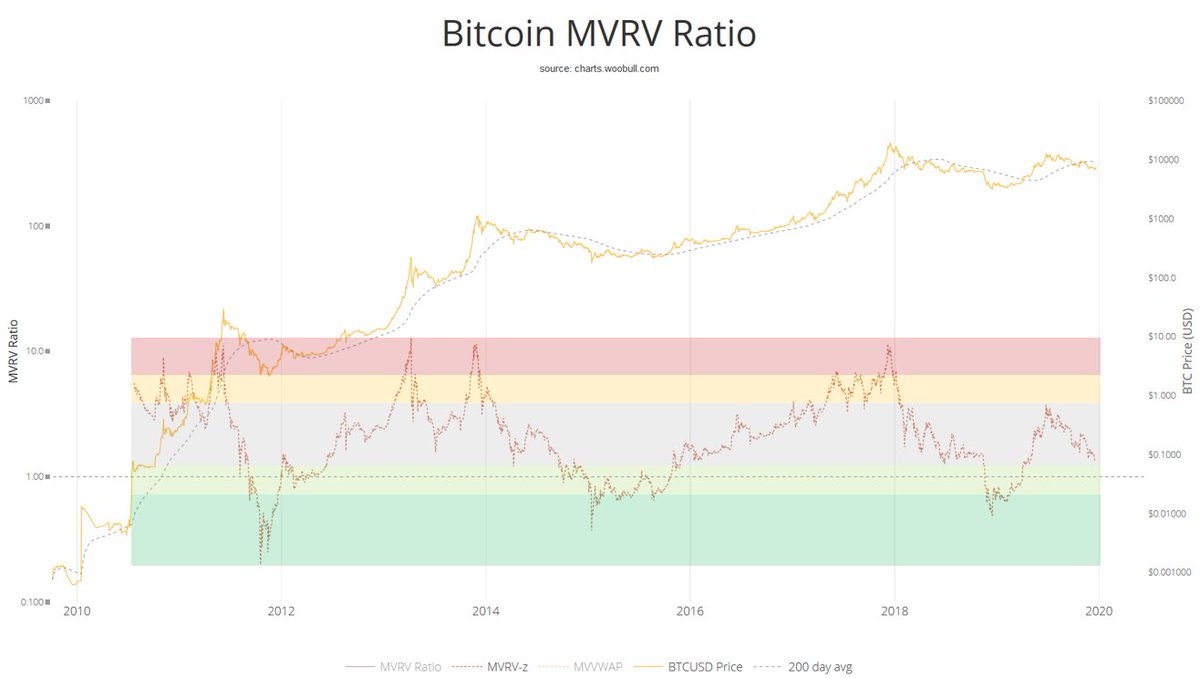
/27 invented by @nic__carter and @khannib. As one tries to infer from Realized Value what the market last paid for their BTC, comparing it to the market value, derives a ratio which expresses by which factor current market price is above or below what the market paid for all...
/28 current BTC in circulation or in other words whether current spot price is over- or undervalued. In the past, using a z-metric has provided an even more balanced view. If one were to slice the ratio into several buckets, I would do it in form of colour bands as in the...
/29 picture, meaning current price is still not in undervaluation territory, could get there medium-term but might only recover to current price levels long-term. Therefore, short-, and medium-term outlook bearish.
Short-term: Bearish
Medium-term: Bearish
Long-term: -
Short-term: Bearish
Medium-term: Bearish
Long-term: -
/30 Reserve Risk – This indicator was developed by @hansthered under the umbrella of the @Ikigai_fund and is based on several on-chain metrics such as BDD, VOCD and others to visualize a confidence level of long-term Hodlers relative to the price of Bitcoin. Due to its...
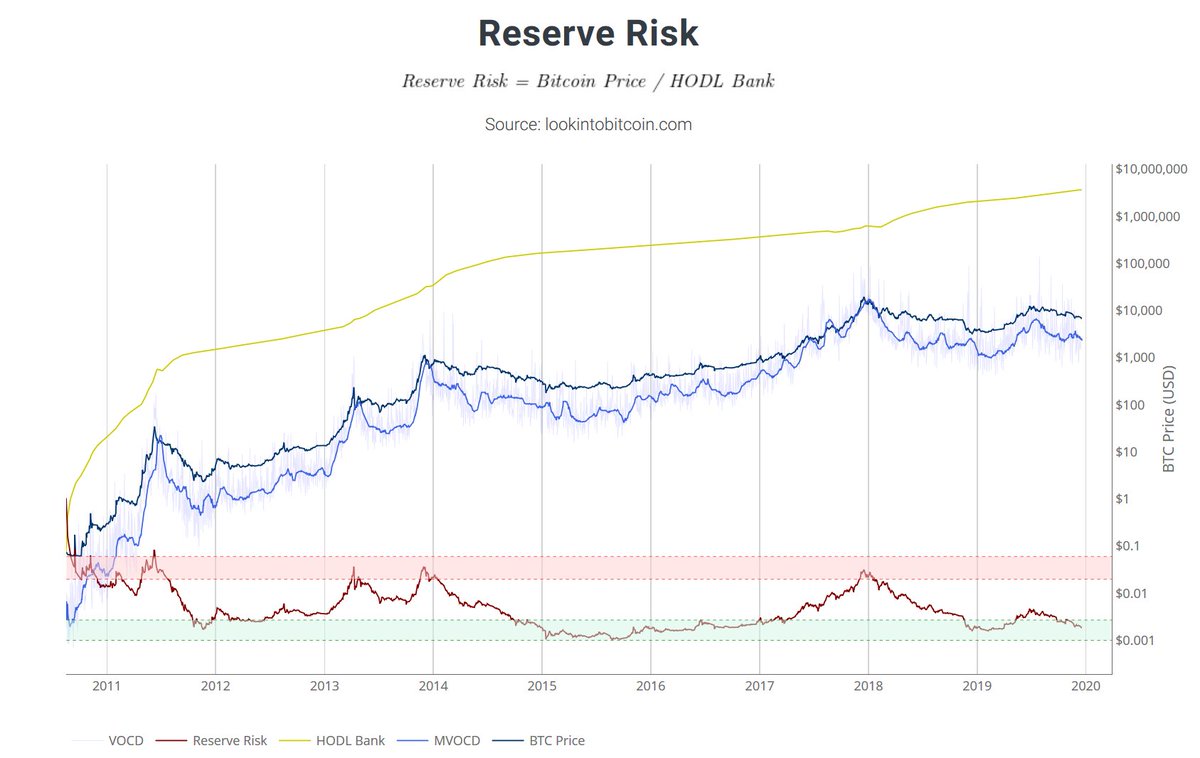
/31 complexity, I would like to point to the following description for further details on how this indicator is derived: lookintobitcoin.com/charts/reserve… as summarized by @PositiveCrypto. Simply said, if confidence is high and price is low, the Reserve Risk is low, signaling a good...
/32 opportunity to buy as chances of outsized returns over a multi-year horizon is high.
Short-term: -
Medium-term: -
Long-term: Bullish
Short-term: -
Medium-term: -
Long-term: Bullish
/33 Stock to Flow Model
The model was developed by @100trillionUSD and is probably one of the most famous models in crypto for long-term price projection of Bitcoin today. In very simple terms it describes the relationship between the scarcity of a commodity and the value it...
The model was developed by @100trillionUSD and is probably one of the most famous models in crypto for long-term price projection of Bitcoin today. In very simple terms it describes the relationship between the scarcity of a commodity and the value it...

/34 tends to accrue. A high SF Ratio describes a high level of scarcity, suggesting high value accrual. As Bitcoin´s issuance rate gets cut in half every 4 years (next halving expected in May 2020), the value accrual should continue to increase long-term. For those not familiar..
/35 with the model yet, I highly recommend reading PlanB´s article for further insights: medium.com/@100trillionUS…. If you want to do a deep dive, I can highly recommend reading @saifedean ´s book “The Bitcoin Standard” further elaborating the economic concept of Bitcoin and its..
/36 ever increasing scarcity. Now back to the model. What I found most interesting to watch about it this year, was the debate about how value growth could be projected while neglecting the demand side and how statistians such as @BurgerCryptoAM and @phraudsta tried to falsify..
/37 the model and became proponents. Don´t get me wrong, no model is perfect, and it is always a matter of time until it becomes wrong, but for now, this is the most solid model for long-term projection of the Bitcoin price and it looks very bullish. While current projected...
/38 price should be around 8,143 USD, the price should reach > 100,000 USD within 1.5 to 4 years. This is a very promising outlook to say the least. While deviations from model to current price can sustain short- to mid-term, the long-term confidence of this model is high.
/39 Therefore, my short-, and mid-term outlook based on this model is neutral, as I don´t expect the upcoming halving to have an immediate but long-term impact on price.
Short-term: -
Mid-term: -
Long-term: Bullish
Short-term: -
Mid-term: -
Long-term: Bullish
/40 So, let´s summarize the findings:
First of all, the purpose of this analysis is by no means an exact price prediction as we know that “The inability to predict outliers implies the inability to predict the course of history” (Nassim Nicholas Taleb), meaning no one can..
First of all, the purpose of this analysis is by no means an exact price prediction as we know that “The inability to predict outliers implies the inability to predict the course of history” (Nassim Nicholas Taleb), meaning no one can..
/41 predict with 100% certainty any price development as black swans can happen any time. Nevertheless, given all these models and metrics, they can serve as decent indicators to determine an under- or overvalued market to make my own judgements on whether it is a good time...
/42 to take some chips off the table or add some BTC to the stack in the same way the stock market leverages other financial metrics. This is just my personal, very subjective interpretation and can vastly deviate from other people´s viewpoints. This is purely my own opinion...
/43 for my own decision making which I am happy to share hereby for those interested.
Now let´s get to the summary:
Short-term Outlook (up to 3 months)
aSOPR: Bearish
VWAP: Bearish
BDR: Bearish to Neutral
RVT Ratio: Bearish
NVT CAPS: Bearish
MVRV Ratio: Bearish
Now let´s get to the summary:
Short-term Outlook (up to 3 months)
aSOPR: Bearish
VWAP: Bearish
BDR: Bearish to Neutral
RVT Ratio: Bearish
NVT CAPS: Bearish
MVRV Ratio: Bearish
/44
Conclusion: Bearish, at least a few more weeks, most likely a few months until bottom
Medium-Term Outlook (up to 6 months)
aSOPR: Bearish
VWAP: Bearish to Neutral
BDAR: Neutral to Bullish
RVT Ratio: Bearish to Neutral
NVT CAPS: Bearish
MVRV Ratio: Bearish
Conclusion: Bearish, at least a few more weeks, most likely a few months until bottom
Medium-Term Outlook (up to 6 months)
aSOPR: Bearish
VWAP: Bearish to Neutral
BDAR: Neutral to Bullish
RVT Ratio: Bearish to Neutral
NVT CAPS: Bearish
MVRV Ratio: Bearish
/45 Conclusion: Bearish to Neutral, bottom likely found within next 6 months
Long-Term Outlook ( > 6 months)
Daily Active Addresses: Bullish
Reserve Risk: Bullish (> 1 year)
Stock-to-Flow Model: Bullish (> 1 year)
Long-Term Outlook ( > 6 months)
Daily Active Addresses: Bullish
Reserve Risk: Bullish (> 1 year)
Stock-to-Flow Model: Bullish (> 1 year)
/46 Conclusion: Bullish, bottom likely latest left behind within 1 year from now, price will be on another parabolic run-up with a price target of > 100,000 USD
Imho, we are likely approaching a market phase in which I personally believe the risk/reward ratio for a...
Imho, we are likely approaching a market phase in which I personally believe the risk/reward ratio for a...
/47 long-term investment (> 2 years) is extraordinarily good (no financial advice). I am looking to add 20% to my position size over the course of the next weeks/months.
Putting all short-term price movements and craziness in crypto aside, let´s not forget about Satoshi´s...
Putting all short-term price movements and craziness in crypto aside, let´s not forget about Satoshi´s...
/48 intention and the big picture what positives it could bring if the vision comes to fruition. Let´s remind each other why we are here in the space and educate our friends and family about the long-term benefits of Bitcoin.
/49 Here is a nice reminder, one of my favorite explanations to "what is Bitcoin" 😊.
Merry Xmas to everyone🎄🙏!
Merry Xmas to everyone🎄🙏!