
Very proud of our recent paper on #epi of #appendicitis just published in @JAMASurgery | ja.ma/2wHn6p2 | Thankful to my collaborators @ReeceGeo, @SESanchezMD, & @DaveFlum | Thankful to @BMCSurgery & the Tauber Fam Foundation who gave me time to work on it. Thread 1/11
Most (not all, of course) papers written on appendicitis in last 10-20 yrs have been based on proportions: # cases w perforation / # cases of appendicitis [including several studies by yours truly!]. But this metric requires a big assumption … 2/11
The assumption is that the groups of patients who are being compared (say, patients with private insurance vs. patients with Medicaid vs. patients with no insurance) all come from populations at equal risk of #appendicitis. But does this assumption hold up? 3/11
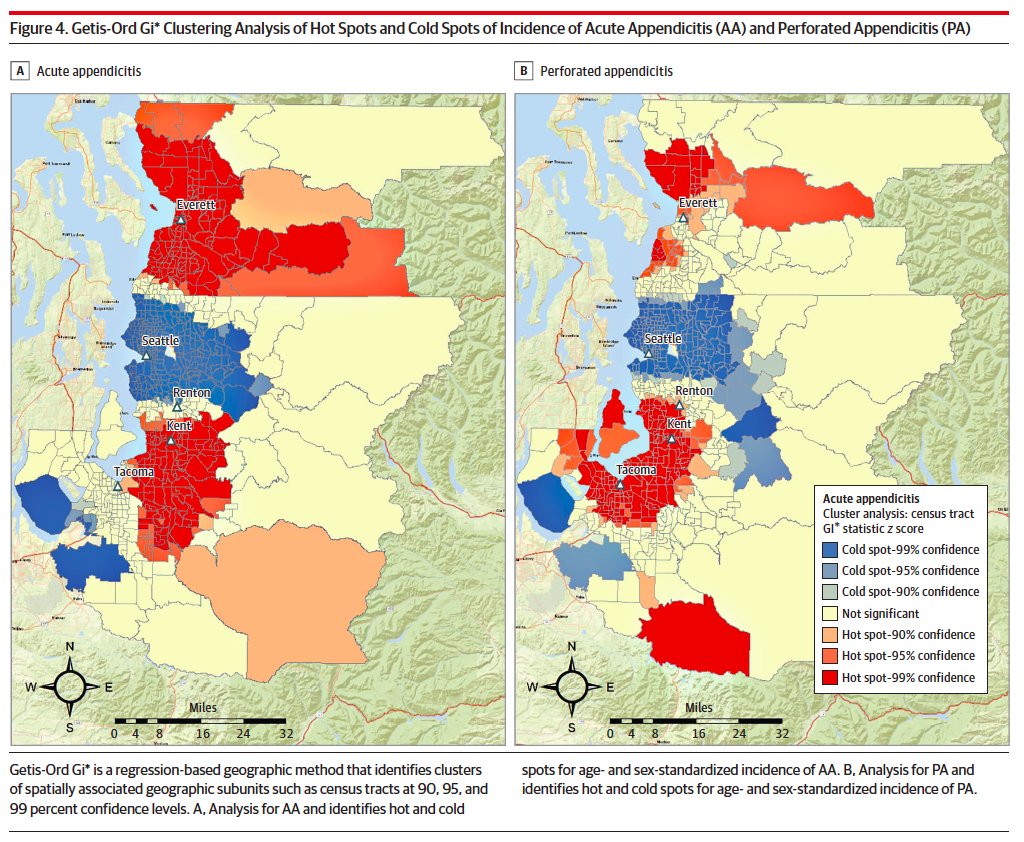
Along w @BMCSurgery, @UWSurgery, @SFSU Geo collaborators, we looked at this another way: using a statewide dataset, we allocated cases of appendicitis & perf'd appendicitis to small geographic areas (census tracts) & generated population-based incidences for both conditions. 4/11
If incidence of appendicitis is random, all the census tracts in the map should have similar shades, or the high and low-incidence census tracts should be scattered about randomly; but we didn’t find that at all; we found patterns:
(5/11)
(5/11)

The strength of these patterns can be measured via a geographic methodology called Moran’s Index: pro.arcgis.com/en/pro-app/too…
(6/11)
(6/11)
“Incidence of AA & PA both demonstrated significant non-random spatial variability; however, the maps depict a higher degree of geographic autocorrelation for AA compared to PA, a finding that was determined statistically using Moran’s I: AA=0.30 & PA=0.16 (p<0.001).” 7/11
Once we ID'd high incidence areas (“hot spots”) & low incidence areas (“cold spots”), we compared their characteristics, using 2010 @USCensusBureau data. High incidence areas had reduced socioeconomic status (lower college educ. & income) compared to low incidence areas. (8/11)
Example SES data (aggregated census tract data) --
Bachelor’s degree: 55.8% versus 25.6% (cold spot versus hot spot)
Per capita income: $44,691 versus $30,027 (cold spot versus hot spot)
(thread 9/11)
Bachelor’s degree: 55.8% versus 25.6% (cold spot versus hot spot)
Per capita income: $44,691 versus $30,027 (cold spot versus hot spot)
(thread 9/11)
one thing this paper does NOT do is stake a claim for why appendicitis has clusters of high/low incidence, nor do we identify mechanisms for the assoc w/ SES. We are going to study that next; hopefully other colleagues studying appendicitis will take up this challenge (10/11)

In conclusion: #appendicitis is a fascinating condition, and there is a lot more to learn (11/11)
@threadreaderapp unroll


