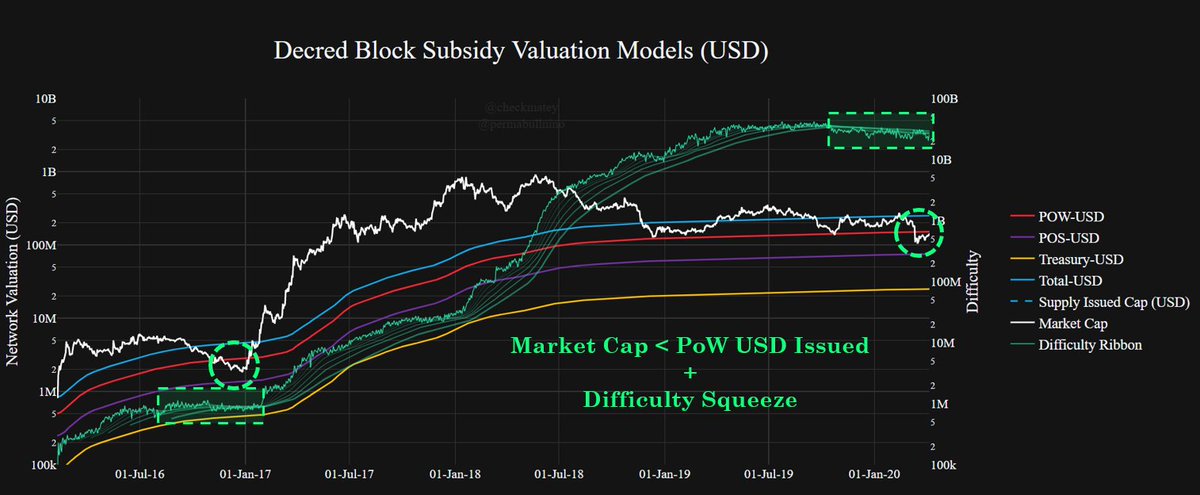
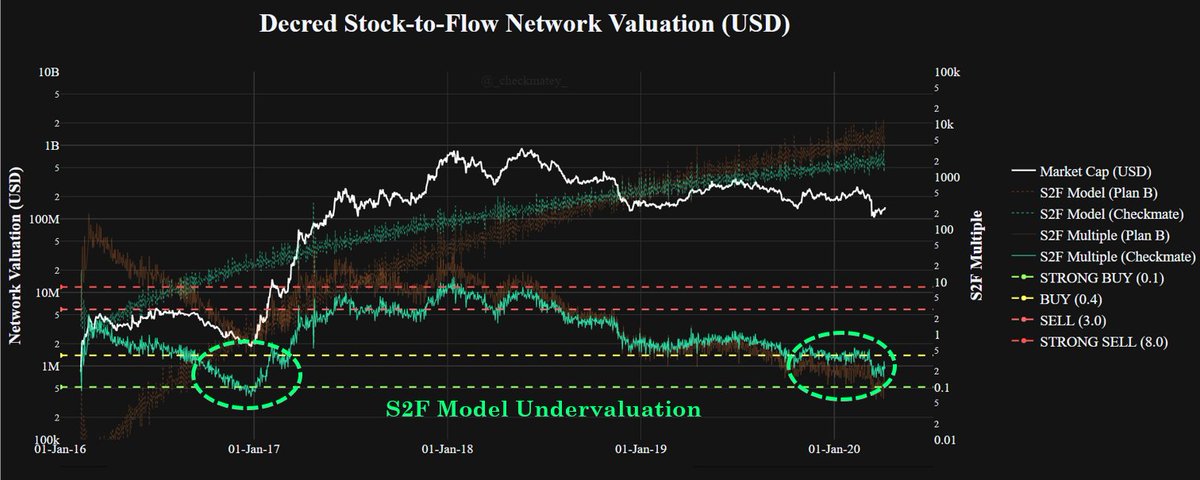
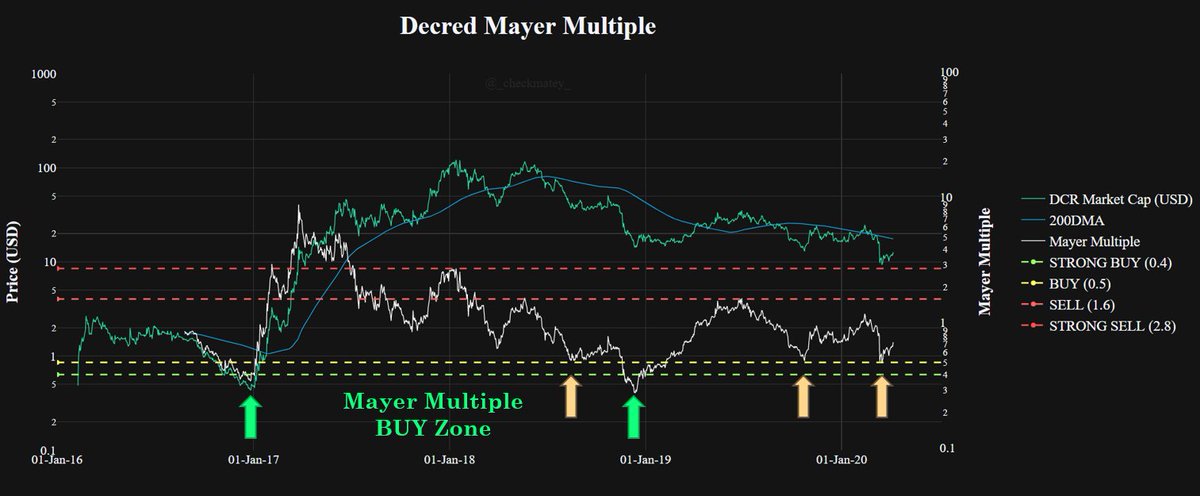
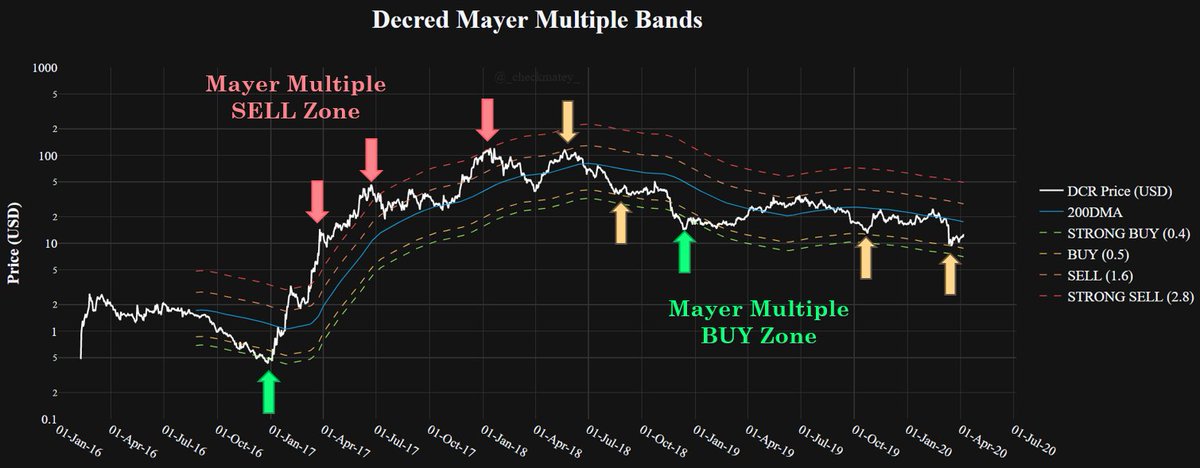
Taking the ratio with Price gives us an indication of large deviations from the mean.
Currently, Price is 1.5 standard deviations from the model, a zone of mean reversion.
4/
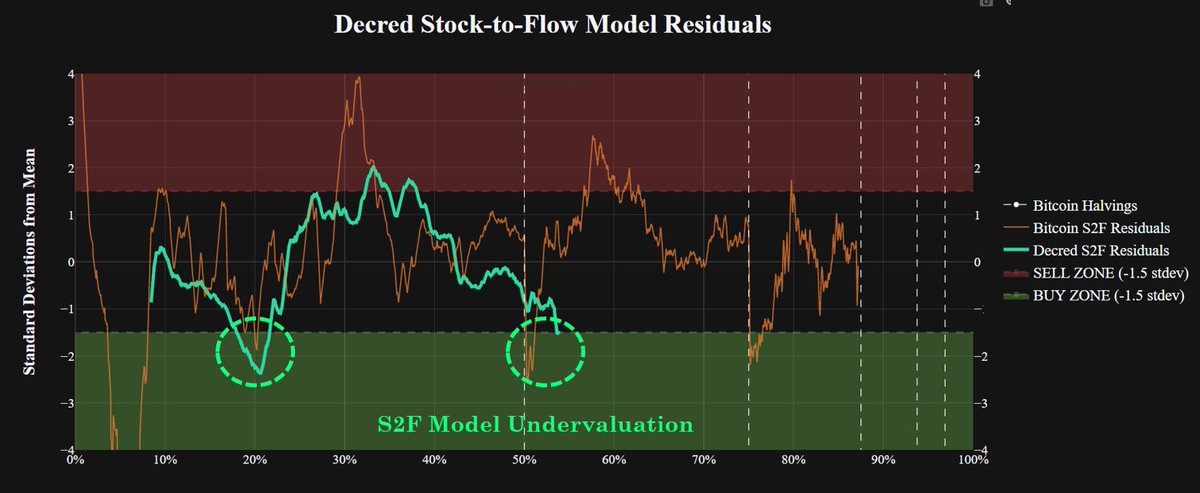
It provides a probability of mean reversion.
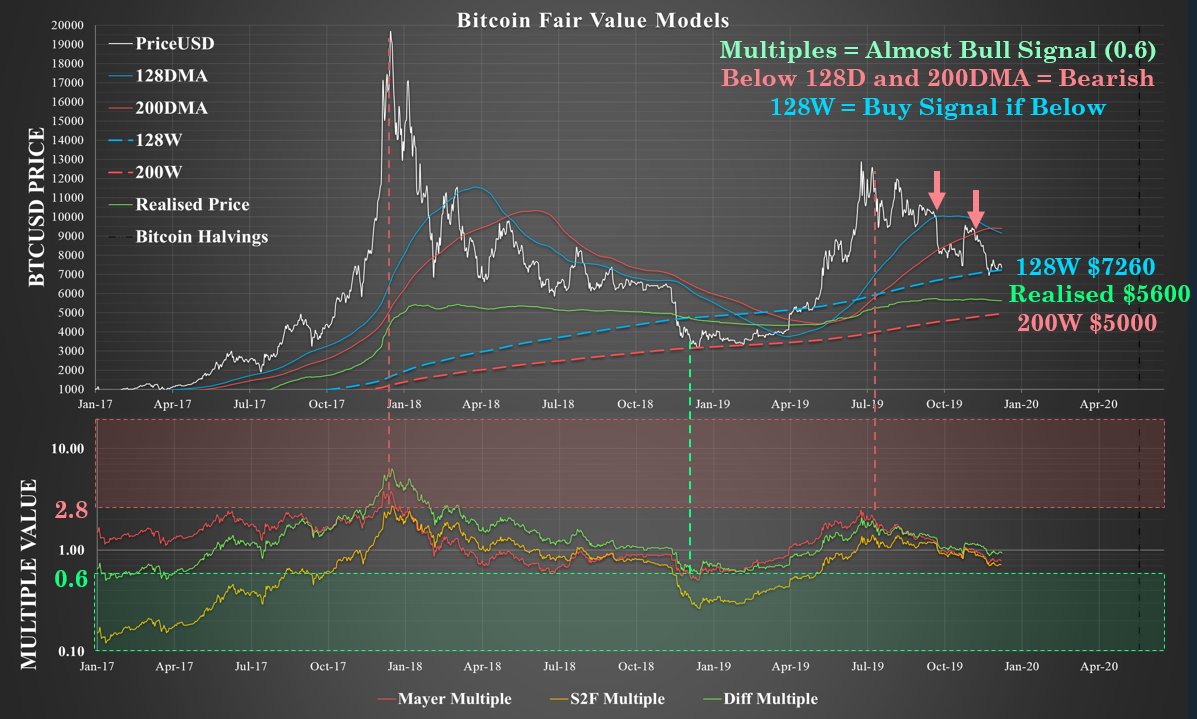
Mayer Multiple values <= 0.5 have been historical low pivot points and we have just seen a strong bounce off this level after Mar 12.
5/
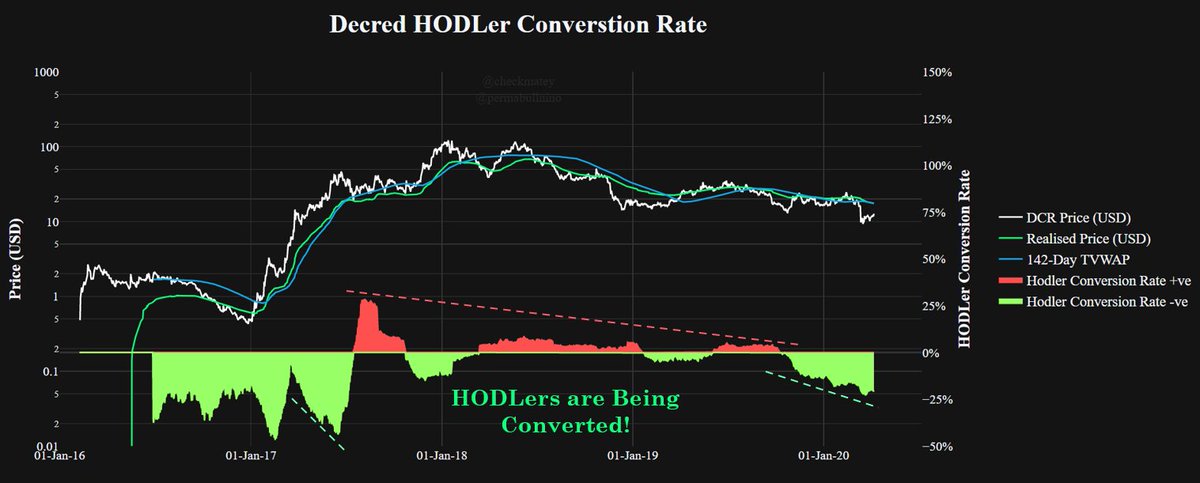
This metric shows the momentum behind HODLers switching from marginal buyers and sellers to long term ticket holders.
As you can see, we are converting the accumulators at increasing speed.
7/
Not only are we in a strong uptrend, we are now in ATH territory, eclipsing the 2017 Bull Run activity.
8/
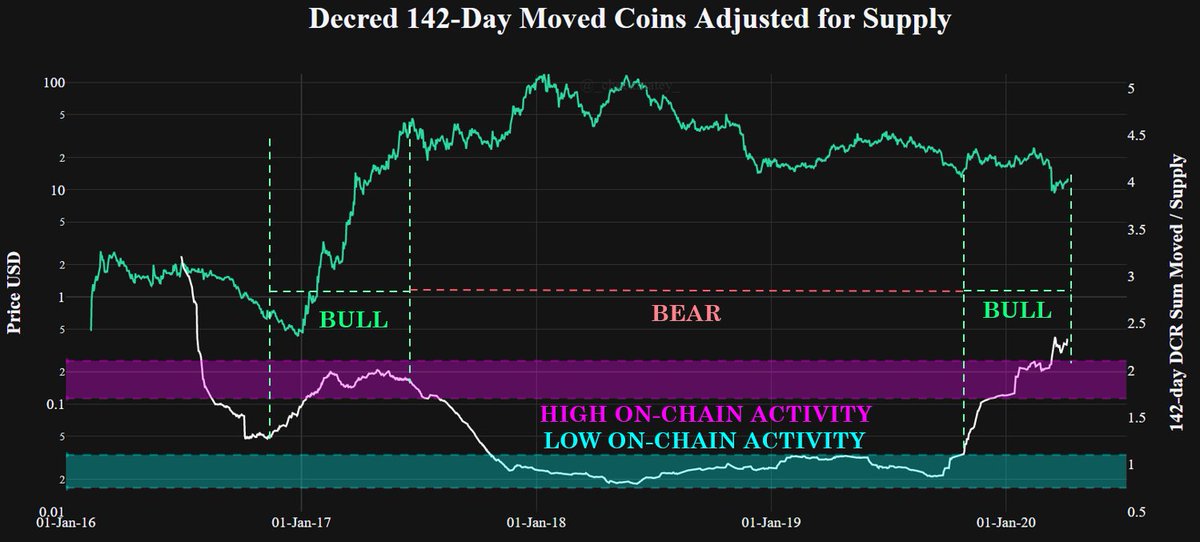
At it's core, #Decred is a fully transparent ledger, it is always telling us what is going on.
When this many metrics align signalling accumulation, it is the time to pay attention.

