
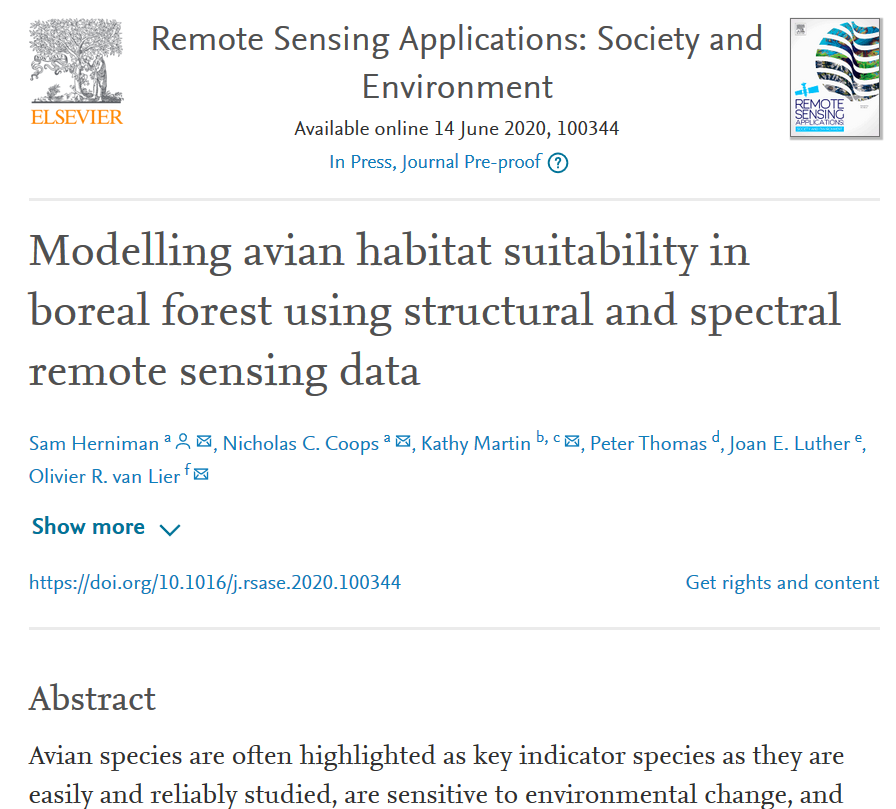
📢 NEW PAPER! #PaperThread #SciComm
Master’s student @samherniman recently published an article about avian habitat suitability in Remote Sensing Applications: Society and Environment. Sam has written this thread summarizing his findings...
📖: doi.org/10.1016/j.rsas…
🧵:1/18
Master’s student @samherniman recently published an article about avian habitat suitability in Remote Sensing Applications: Society and Environment. Sam has written this thread summarizing his findings...
📖: doi.org/10.1016/j.rsas…
🧵:1/18
In general, when a habitat has more #birds, it also has more of all living things. In scientific terms, we say that birds are good surrogates or indicators of #biodiversity.
2/18
2/18
This is excellent, because counting birds is really easy. Many of them sing or call. So, we can do a field survey of birds in a habitat and use that number to find a relative count of all biodiversity.
more birdsong ≈ more birds ≈ more biodiversity
🦉🌲🐦🌳🦅
🐿️🪱🍂🍄🕷
3/18
more birdsong ≈ more birds ≈ more biodiversity
🦉🌲🐦🌳🦅
🐿️🪱🍂🍄🕷
3/18
We can correlate those counts with environmental data to model bird #HabitatSuitability and to generate maps of predicted biodiversity. Collecting environmental data can be done using several different methods (field collection, airborne laser scanning, multispectral etc.)
4/18
4/18
The goal of this paper was to explore which of these environmental data types were most useful when modelling bird habitat suitability in an area of Newfoundland
#ResearchGoal #ResearchPaper
5/18
#ResearchGoal #ResearchPaper
5/18
We looked at 5 different categories which were meant to represent the types of environmental data available to land managers:
1⃣ Field plot (FP) - data available through field surveys (like basal area and the percent of the stand that is hardwood species)
6/18
1⃣ Field plot (FP) - data available through field surveys (like basal area and the percent of the stand that is hardwood species)
6/18
2⃣ Spectral (S) - data comes from earth observing #Satellites collecting #multispectral data
3⃣ Spectral, landscape & topographic (S+TLC) - the spectral category with some extra data like the distance to the edge of the forest and mean annual precipitation
7/18
3⃣ Spectral, landscape & topographic (S+TLC) - the spectral category with some extra data like the distance to the edge of the forest and mean annual precipitation
7/18
4⃣ Airborne laser scanning (#ALS)- metrics from ALS
5⃣ Combined spatial layers (CSL) - all the variables that are spatially continuous (everything except the field plot group)
8/18
5⃣ Combined spatial layers (CSL) - all the variables that are spatially continuous (everything except the field plot group)
8/18
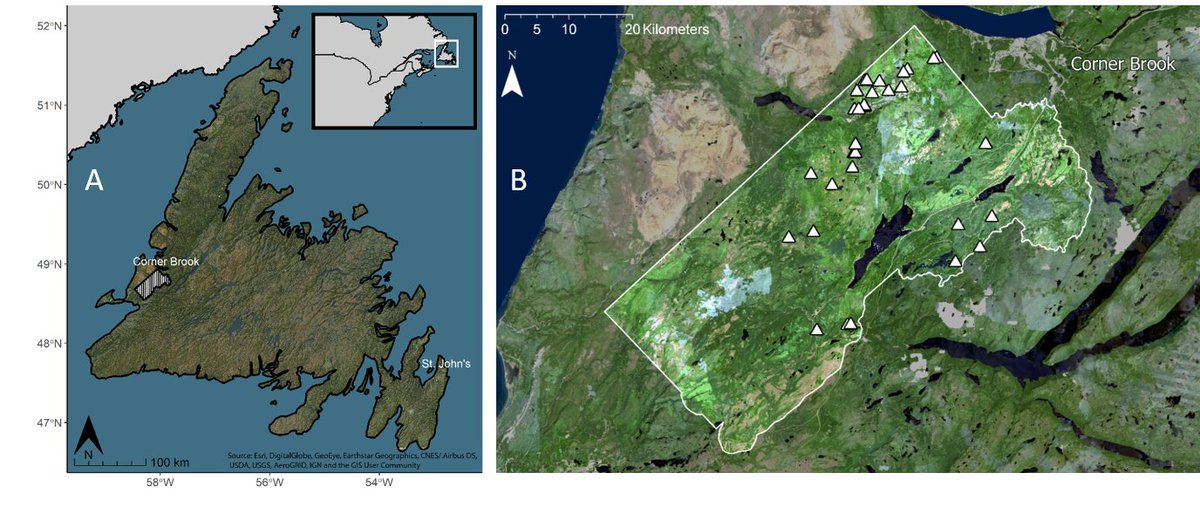
We conducted 29 point counts in an area of western Newfoundland called the Harry’s River Watershed in the summer of 2017. Here’s a map of where the points were located - created with #rstats, #rayshader, and #landsat images
9/18
9/18
Then we used a process called best subset regression to find the best combination of predictor variables within each of the data categories described above to model presence-absence and abundance for each species we saw
10/18
10/18
We compared the distribution of the goodness of fit (by normalized RMSE) of the best significant species models
11/18
11/18
In the case of the presence-absence models: there were no significant spectral models, so they aren’t included. This means that the spectral metrics we used were not sufficient without using other types of data.
12/18
12/18

Also, the average field plot (FP) model was better than the spectral, landscape & topographic (S+TLC) and ALS models but the average combined spatial layers (CSL) model was better than field plot
13/18
13/18
For abundance models we see similar things: spectral (S) and spectral, landscape & topographic (S+TLC) have worse normalized RMSE than field plot, ALS, and combined spatial layers (CSL). CSL had the best models
14/18
14/18

Essentially, this means that if a land manager can only collect one type of data, they should collect field data. But if they have the budget for #ALS, its worth it to use that and other #RemoteSensing or spatial datasets
#LandManagment #biodiversity
15/18
#LandManagment #biodiversity
15/18
One of the advantages of using spatial datasets is that wall-to-wall predictions of habitat suitability can be made - something we cannot do with field data
16 /18
16 /18
Here are predictions for 3 species, blackpoll warbler (BLPW), black-throated green warbler (BTNW) and ovenbird (OVEN)
17/18
17/18

You can read the article here: authors.elsevier.com/a/1bGVX8M-mmha…
Or feel free to contact @samherniman if you don’t have access.
18/18
Or feel free to contact @samherniman if you don’t have access.
18/18

