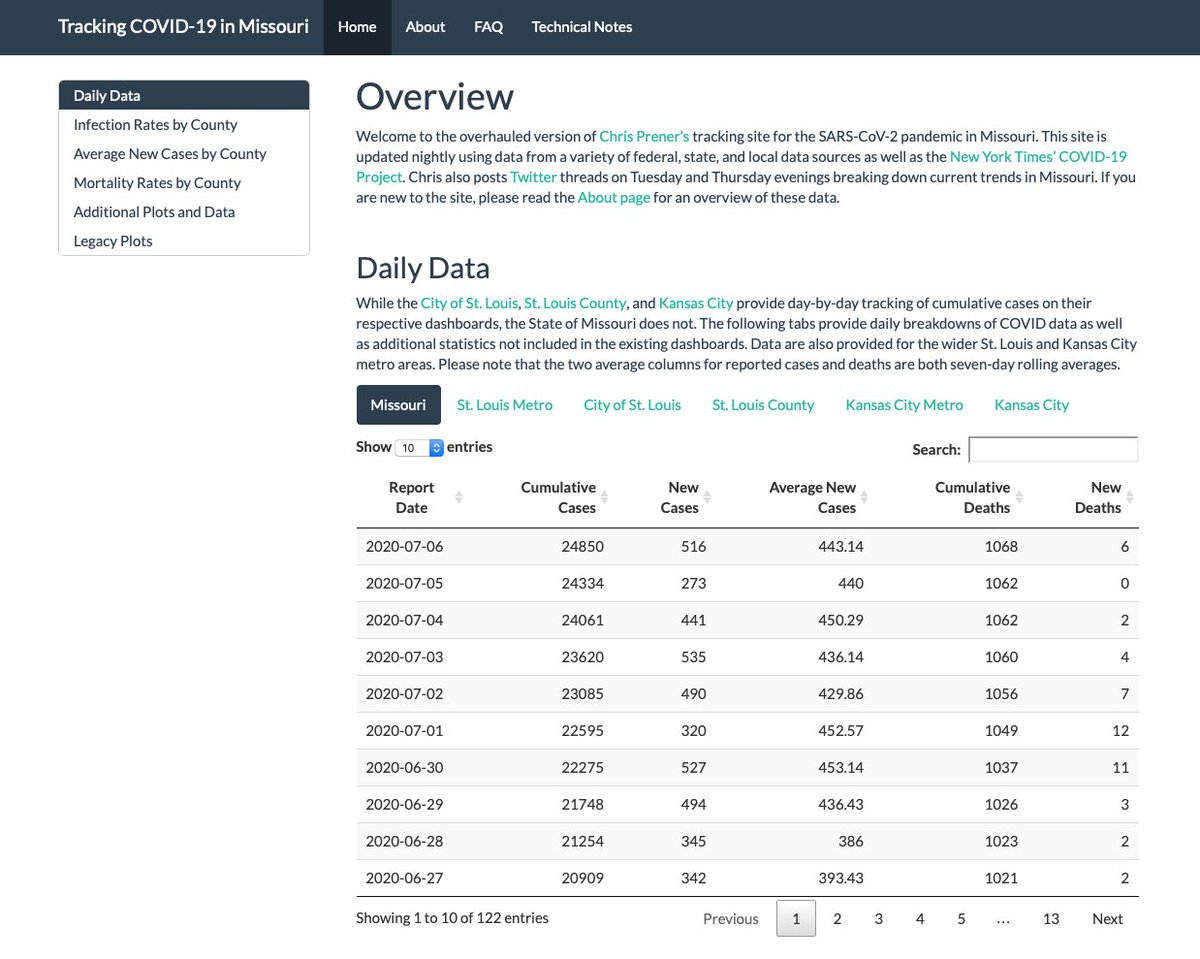
Long #Missouri #COVID19 evening update 🧵 for Thursday, 7/7. I’ve pushed updates to all metrics to the website - slu-opengis.github.io/covid_daily_vi….
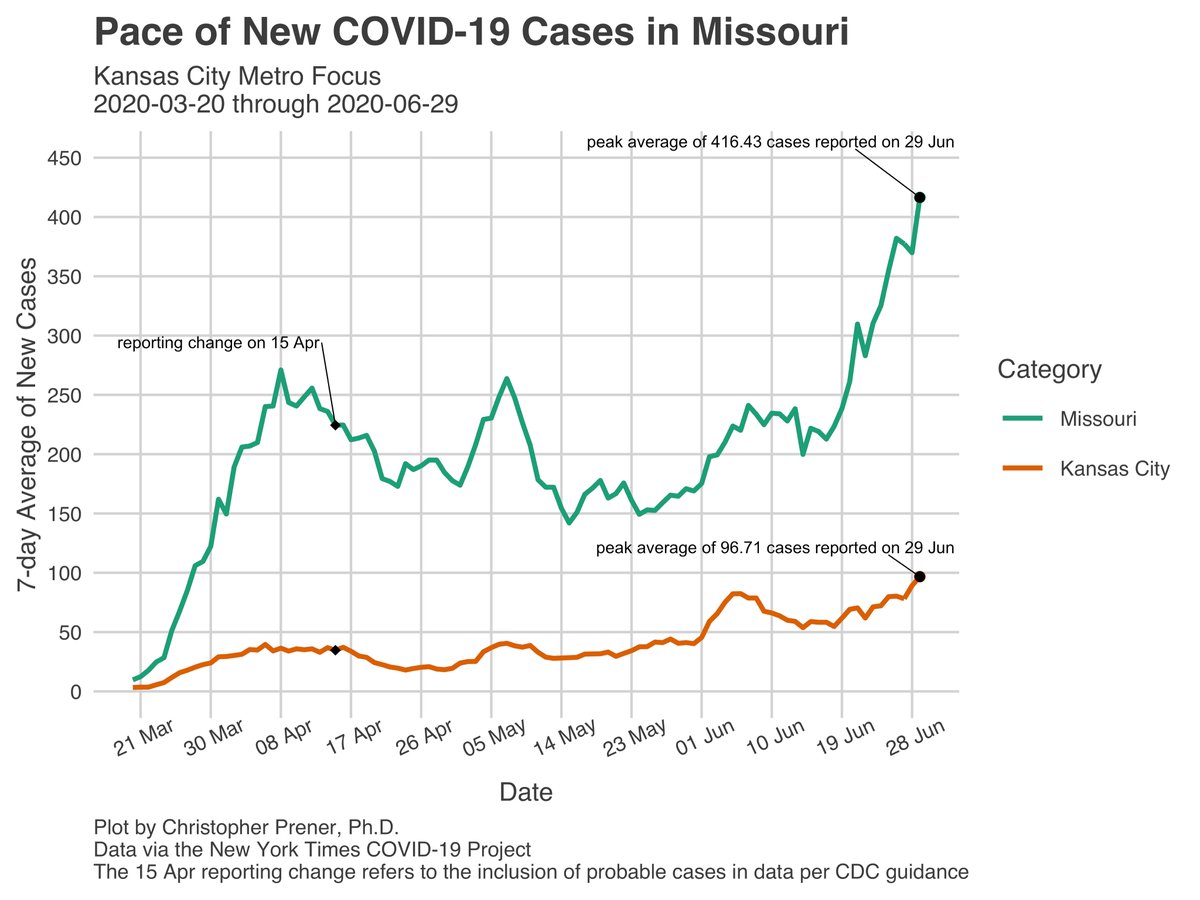
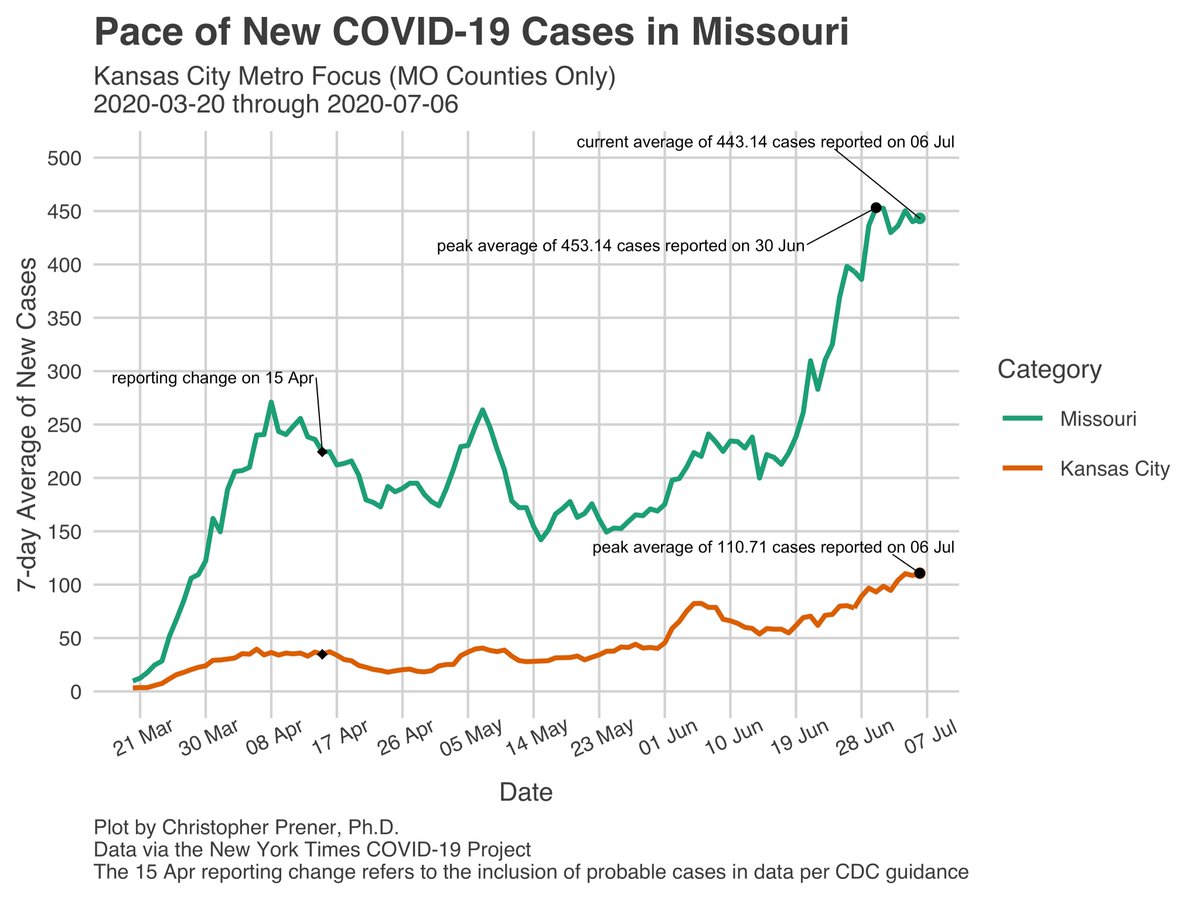
The statewide 7-day average is basically unchanged, though the #KansasCity average hit another new peak value yesterday. 1/19
The statewide 7-day average is basically unchanged, though the #KansasCity average hit another new peak value yesterday. 1/19
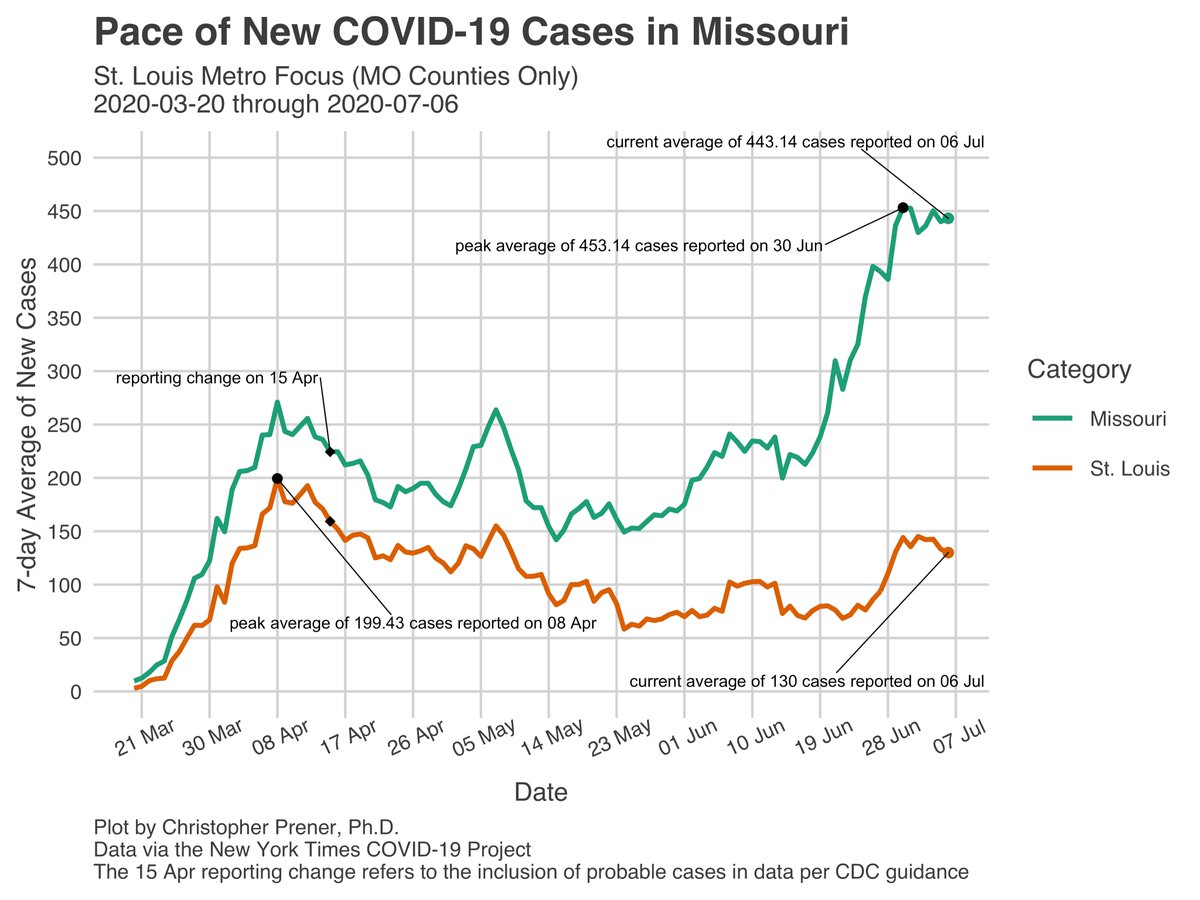
Expect this status quo to change tomorrow, as we absorb the 773 new cases in today’s DHSS release (which aren’t in my data tonight). @erinheff's reporting for @stltoday indicates that the state believes that this a backlog due to the holiday weekend. 2/19 stltoday.com/lifestyles/hea…
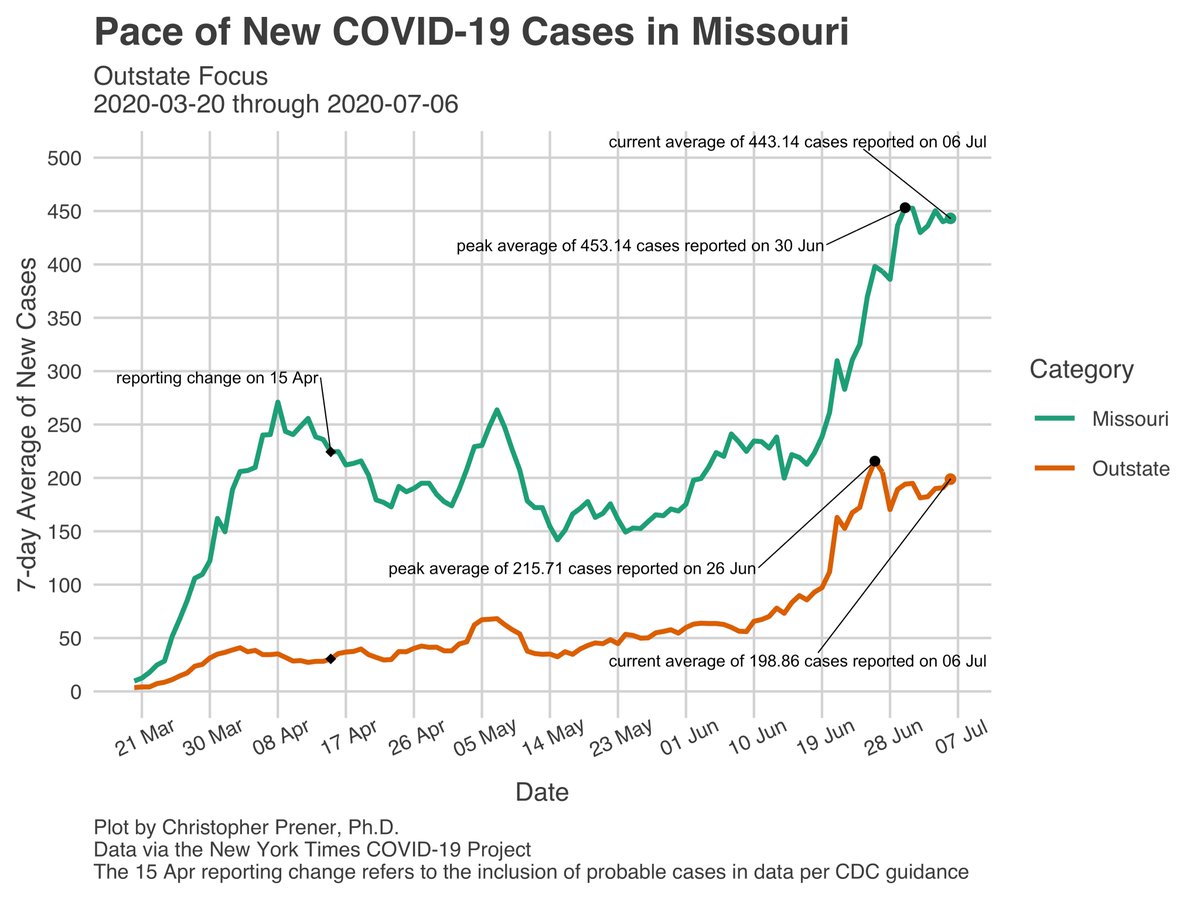
What matters more than our single day values is the trend - this may indeed be an outlier day in terms of raw numbers, but we’ll have to see what the next week brings in terms of new cases. 3/19
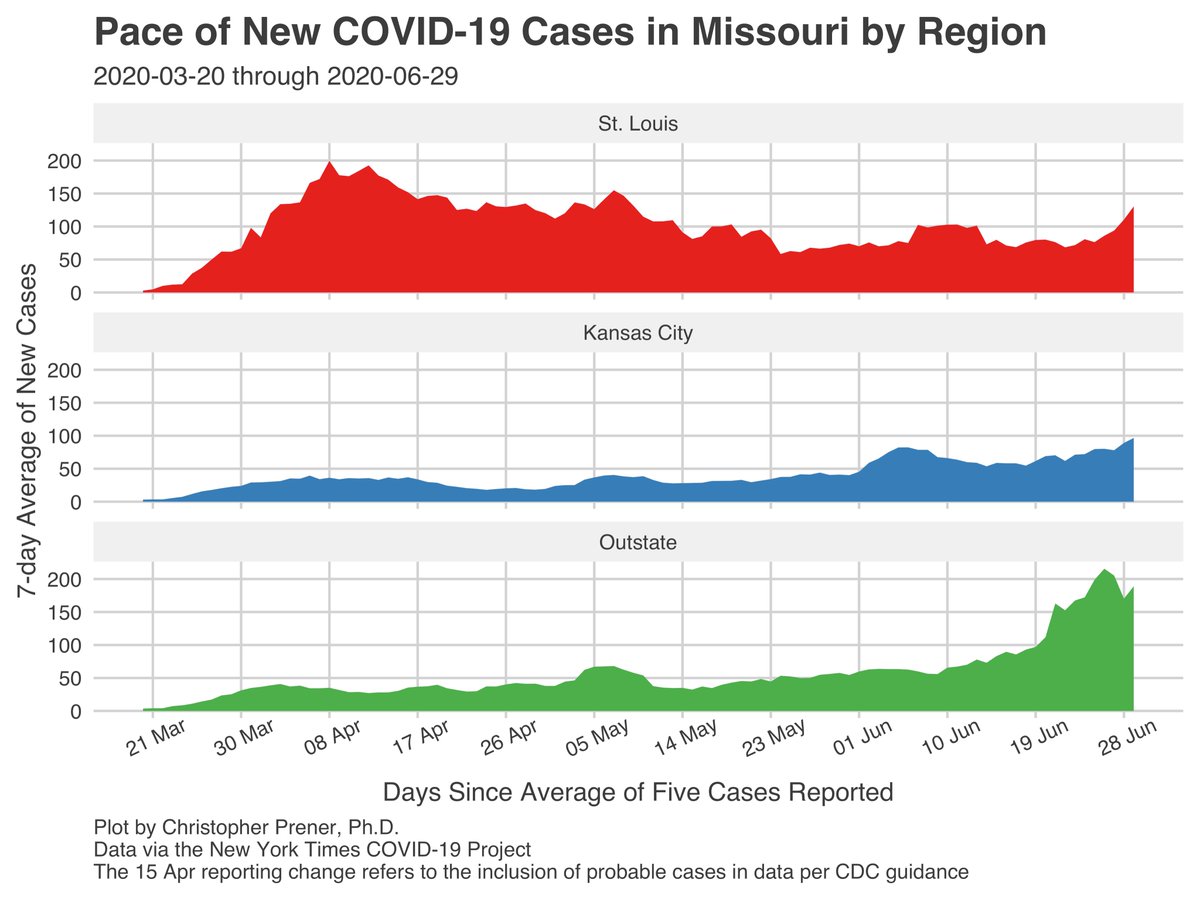
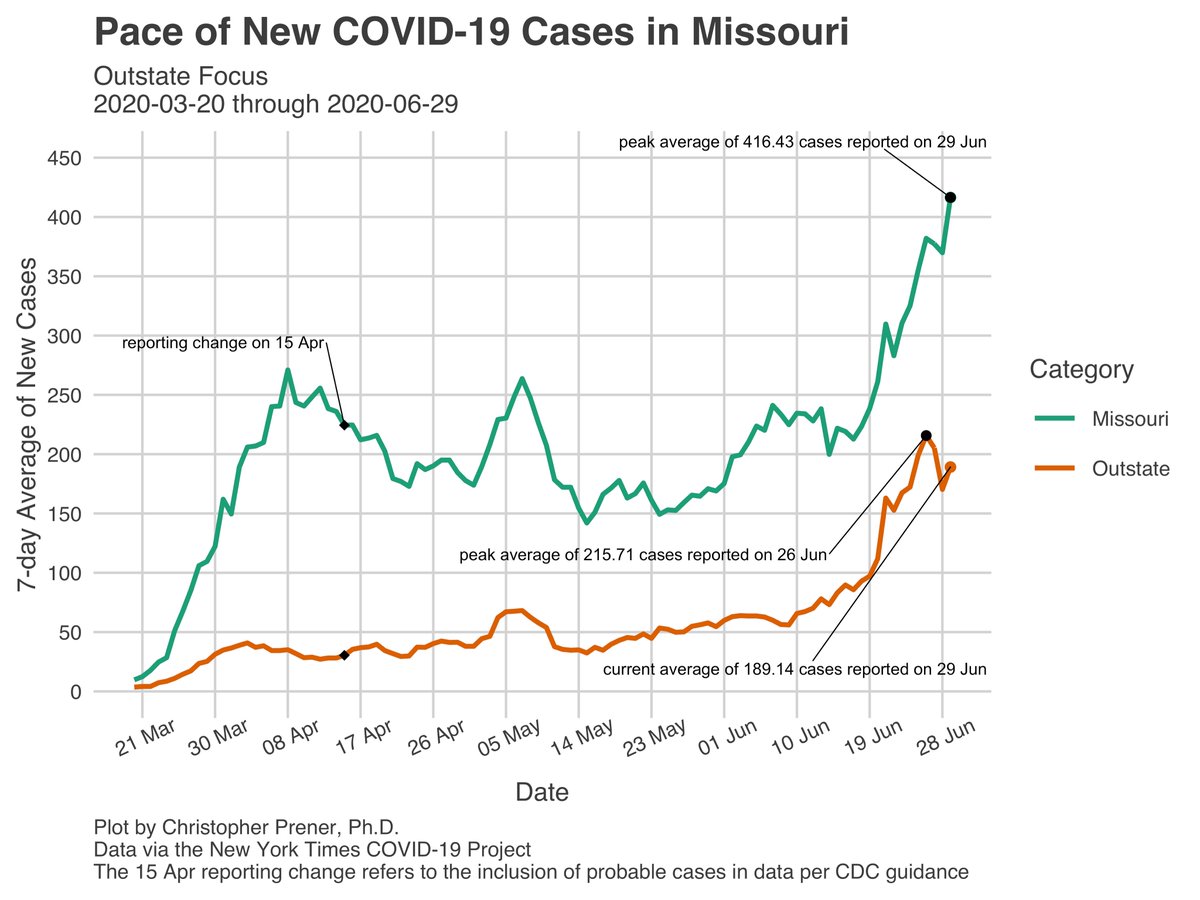
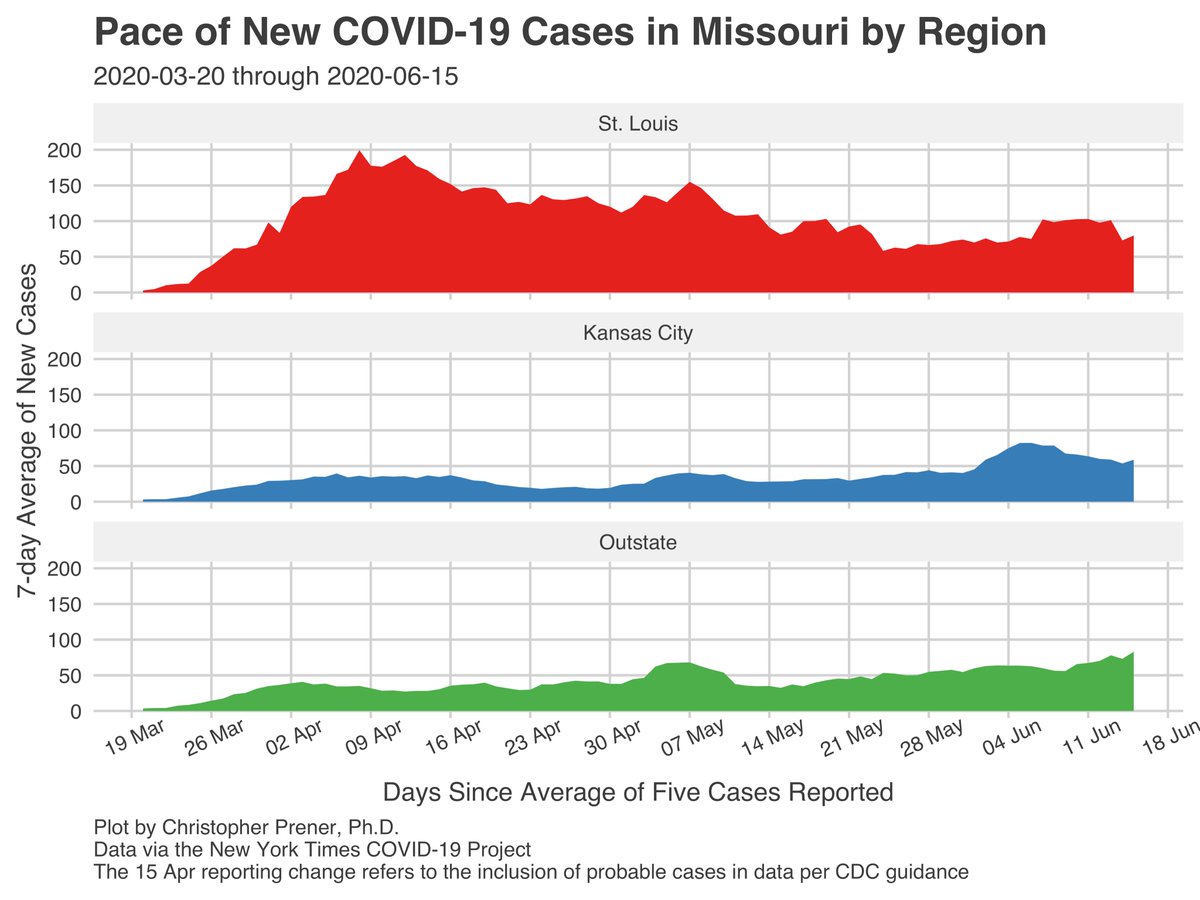
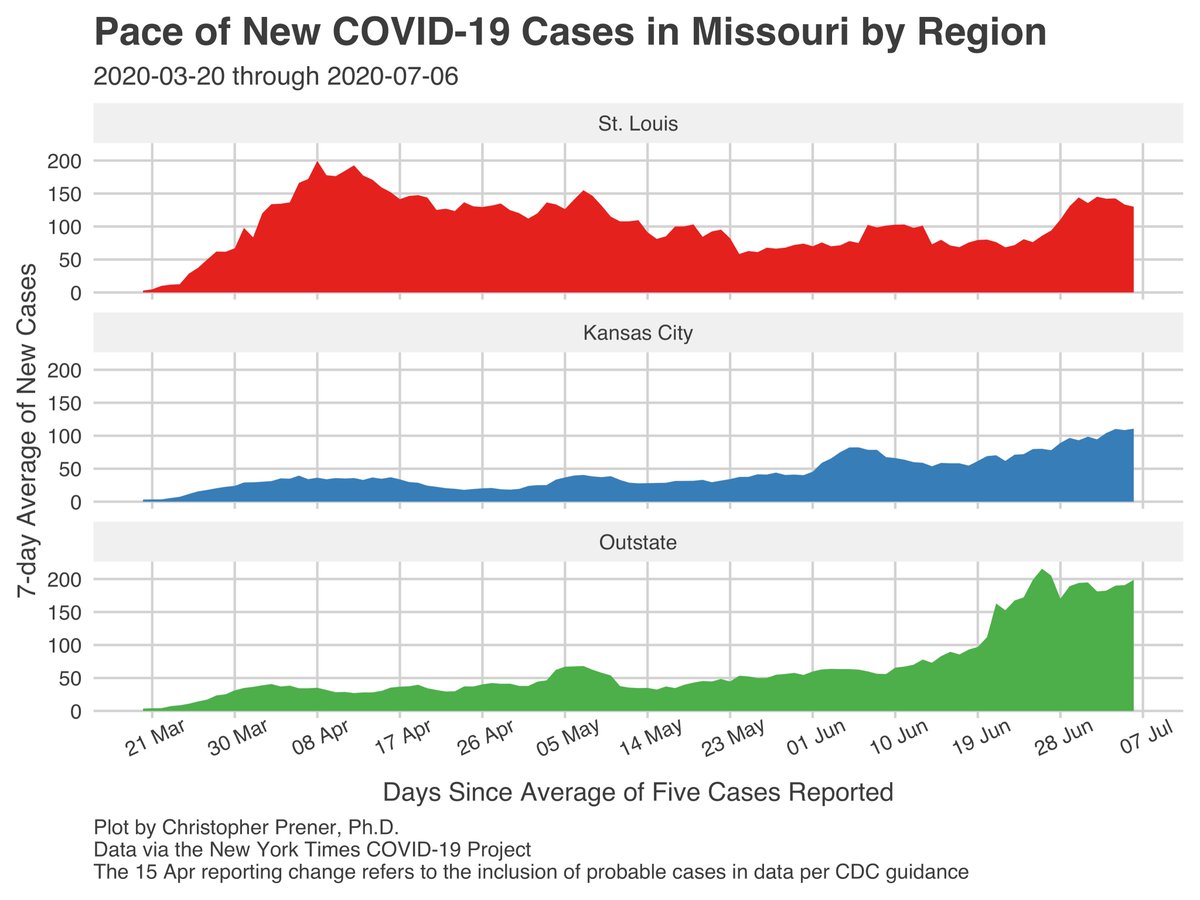
The new cases as of yesterday were spread out widely - we’re seeing growth in new cases in every metro in MO. Joplin now has the highest per capita rate, even without the 798 cases in McDonald County. 7-day averages are elevated for every metro except St. Jo. 4/19


Right now, most of these metros 👆 - Kansas City, Columbia, Springfield, Joplin, Jefferson City, and Cape Girardeau - have their highest average numbers of new cases of the pandemic thus far. 5/19
I mentioned McDonald County 👆👆 - it now has double the per capita rate of Sullivan County in northern MO, the next highest per capita rate county. Also note that Joplin now appears as its own trend line on these plots 👇. 6/19


Greene County 👆 also added a large number of new cases yesterday, 34, which is the highest single day total for the county in my data set. This is why the Springfield metro’s 7-day average has hit a new peak value 👆👆. 7/19
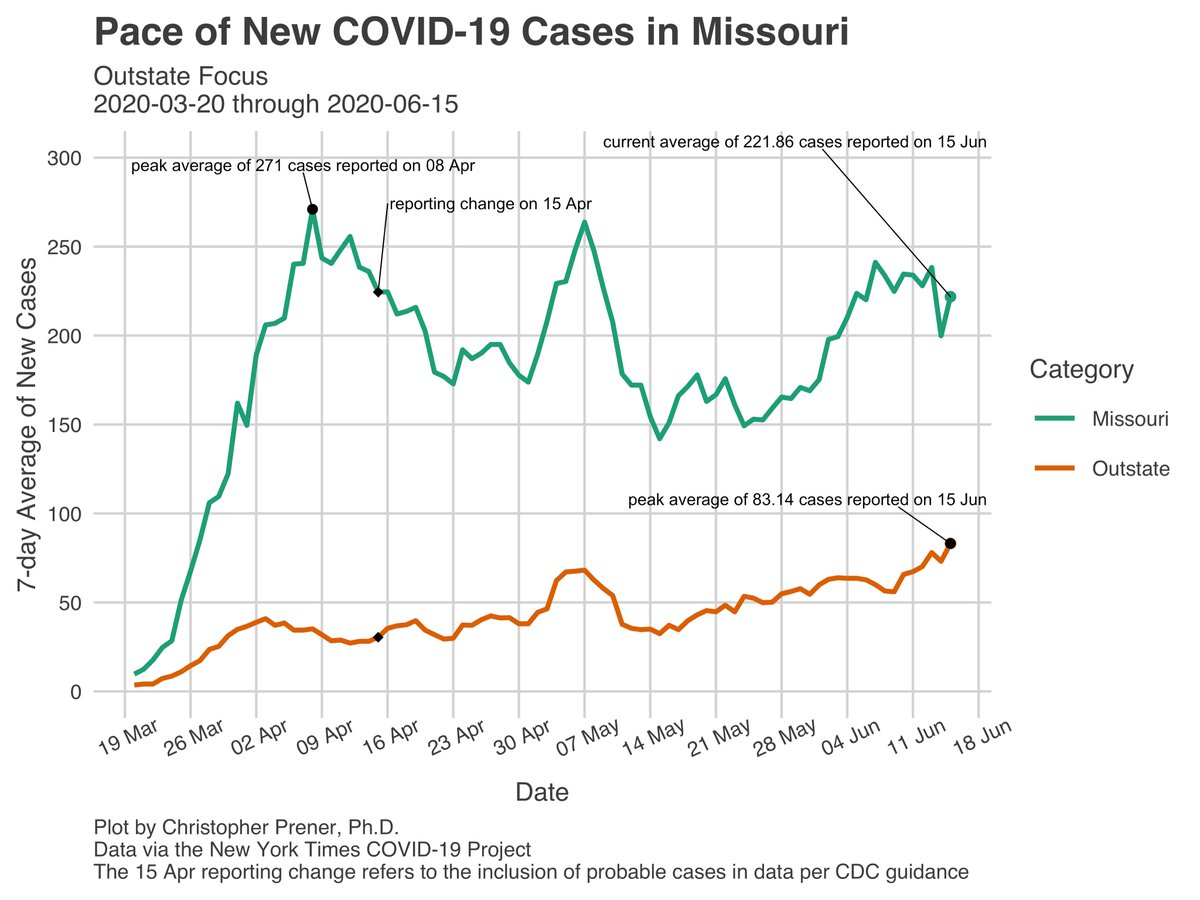
Another area to watch is the Lake of the Ozarks region as we get into mid and late July. Camden County has now doubled its pre-Memorial Day number of cases. These aren’t large numbers, but the growth there since late May has been steady. 8/19


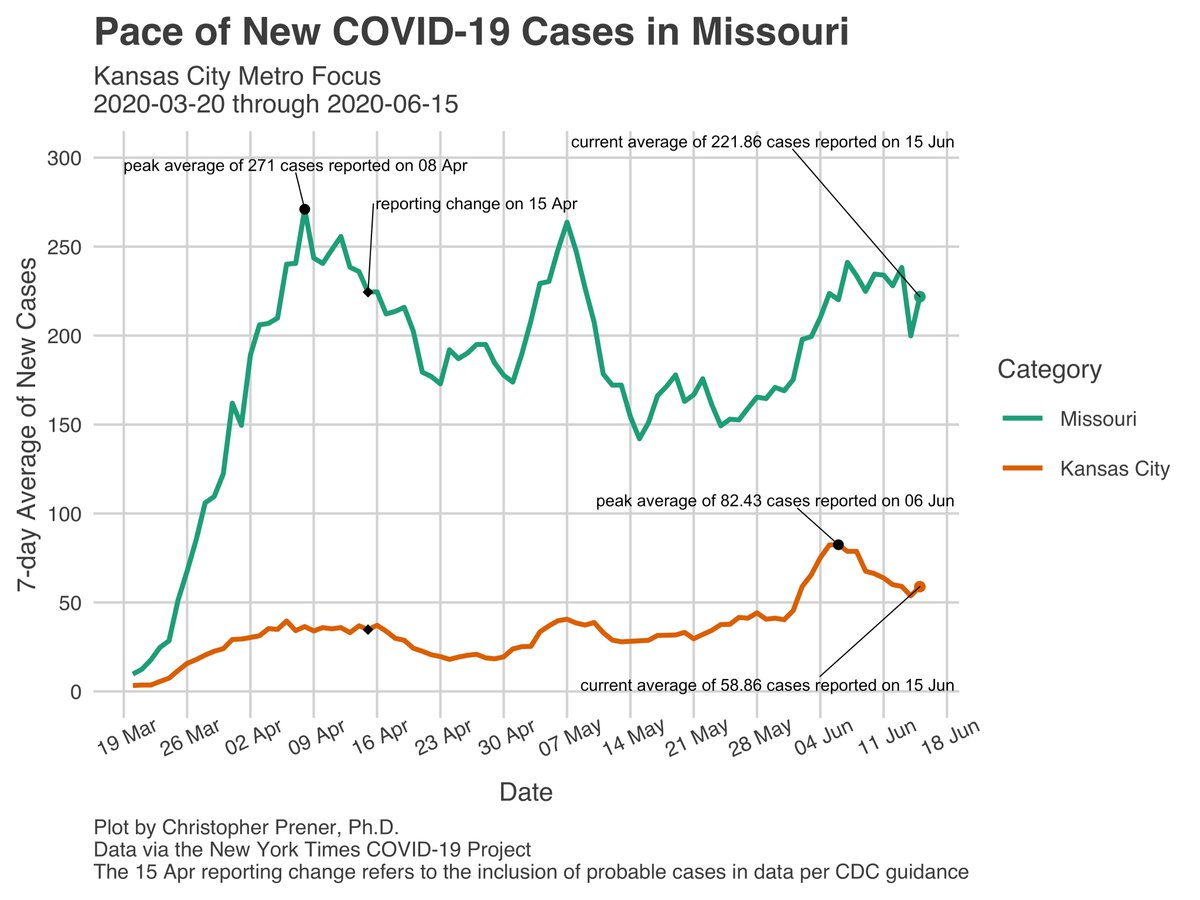
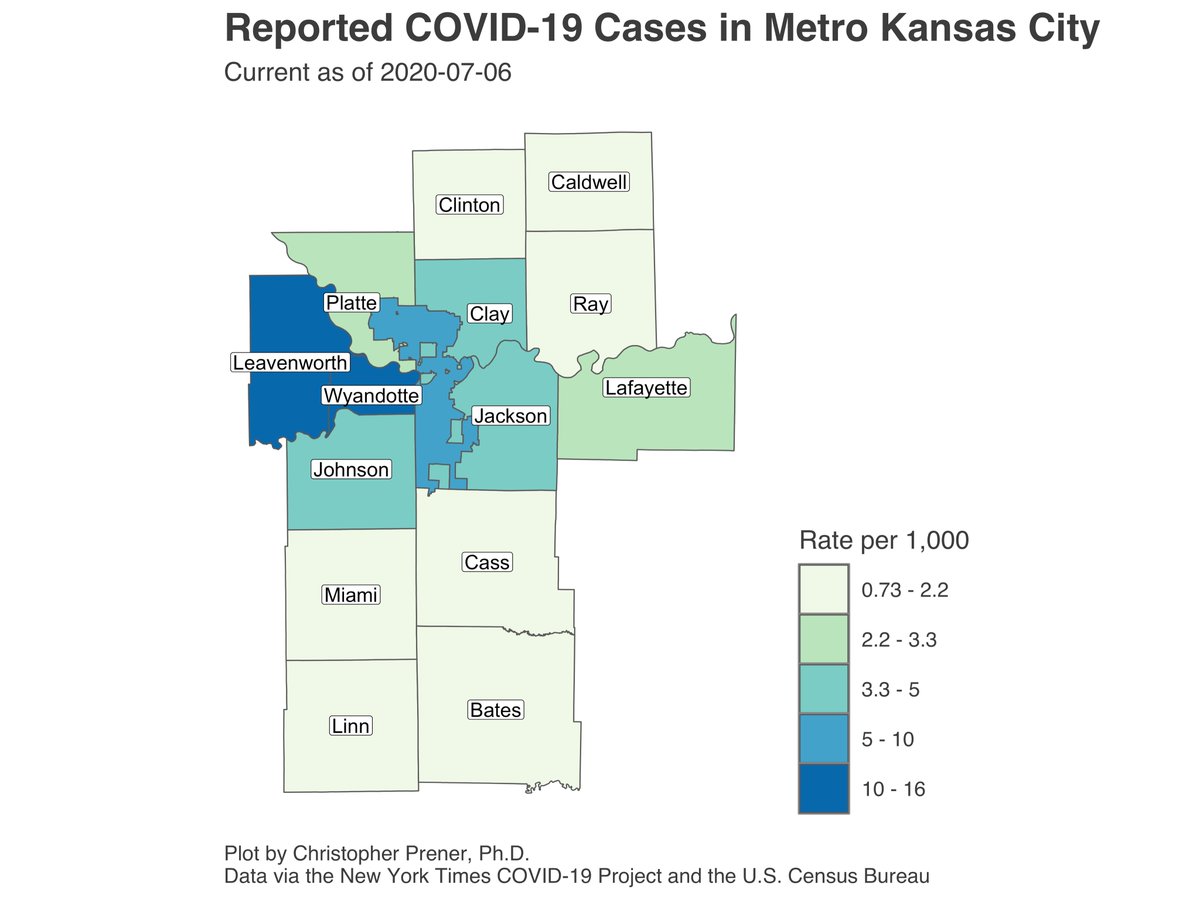
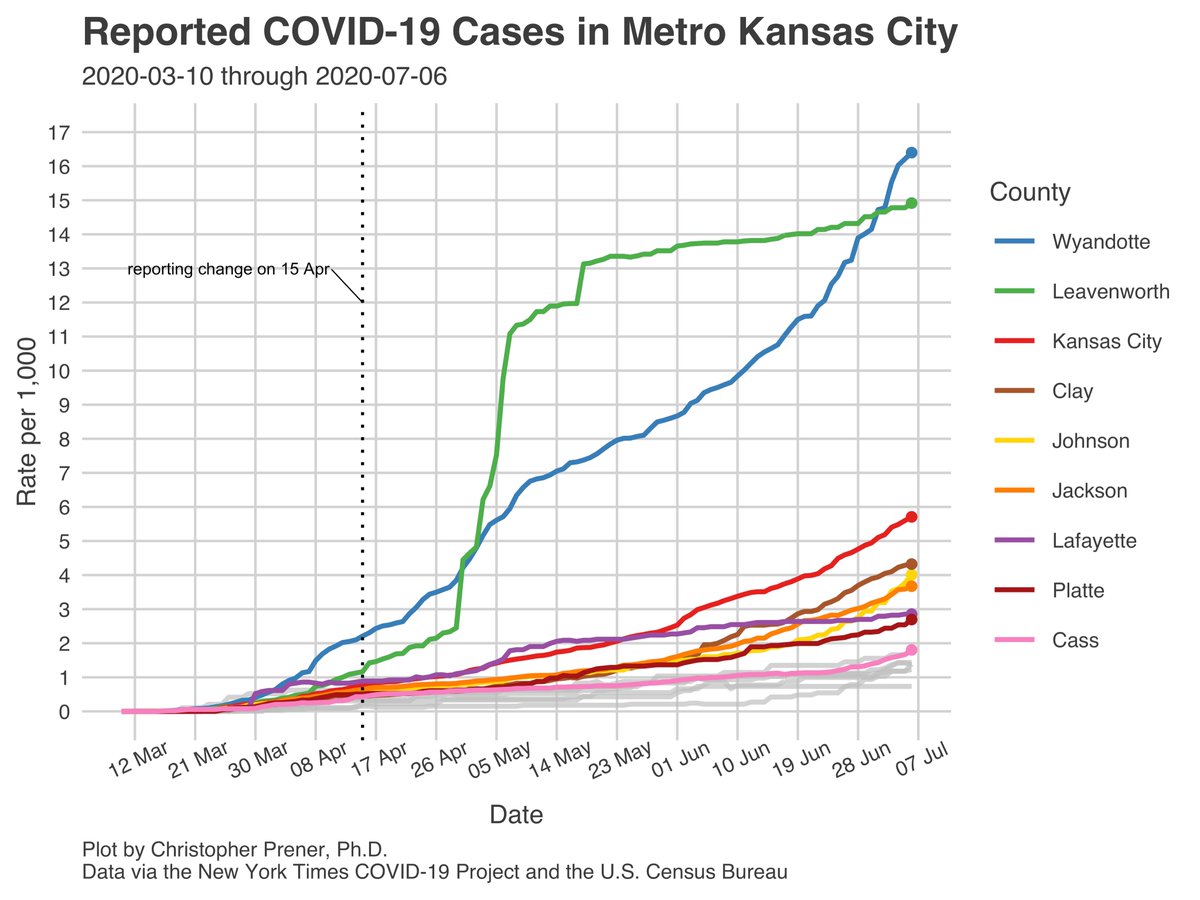
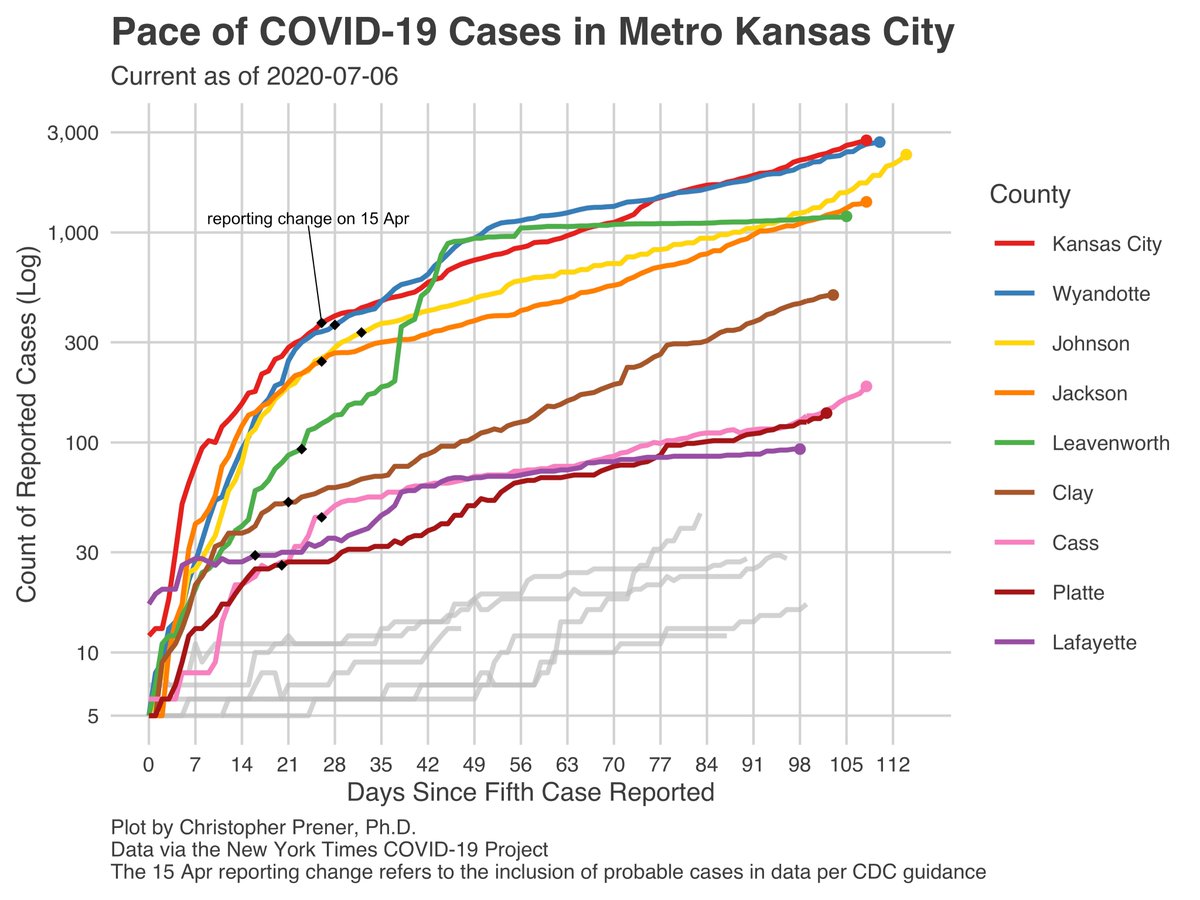
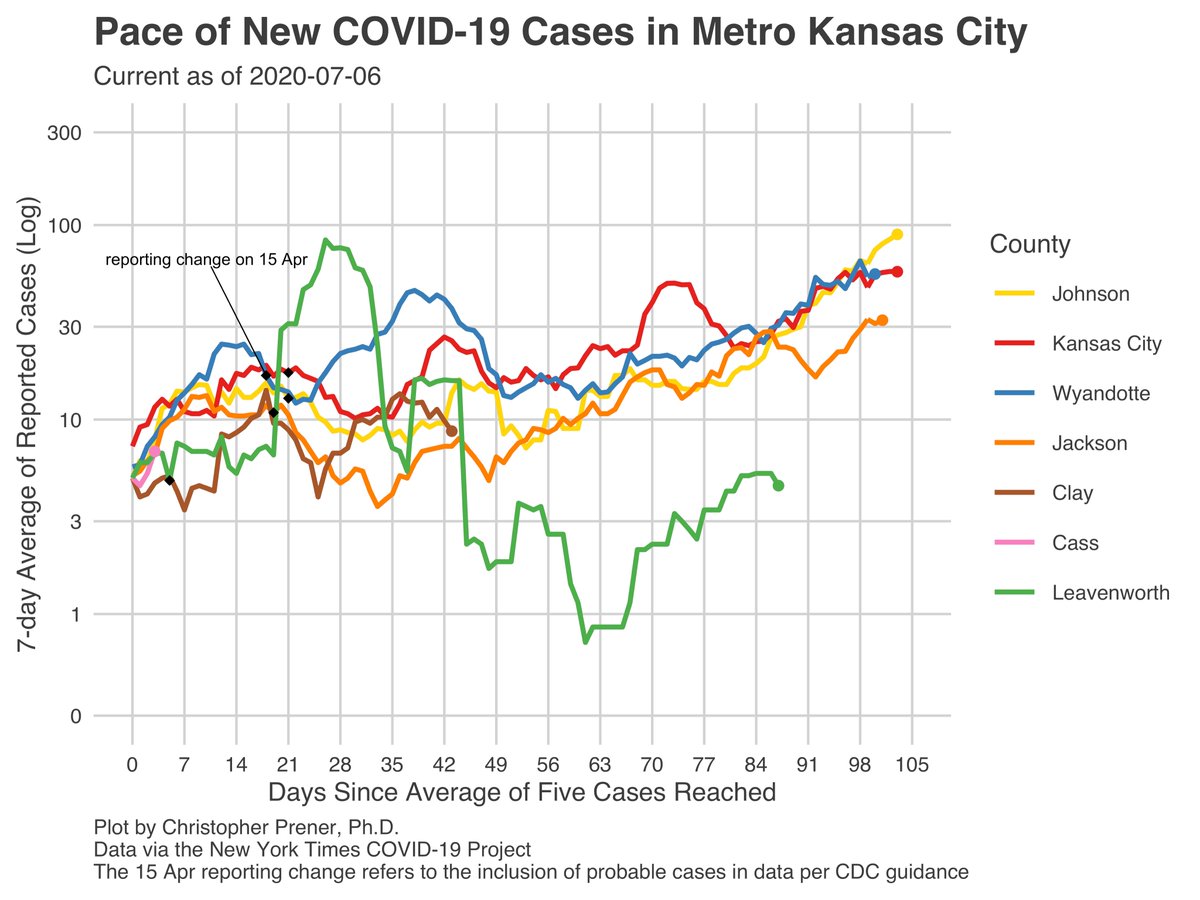
In the #KansasCity metro, the 7-day averages for Johnson, Jackson, Kansas City itself, and Wyandotte Counties are at all time highs. Johnson County is adding nearly 100 new cases per day right now. 9/19
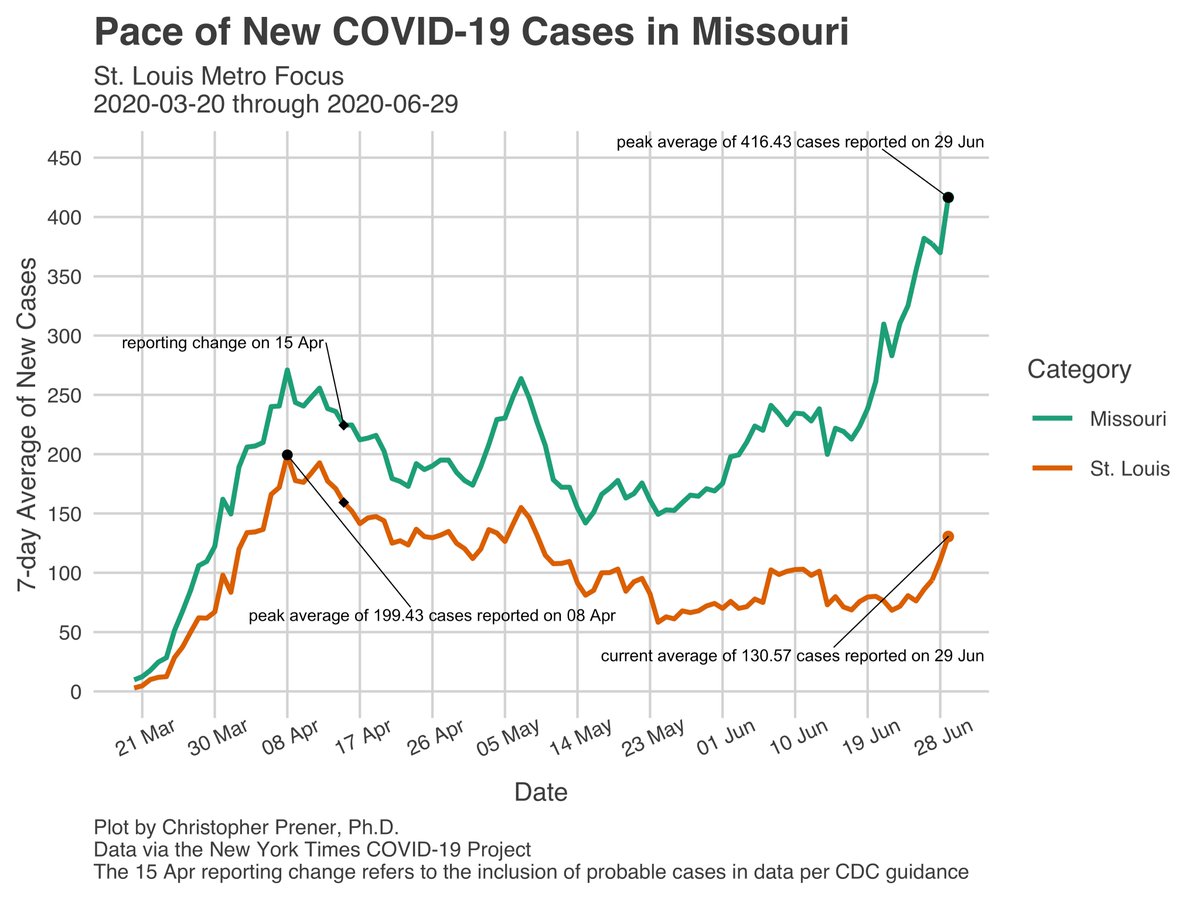
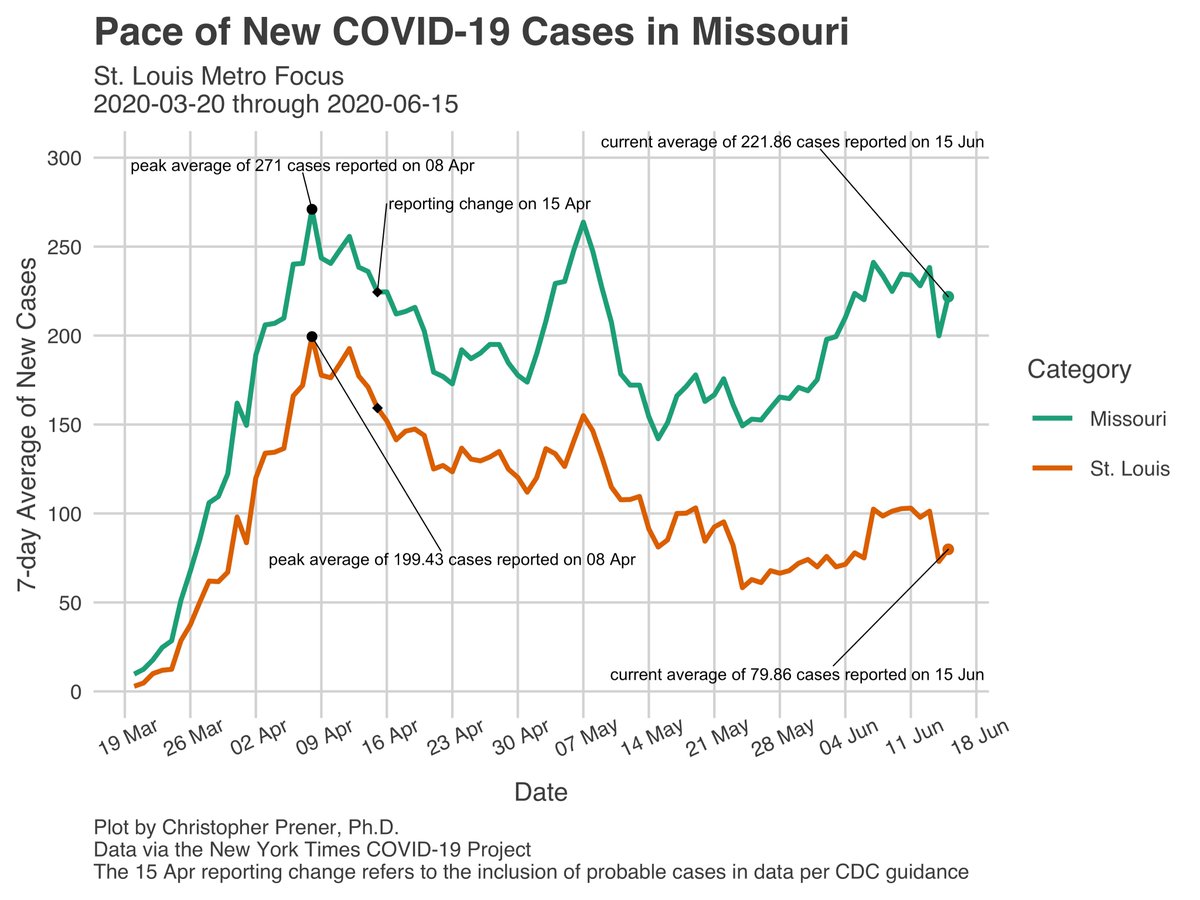
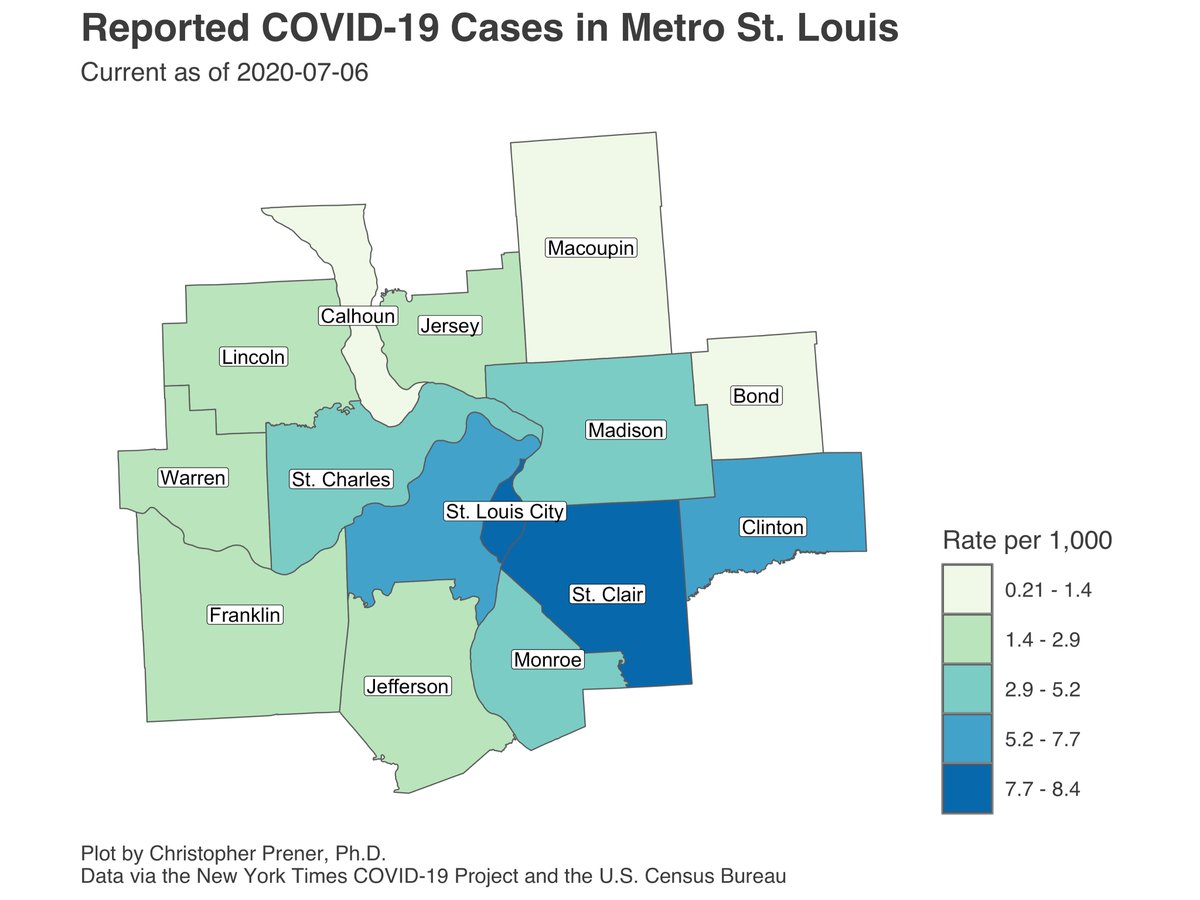
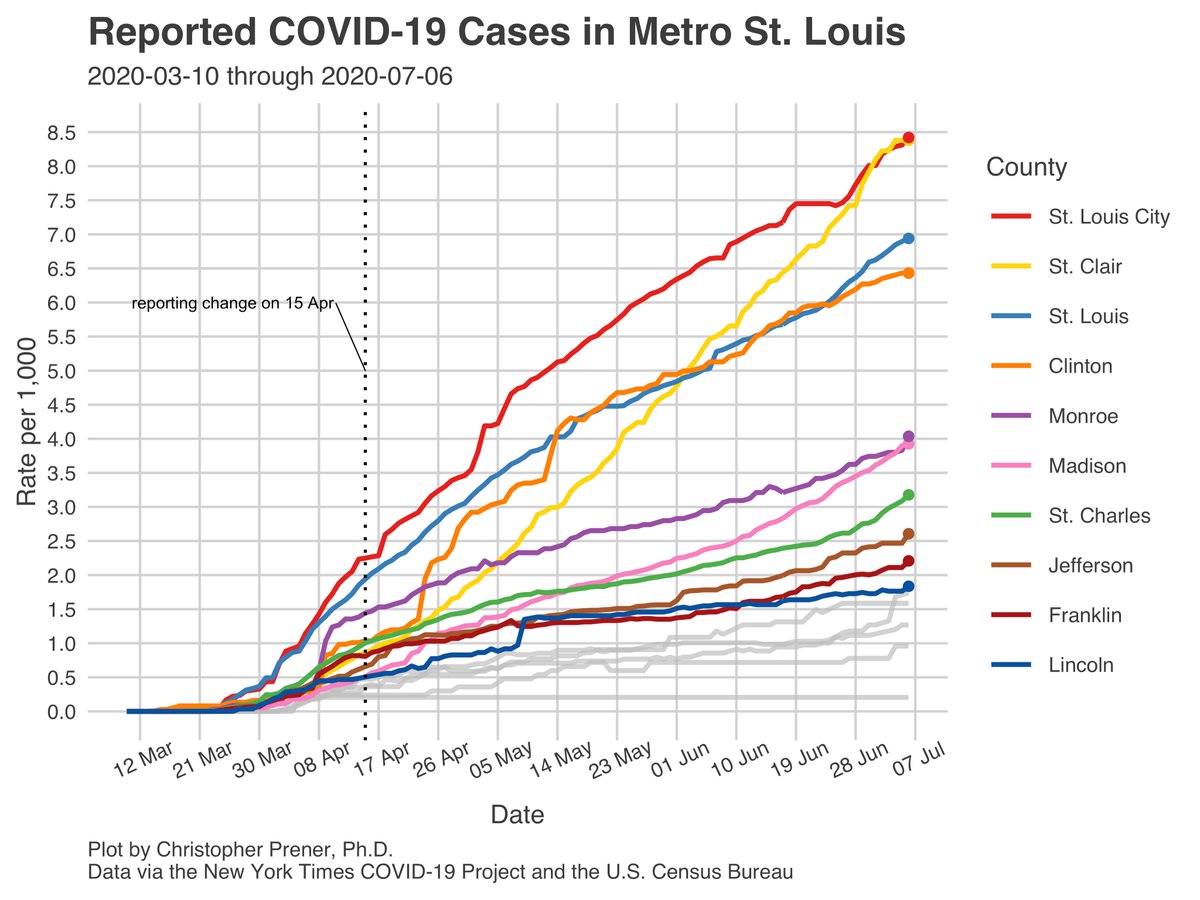
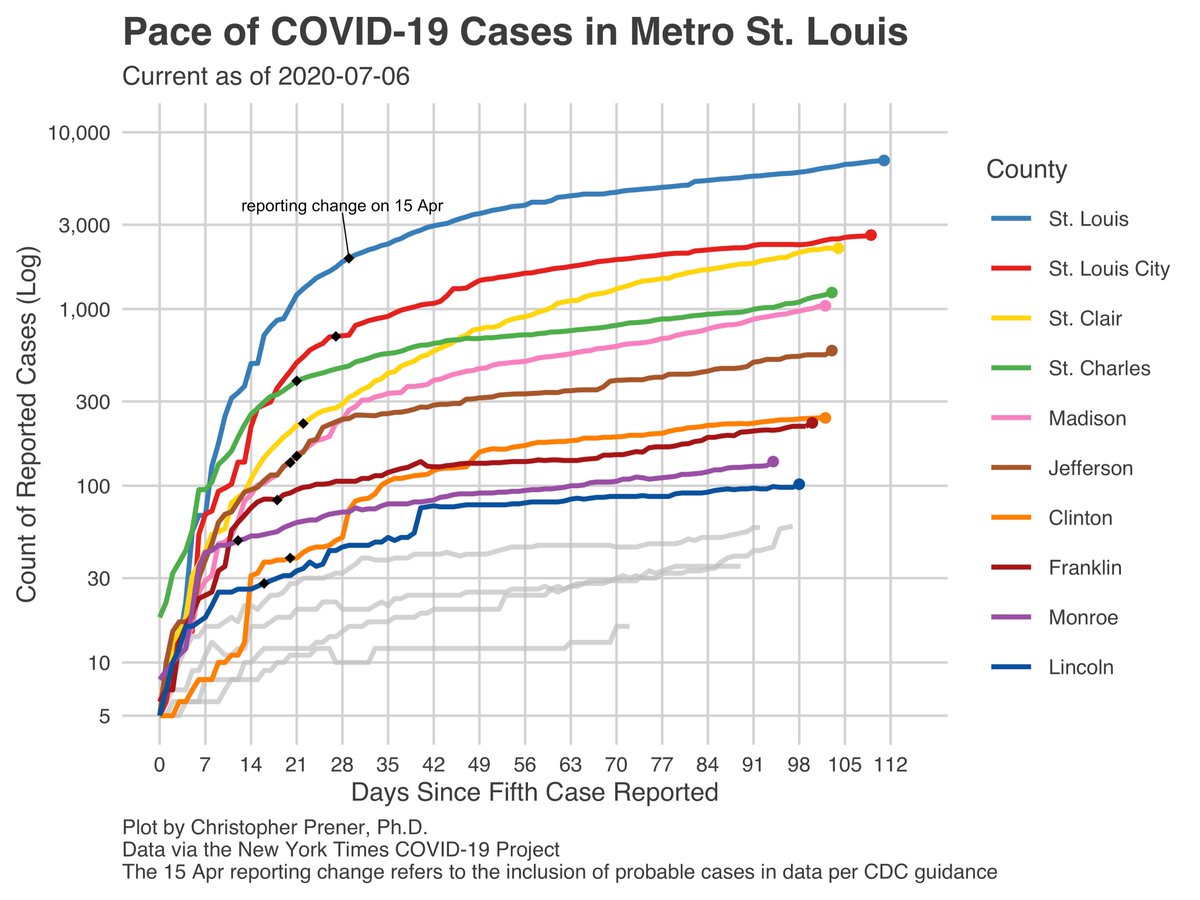
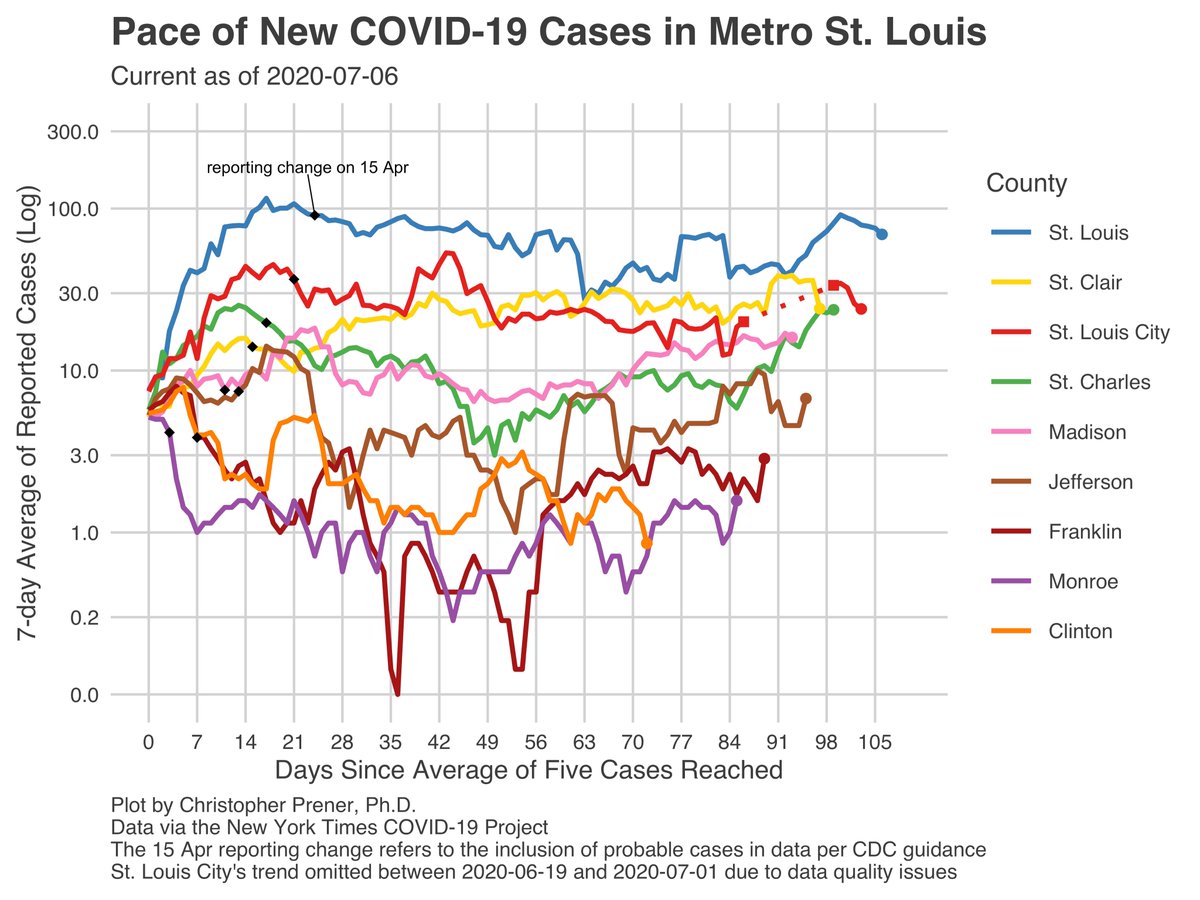
In the #StLouis metro, the 7-day averages are near an all time high in St. Charles and Madison counties, but have fallen in both the City and the County. These drops have been over several days, as has the drop in St. Clair County’s rate of new cases. 10/19
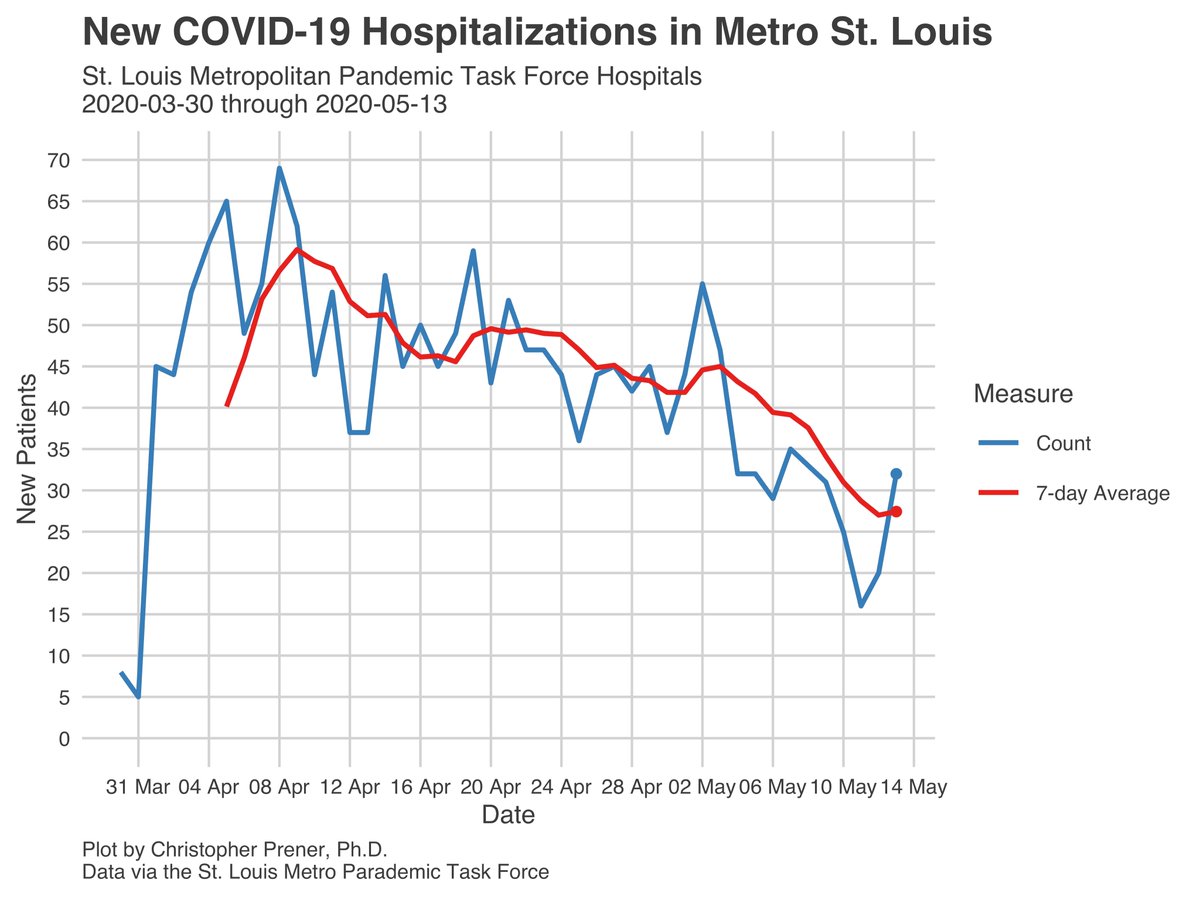
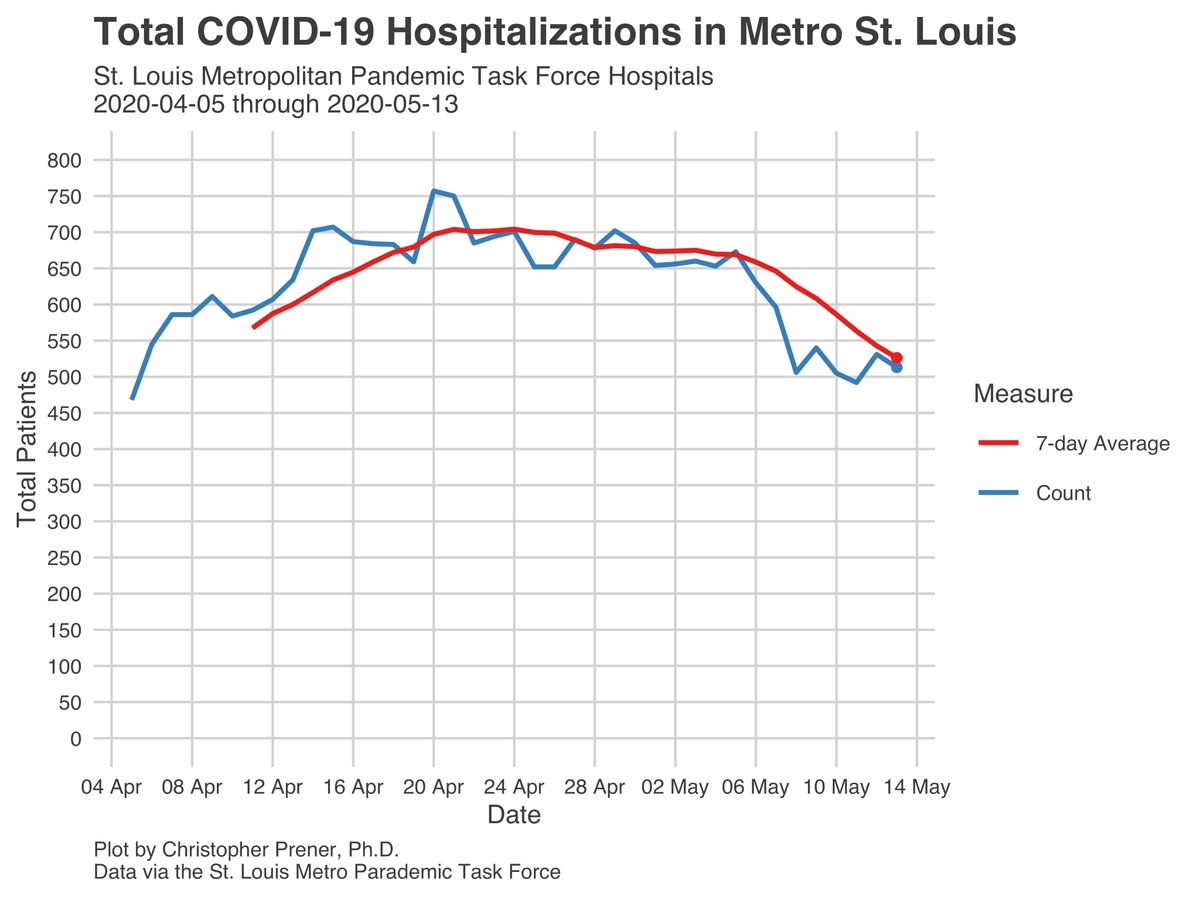
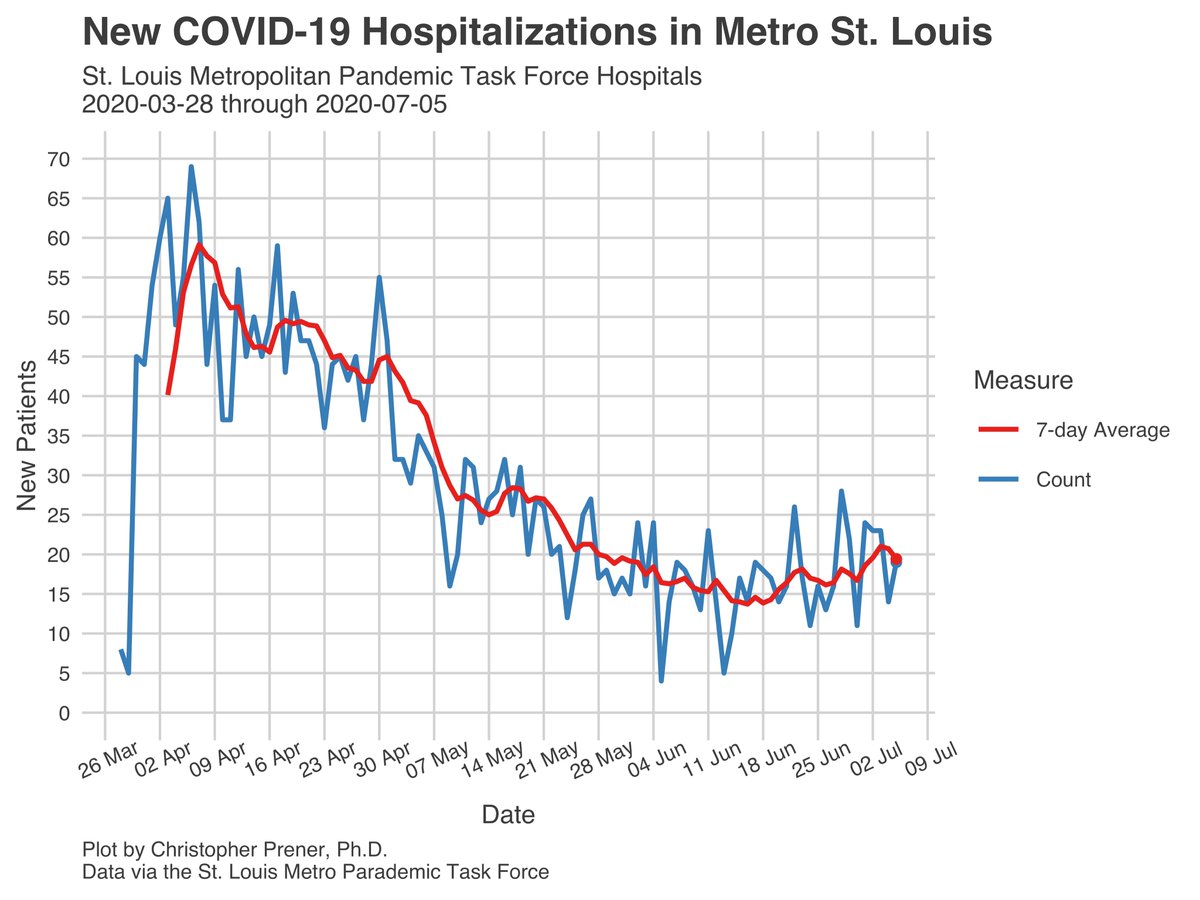
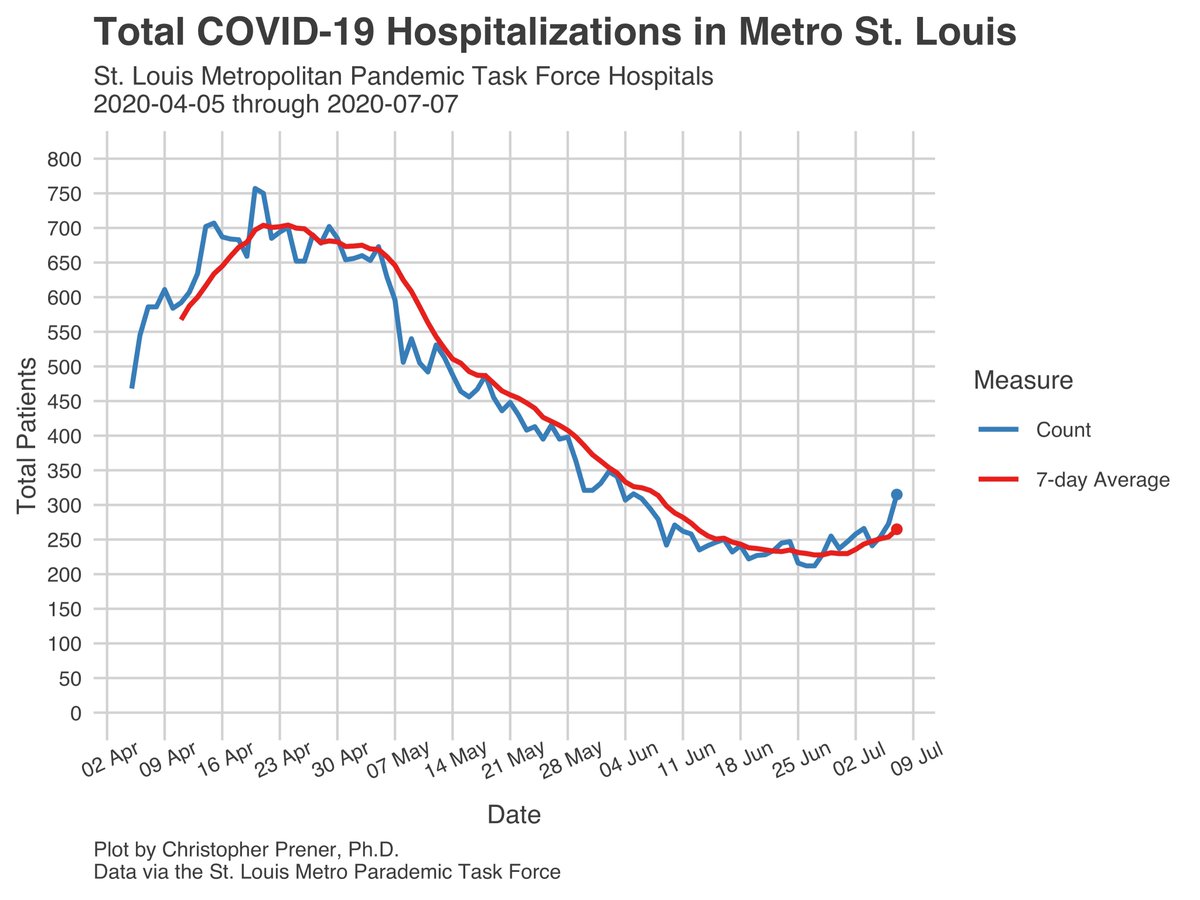
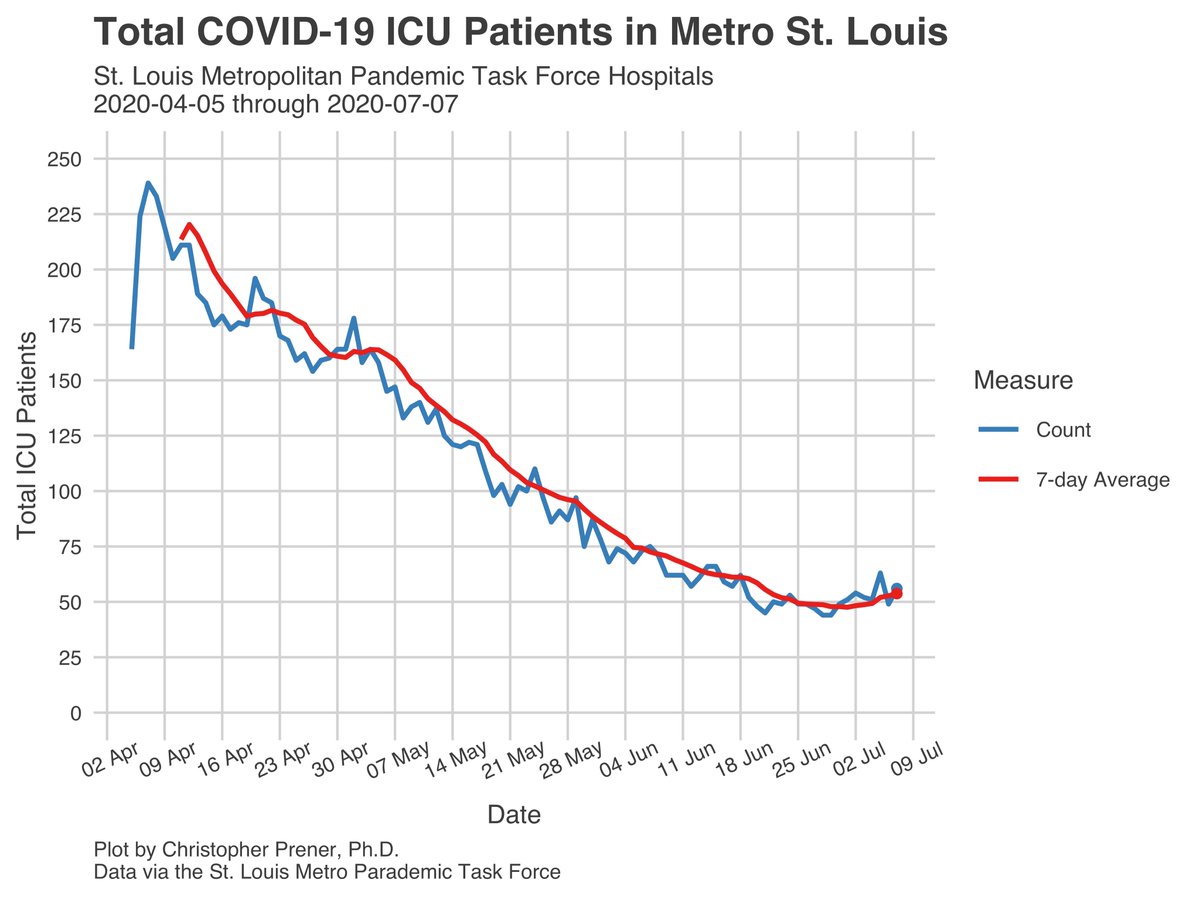
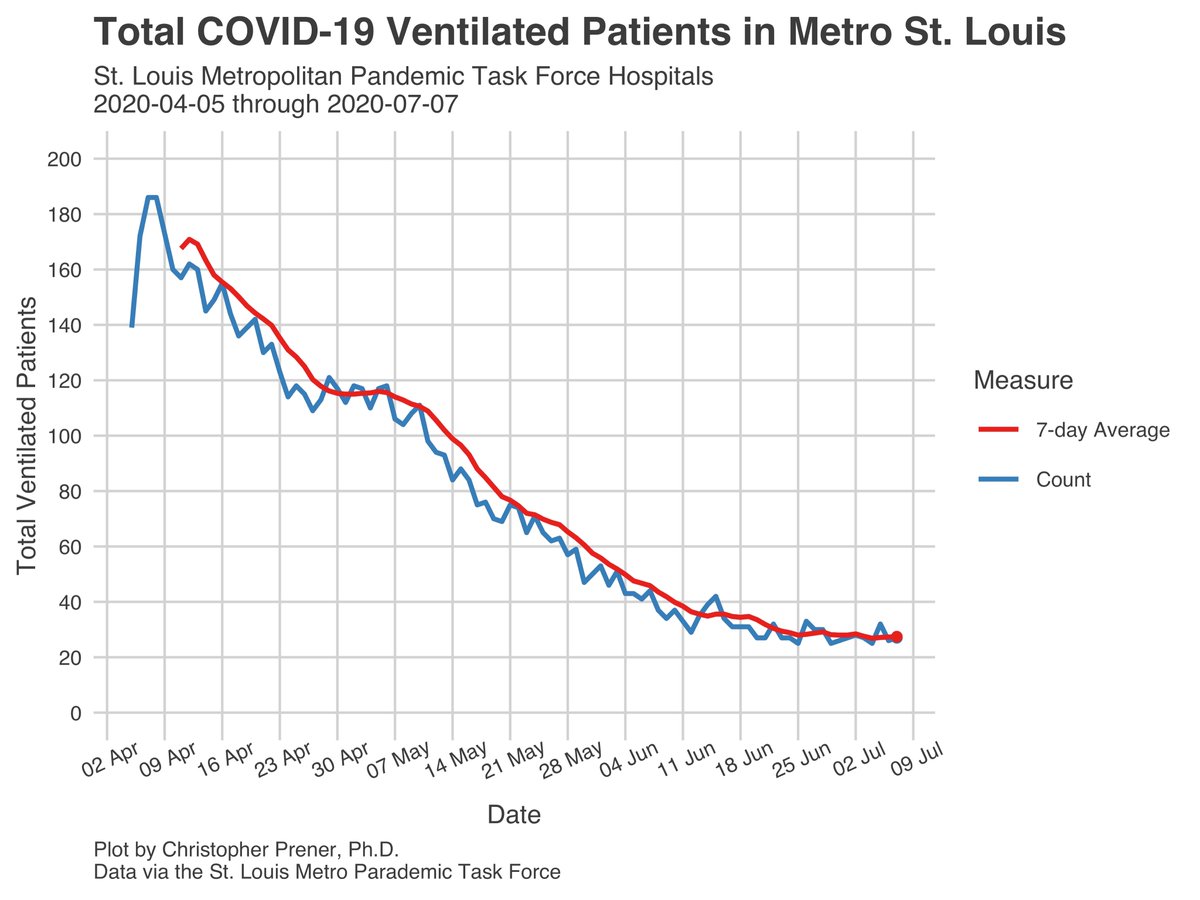
One metric that is up in #StLouis are the hospitalization numbers. The 7-day averages for new patients, total patients, and patients in the ICU have all seen upward movement from their recent lows. The average number of ventilated patients remains plateaued. 11/19
We do have some (very cautiously) positive news in two areas. One is testing, where our rate of new individuals tested per capita is near its high since the “reset” of testing data at Memorial Day. Our percent positive value has remained well below its recent high. 12/19


The other statewide trend worth highlighting - with very, very, very cautious optimism - is that, while the numbers of new cases are up across the focal states I track… 13/19


… the numbers of deaths are not. These are competing hypotheses out there about this trend, but I would urge folks to reserve judgement for now - we may simply be seeing a greater lag between positive tests and death due to increased testing capacity in June. 14/19


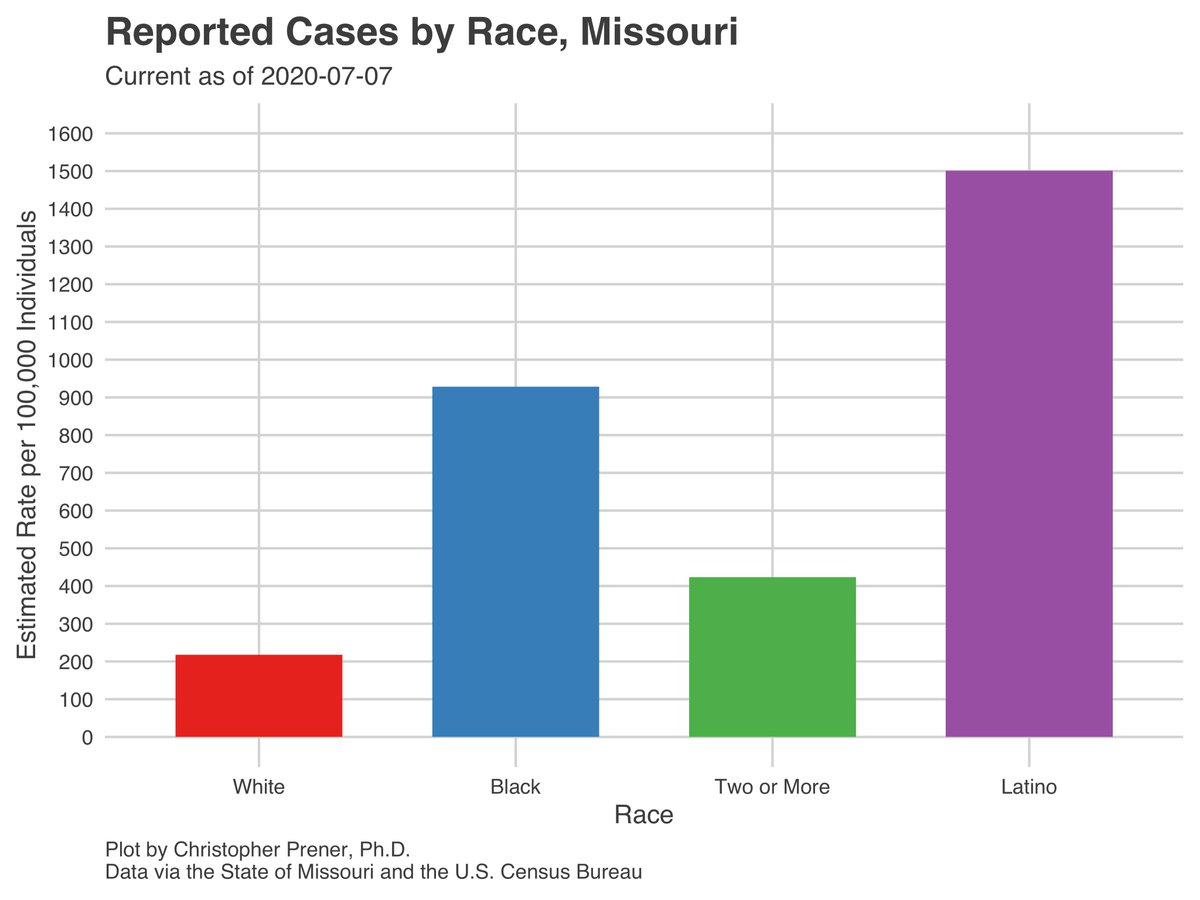
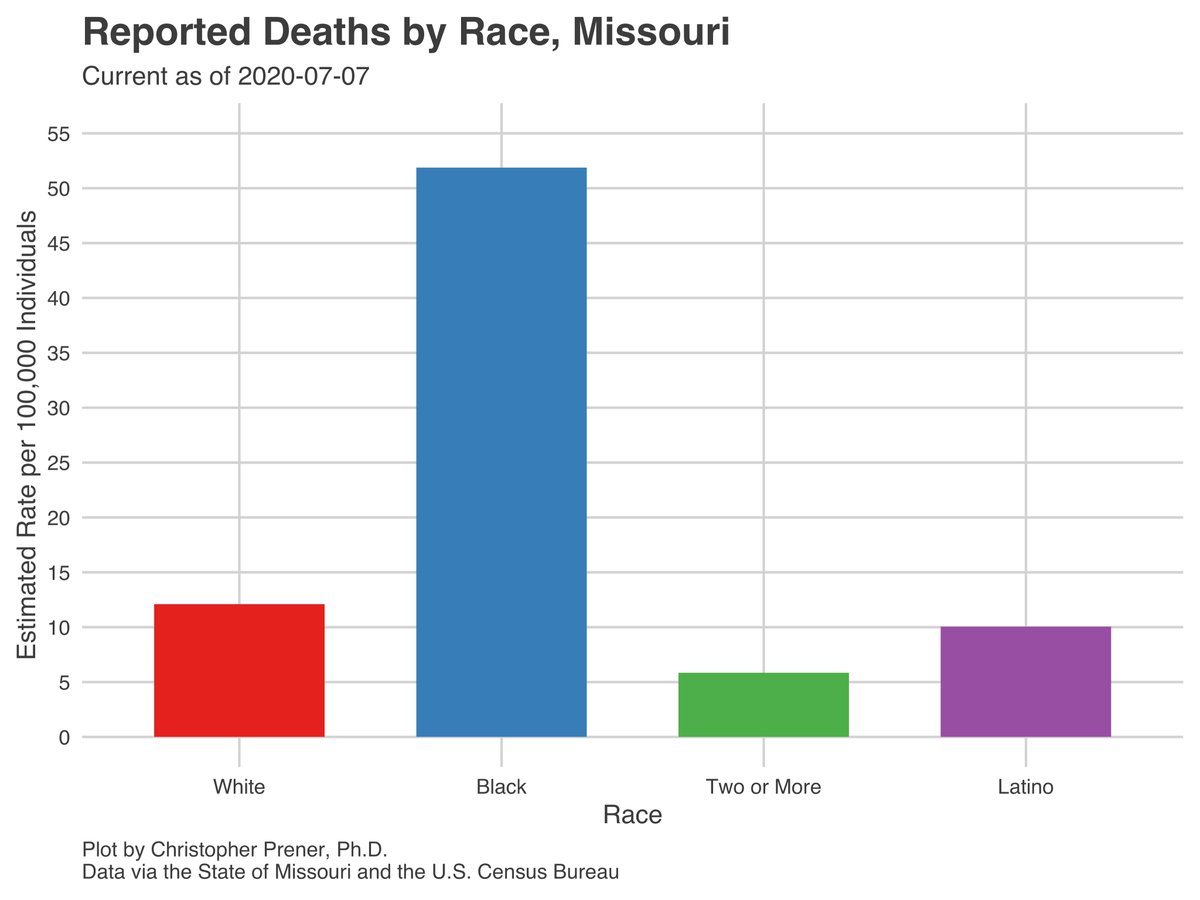
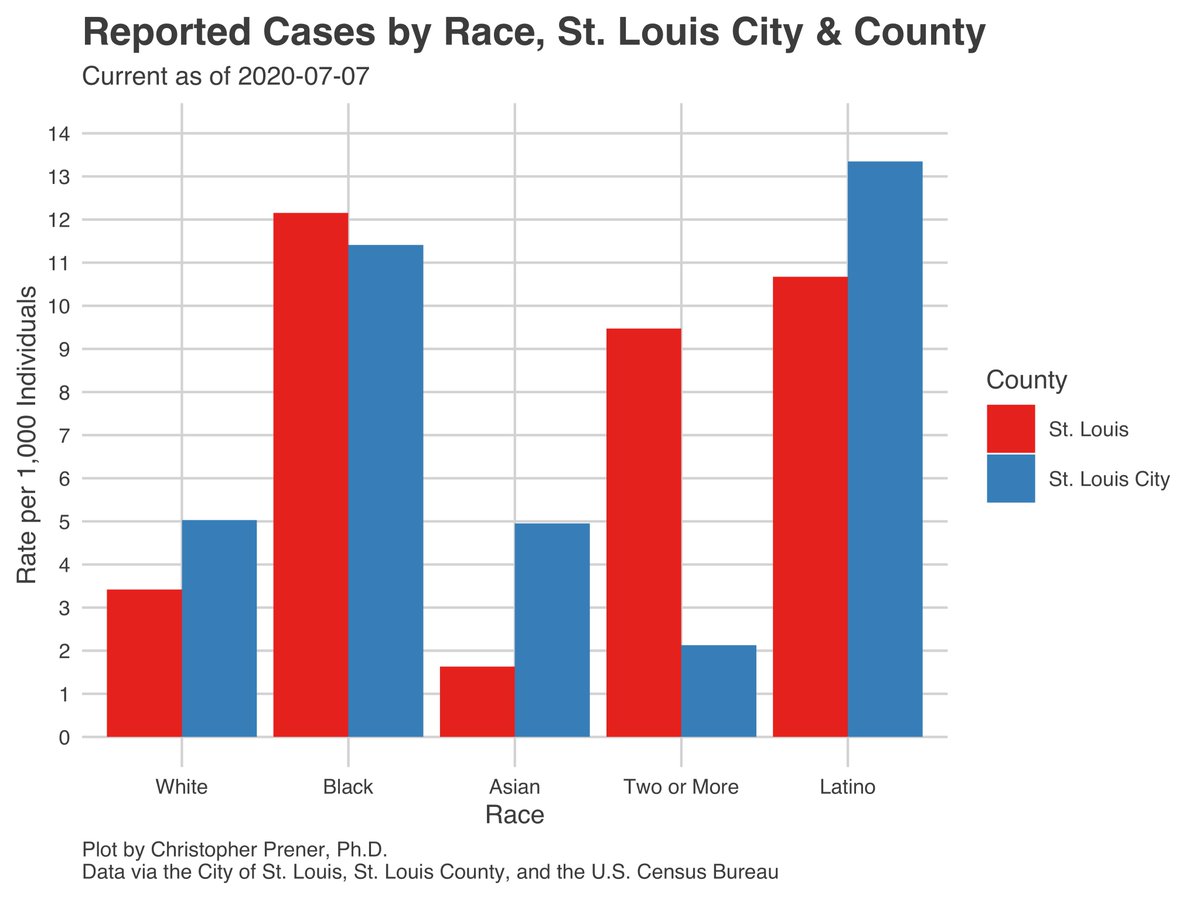
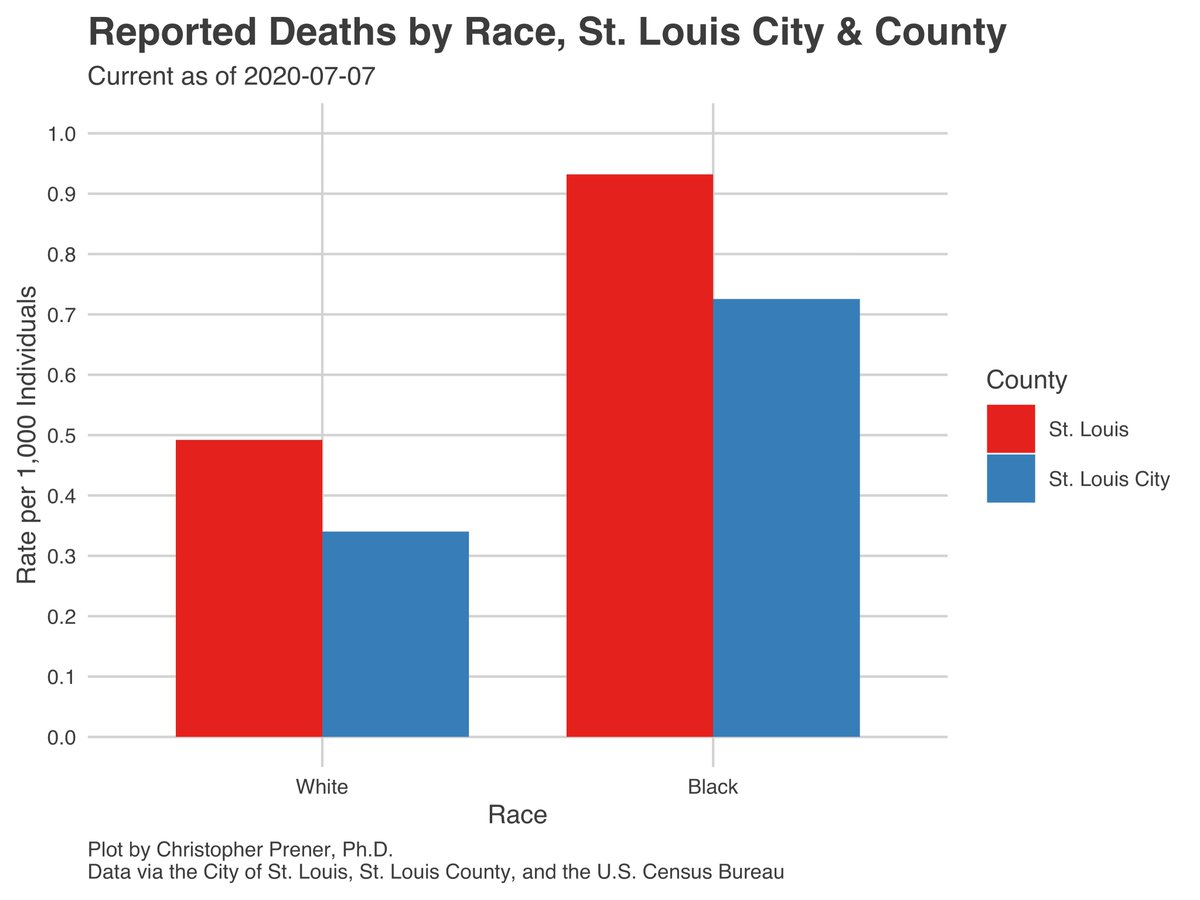
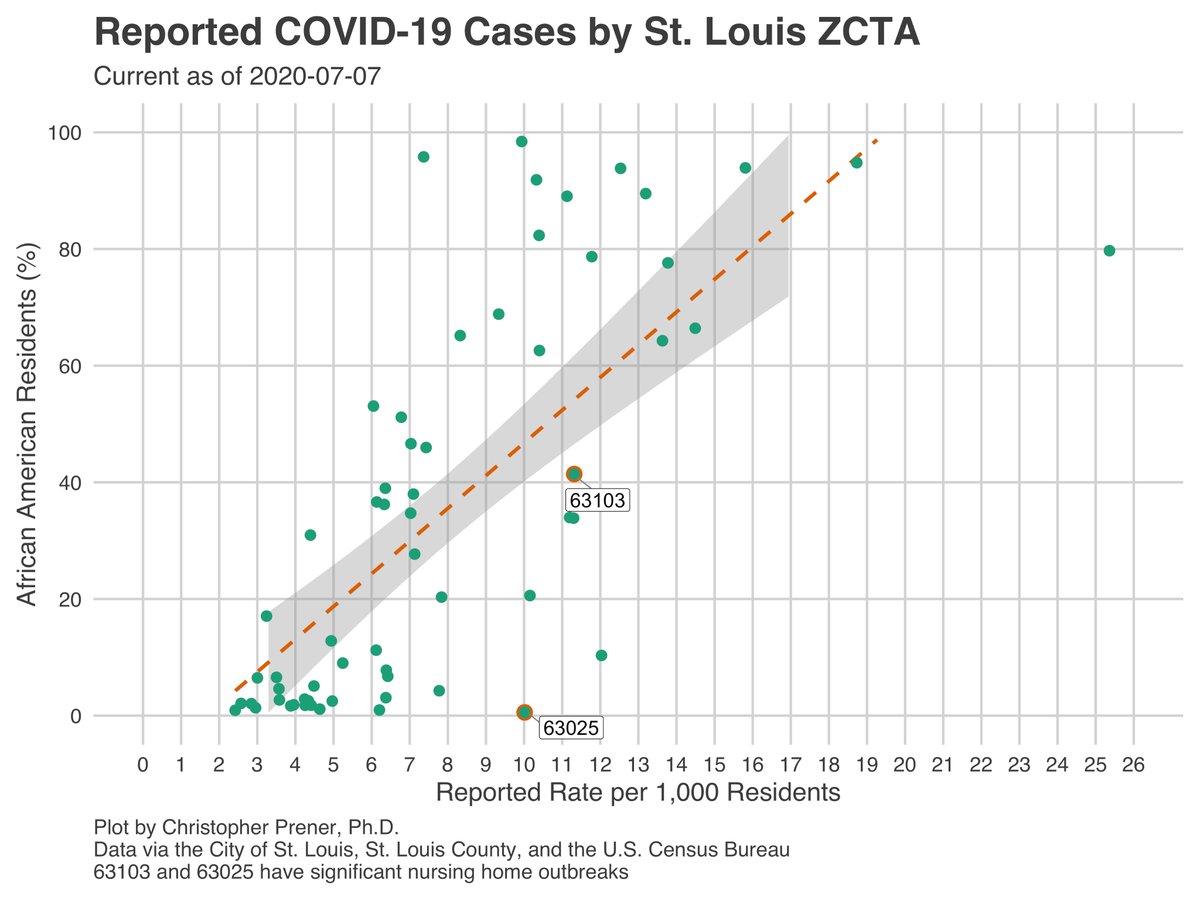
At both the state level and within #StLouis City and County, we’re seeing the patterns in racial disparities remain quite durable. The numbers for Latinos (where we can get them) are particularly high, as are the numbers for African Americans. 15/19
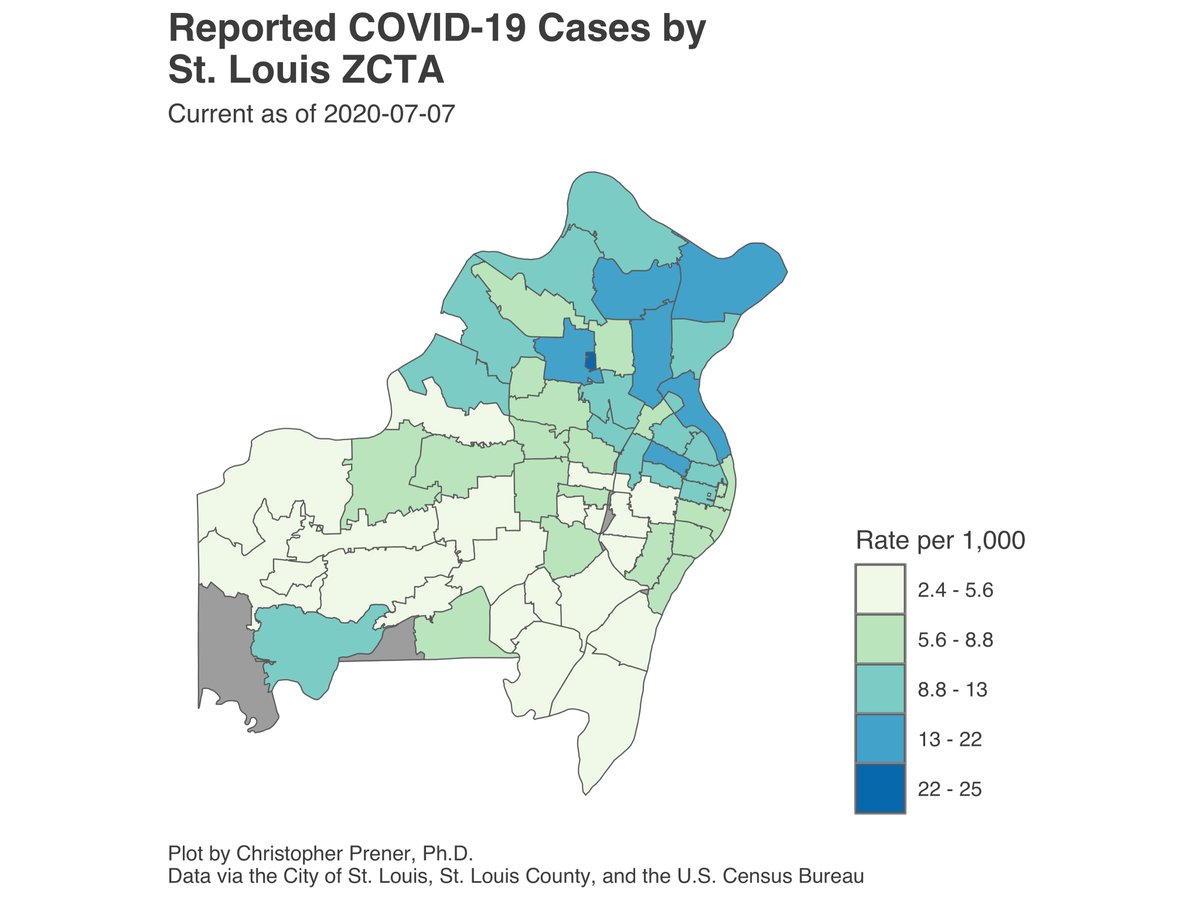
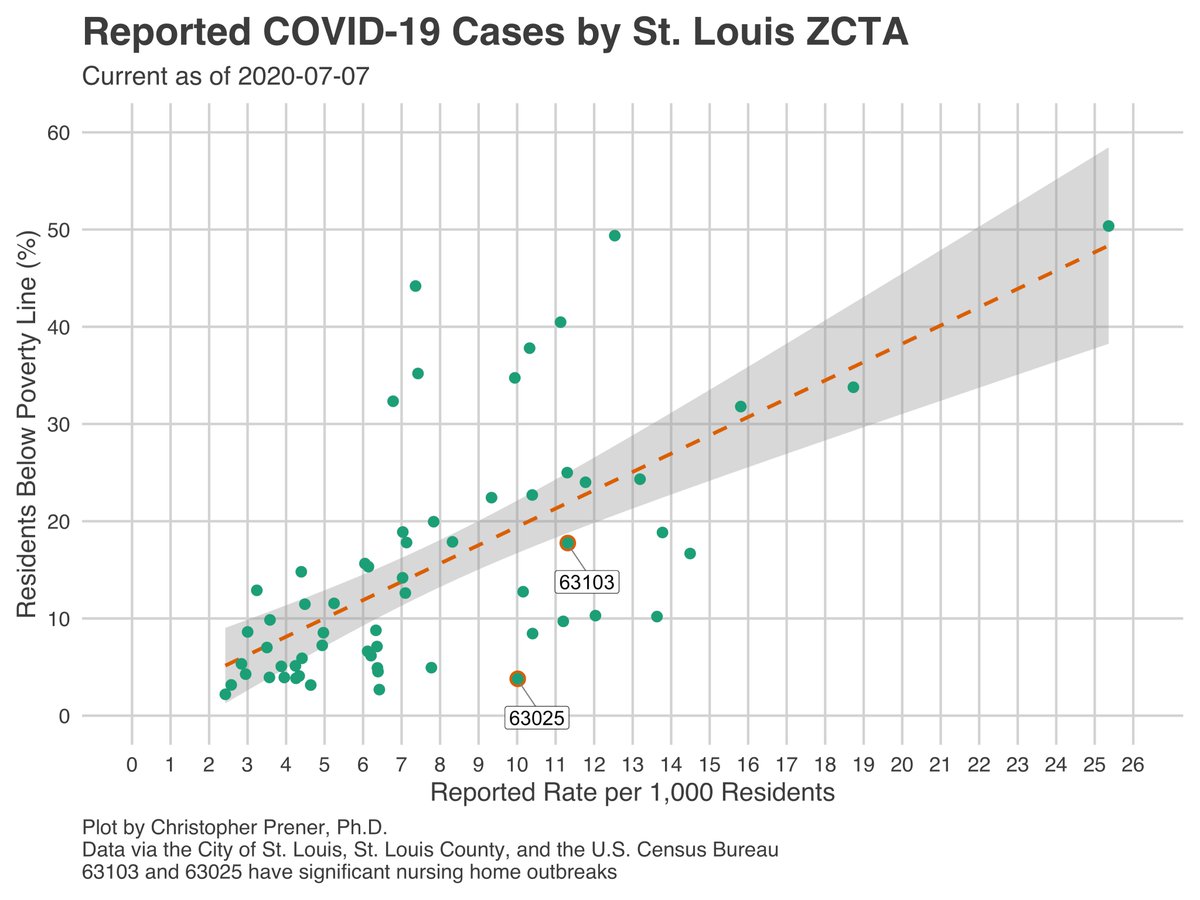
Within the #StLouis area, I also want to highlight the per capita rate of infections in the Kinloch area, which now is quite a bit higher than other zips elsewhere in the two county area. 16/19
My standard caveats about uncertainty - infections (1) are historical data that reflect infections 2-3 weeks ago, (2) are biased by testing patterns, (3) may include probable but unconfirmed cases in some counties, and (4) rates are not individual probabilities of illness. 17/19
Additional maps and plots are on my tracking site - slu-opengis.github.io/covid_daily_vi….
My #rstats code and and data are all available on @GitHub - github.com/slu-openGIS/co…. They're licensed for re-use with attribution, and feedback and improvements are always welcome. 18/19
My #rstats code and and data are all available on @GitHub - github.com/slu-openGIS/co…. They're licensed for re-use with attribution, and feedback and improvements are always welcome. 18/19
My next thread will be Thursday, 7/9. In the meantime, please check out the overhauled website, which now has dedicated pages for both #StLouis and #KansasCity data as well as an FAQ. I’ll be adding more new material this week. 19/19
Tuesday 🤪 clearly wishing this week was already over... sorry!