Short #Missouri #COVID19 evening update 🧵 for Tuesday, 6/16. I’ve pushed updates to all metrics to the website - slu-opengis.github.io/covid_daily_vi….
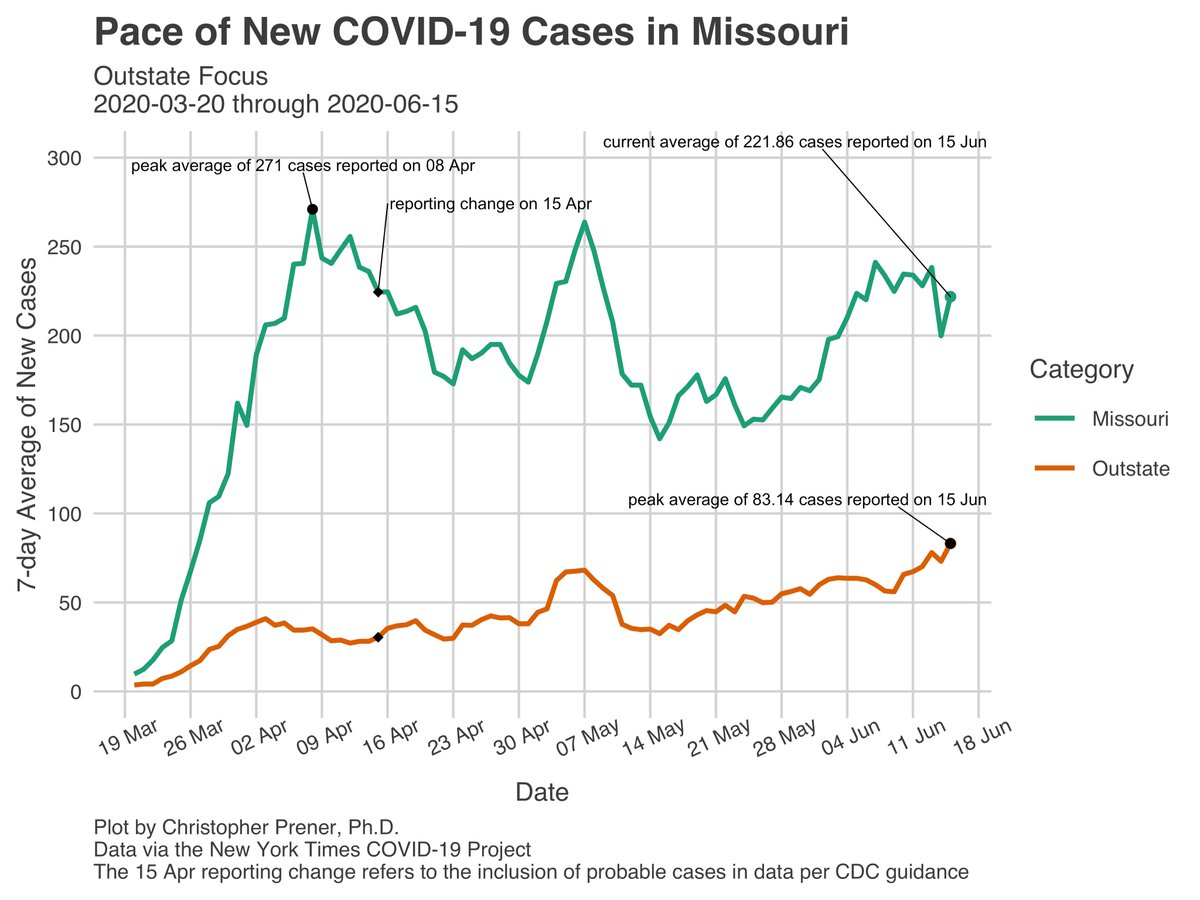
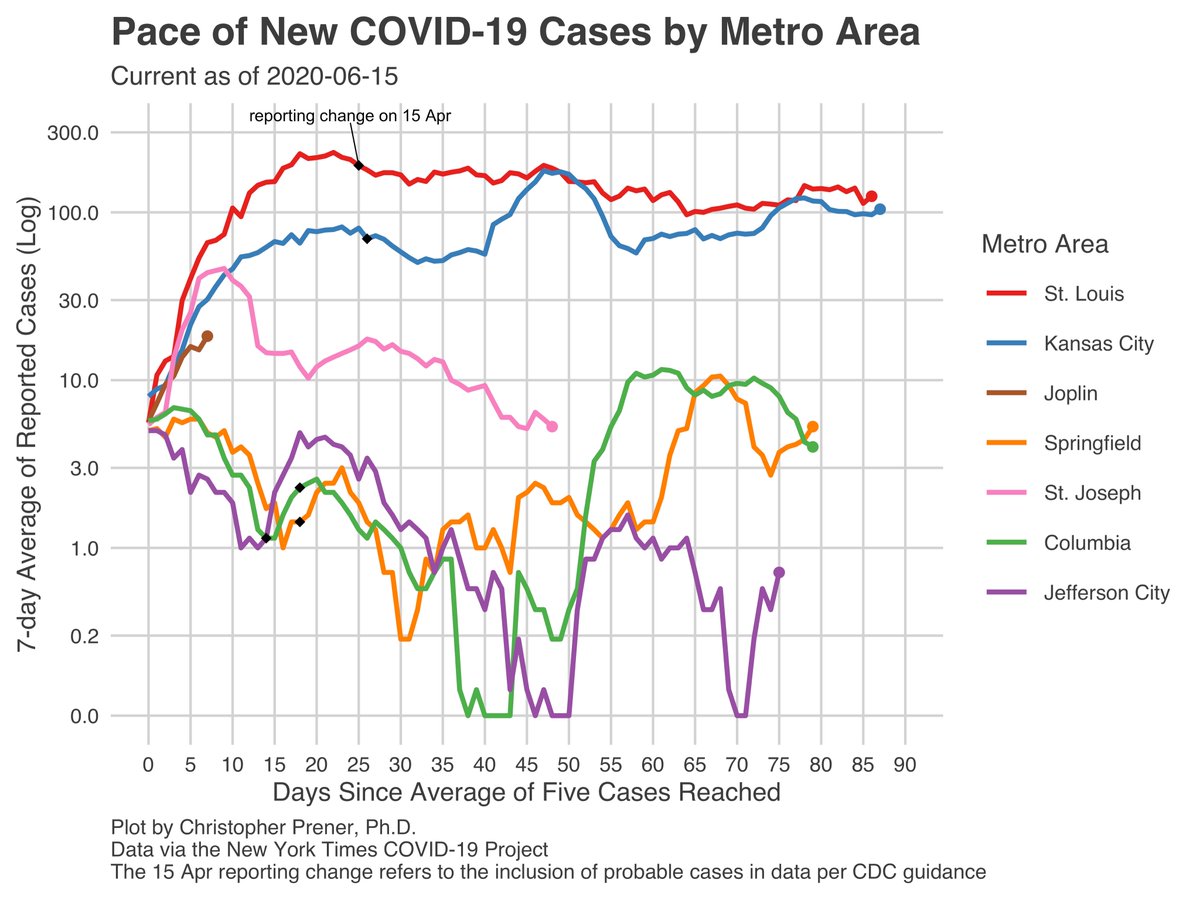
The headline - outstate cases hit another new peak today - we’re averaging ~84 new cases per day outside of #StLouis and #KansasCity. 1/
The headline - outstate cases hit another new peak today - we’re averaging ~84 new cases per day outside of #StLouis and #KansasCity. 1/
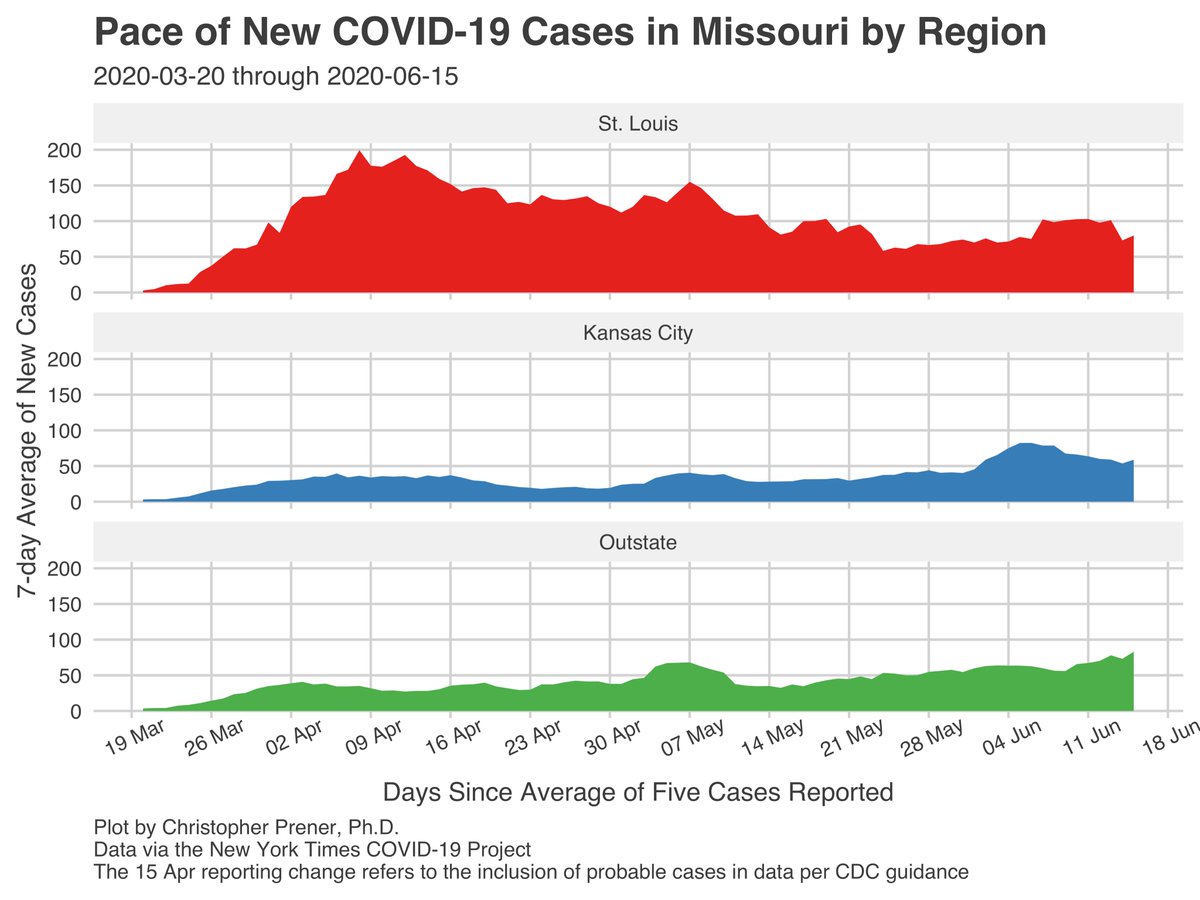
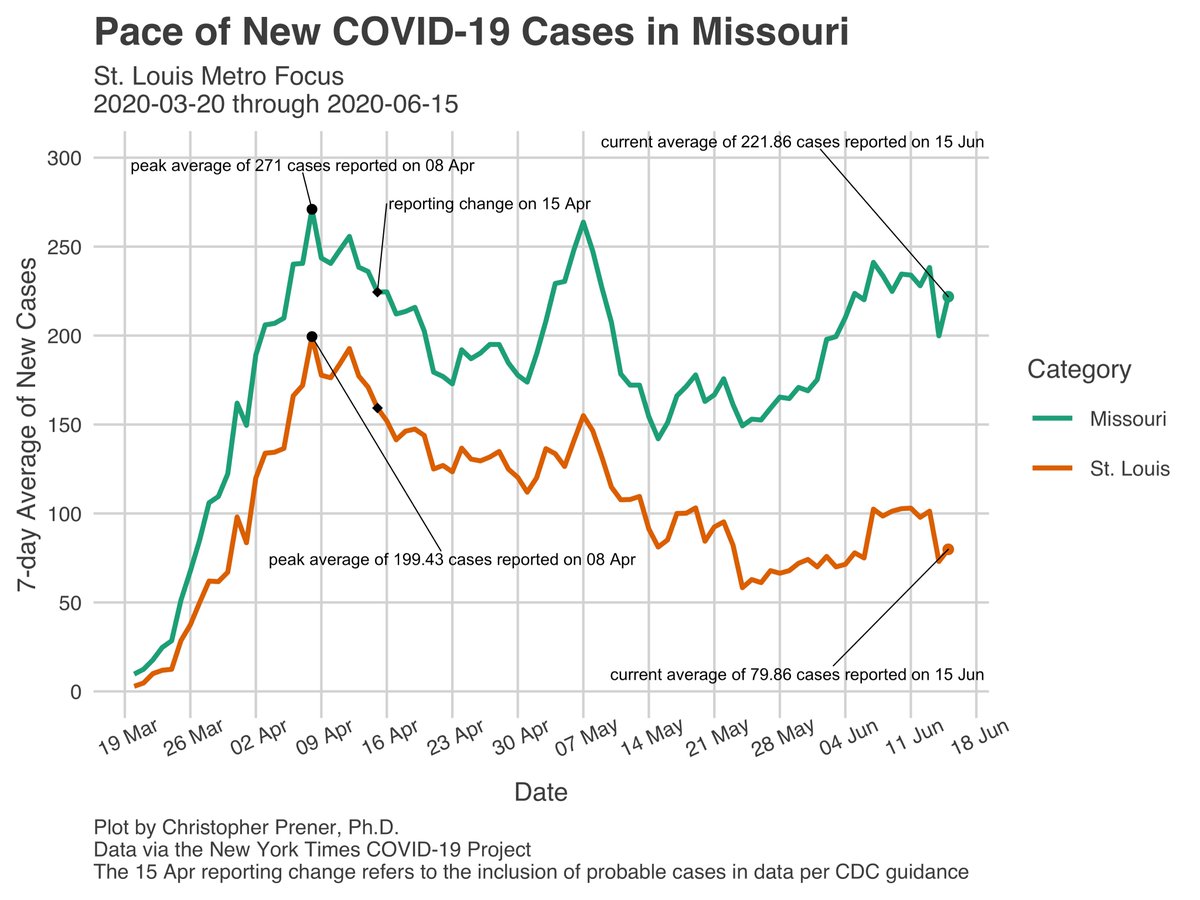
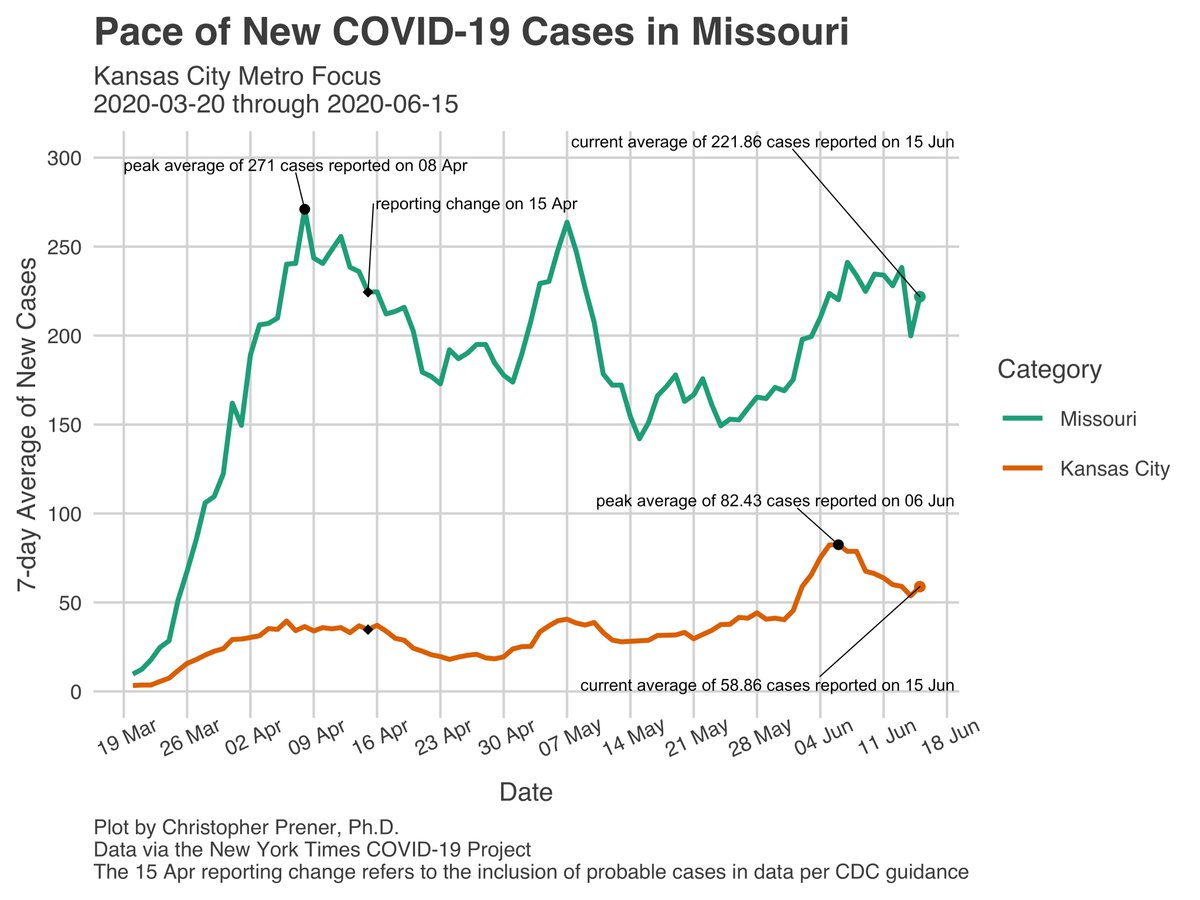
The statewide 7-day average plots have a noticeable anomaly on the green trend line - a drop then spike back up ☝️ that is artifact from the largely missed day of reporting Sunday that I mentioned in my 🧵 yesterday. I don’t think yesterday’s data release overcompensates... 2/17
...by dumping more new cases than we would expect. Instead, this is reversion of the mean - i.e. our 7-day averages right now are probably a bit lower than they would have been had the state provided the regular update to their dashboard on Sunday, but not by all that much. 3/17
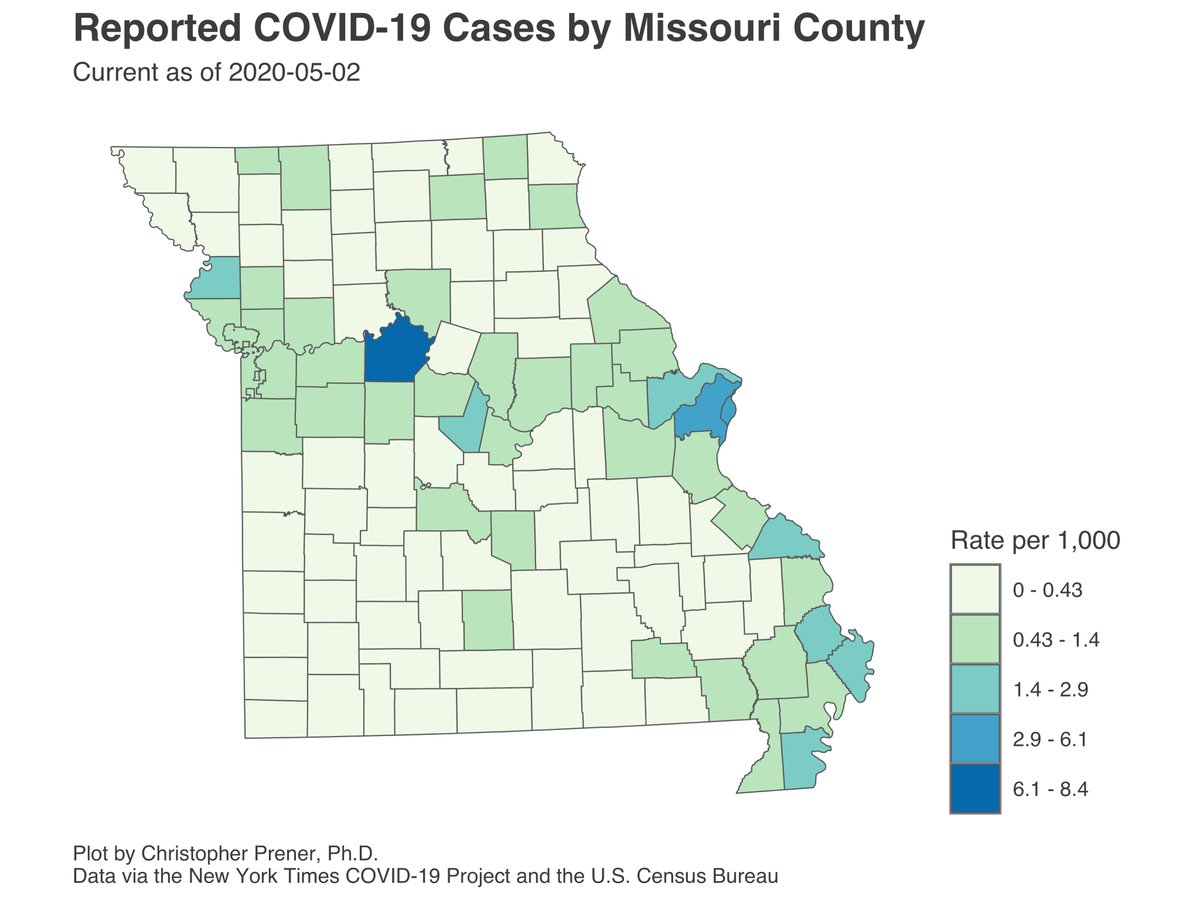
But back to the headline - outstate cases. Ten days ago, my focus was on northern MO and Mid-MO. New cases have slowed considerably in both regions, with just a handful in Boone and Adair counties yesterday. 4/17


The same is true in the St. Jo metro, were DeKalb County added a handful as well. The counties around Lake of the Ozarks have not seen more than a handful of new cases either, though I’ll take pains to note that this is not evidence by itself that Memorial Day was victimless. 5/


Instead, we’ve shifted to southern MO in two areas - the bootheel, where small but steady accumulation of cases never really ceased… 6/17


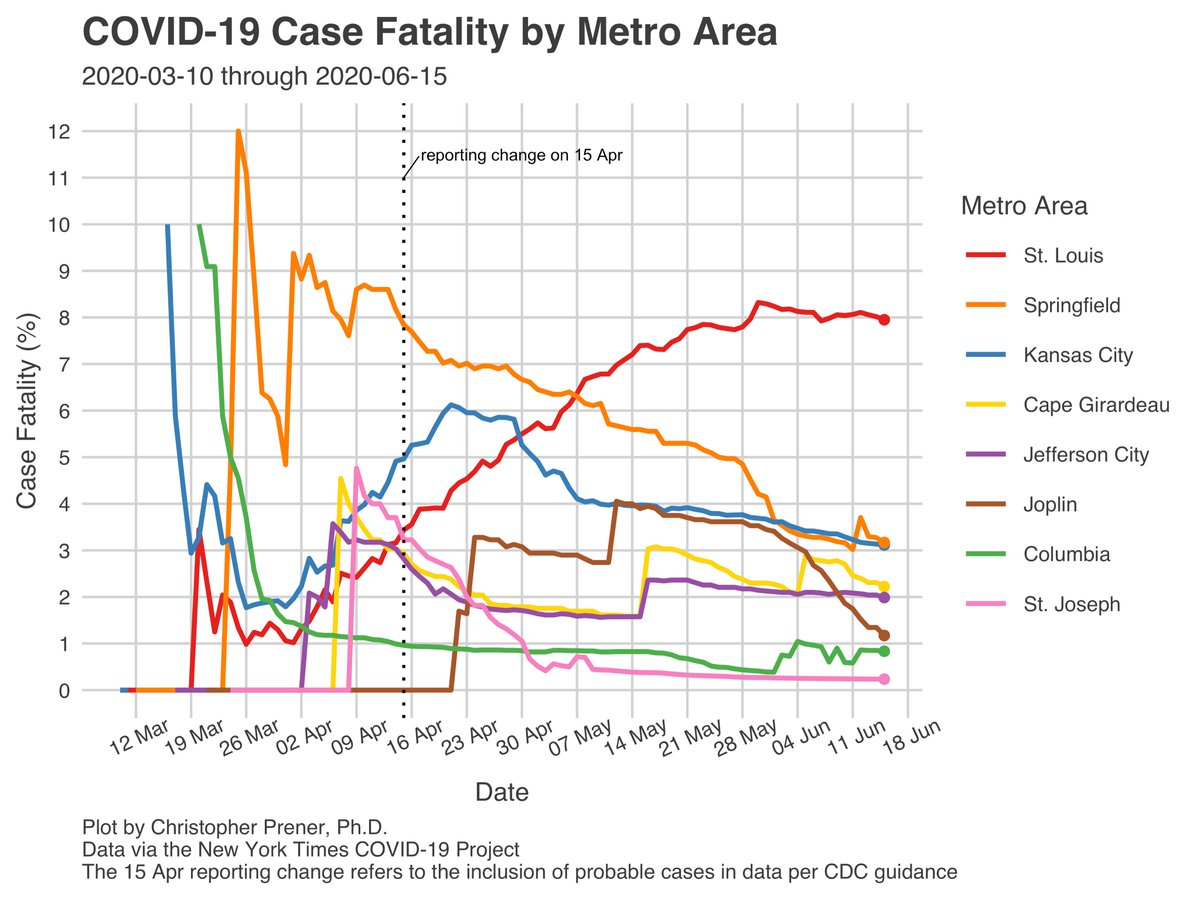
…and SW MO, where things have taken off pretty dramatically. Taney County, where Branson is (partially), has seen cases really tick upwards. The same is true in McDonald, Newton, and Jasper counties around Joplin. These area are really driving outstate numbers right now. 7/17


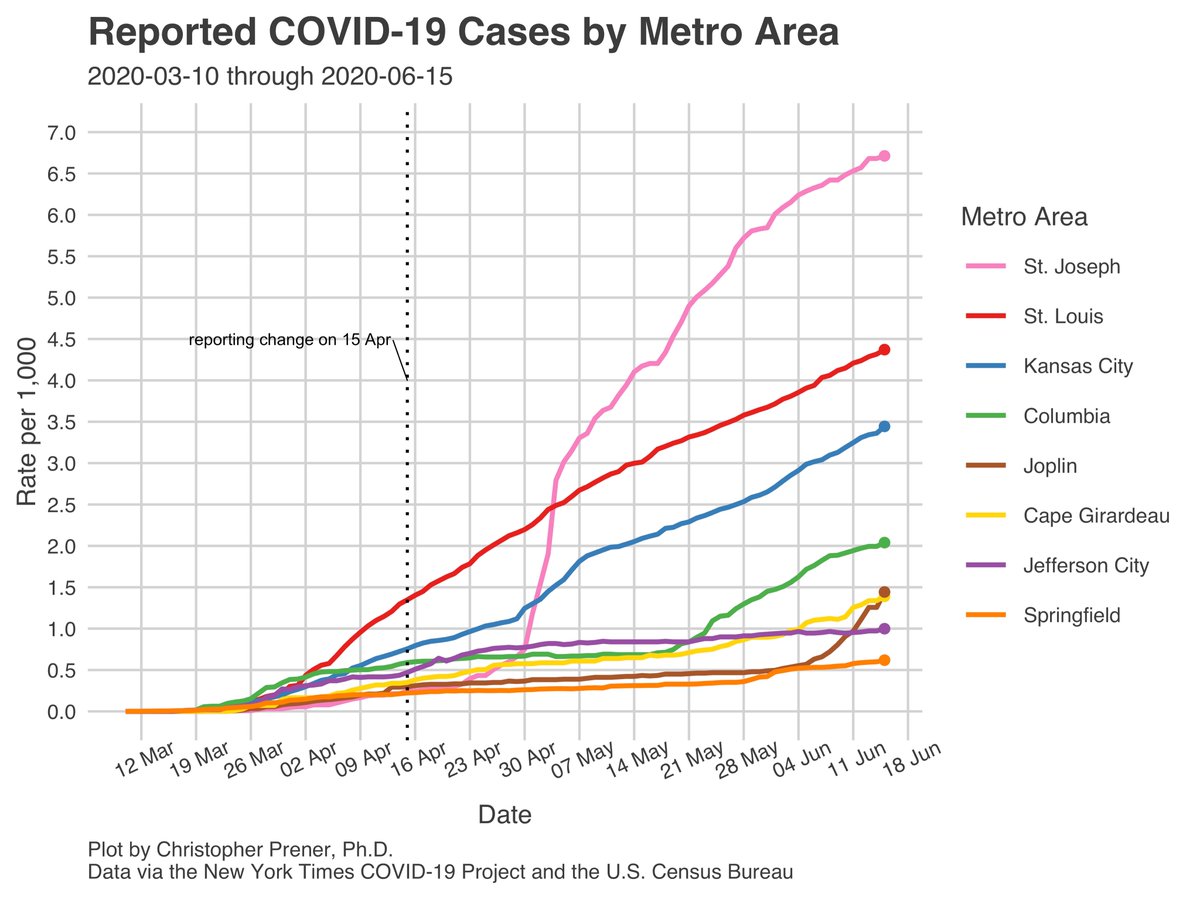
You can see this reflected in Joplin’s metro rate of new cases (which excludes McDonald County, FYI). It isn’t as high as #StLouis and #KansasCity, but it is much higher than the other metros right now. 8/17
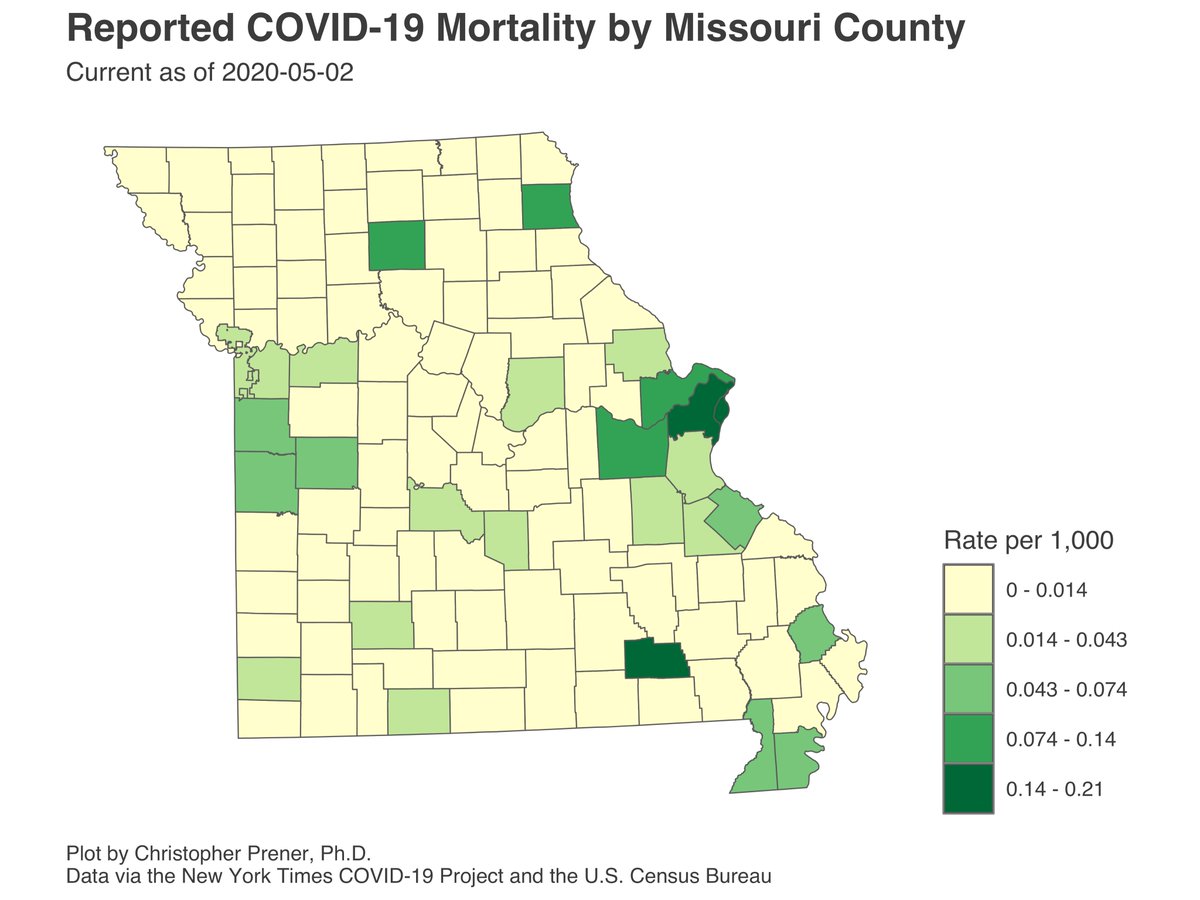
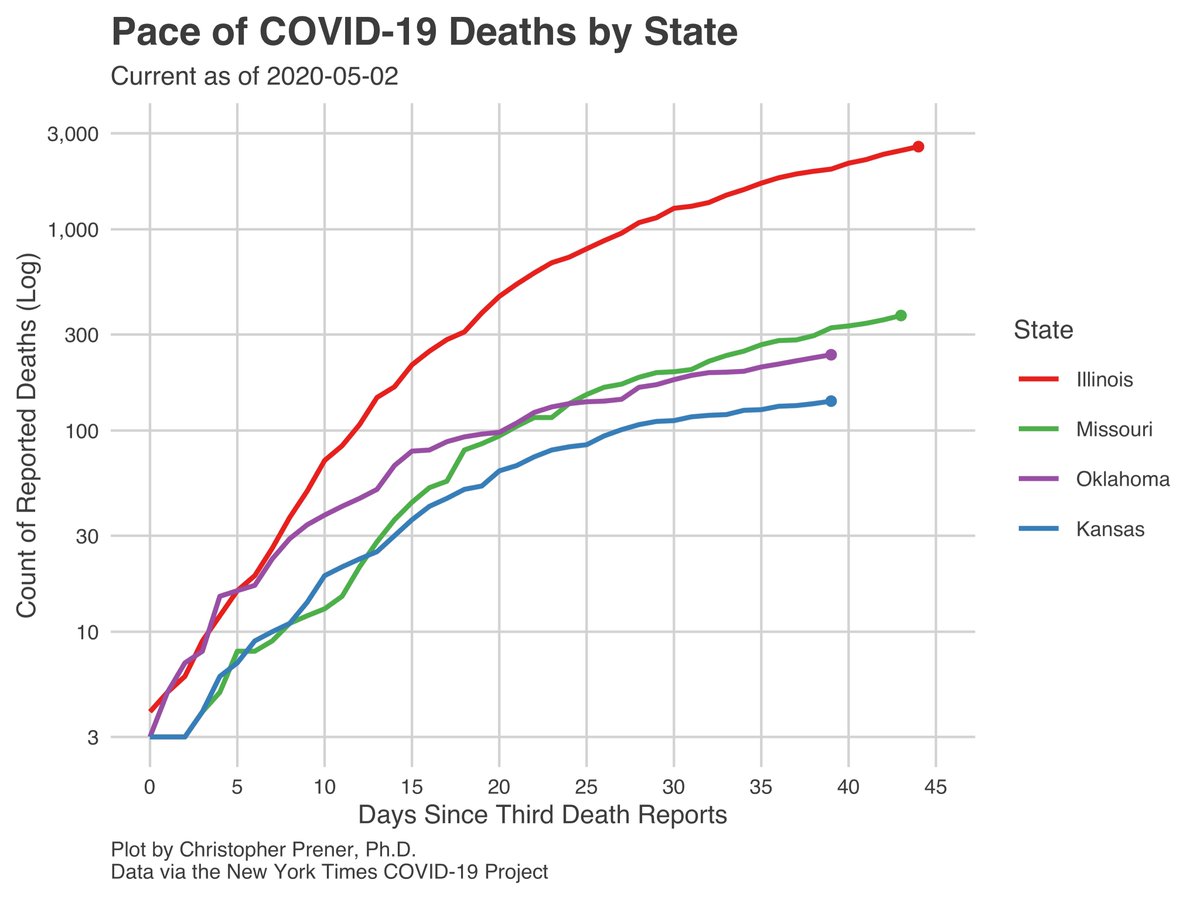
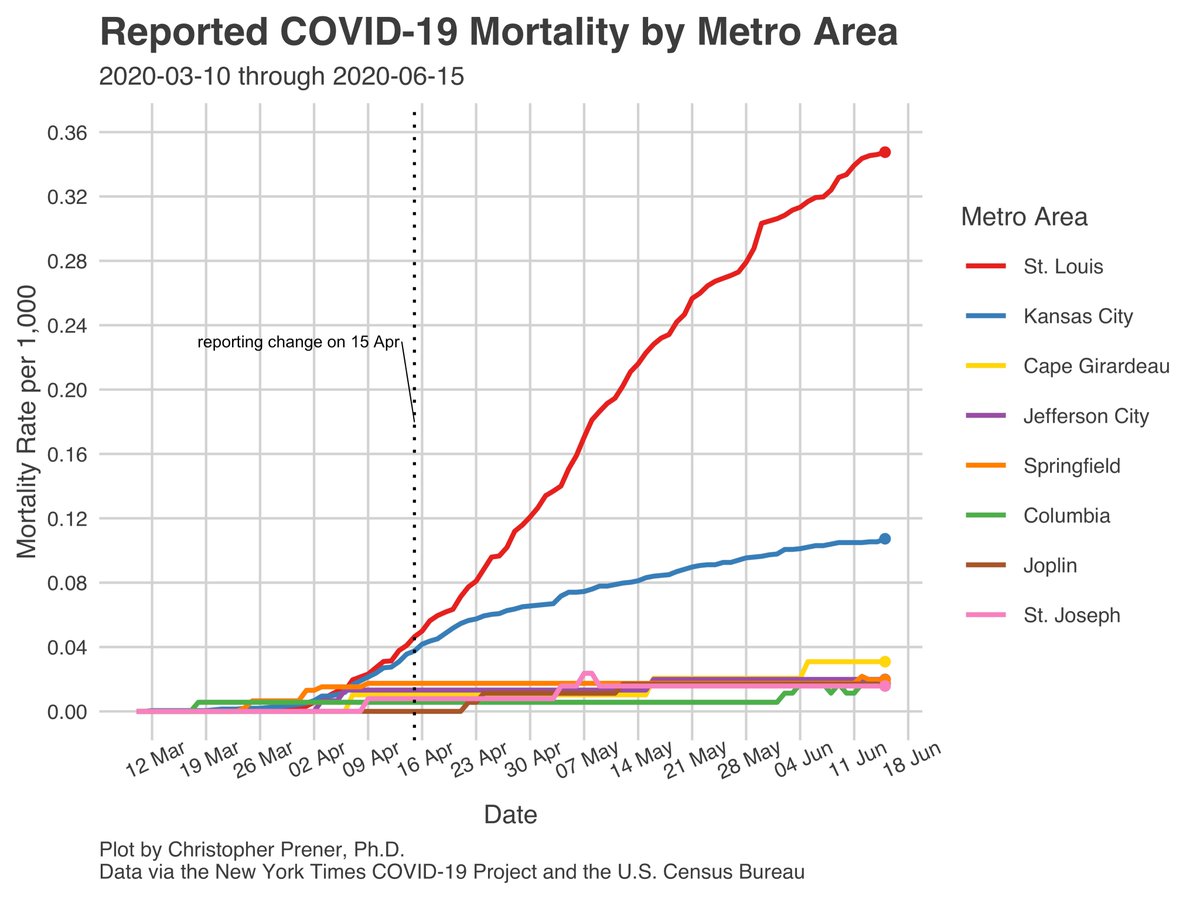
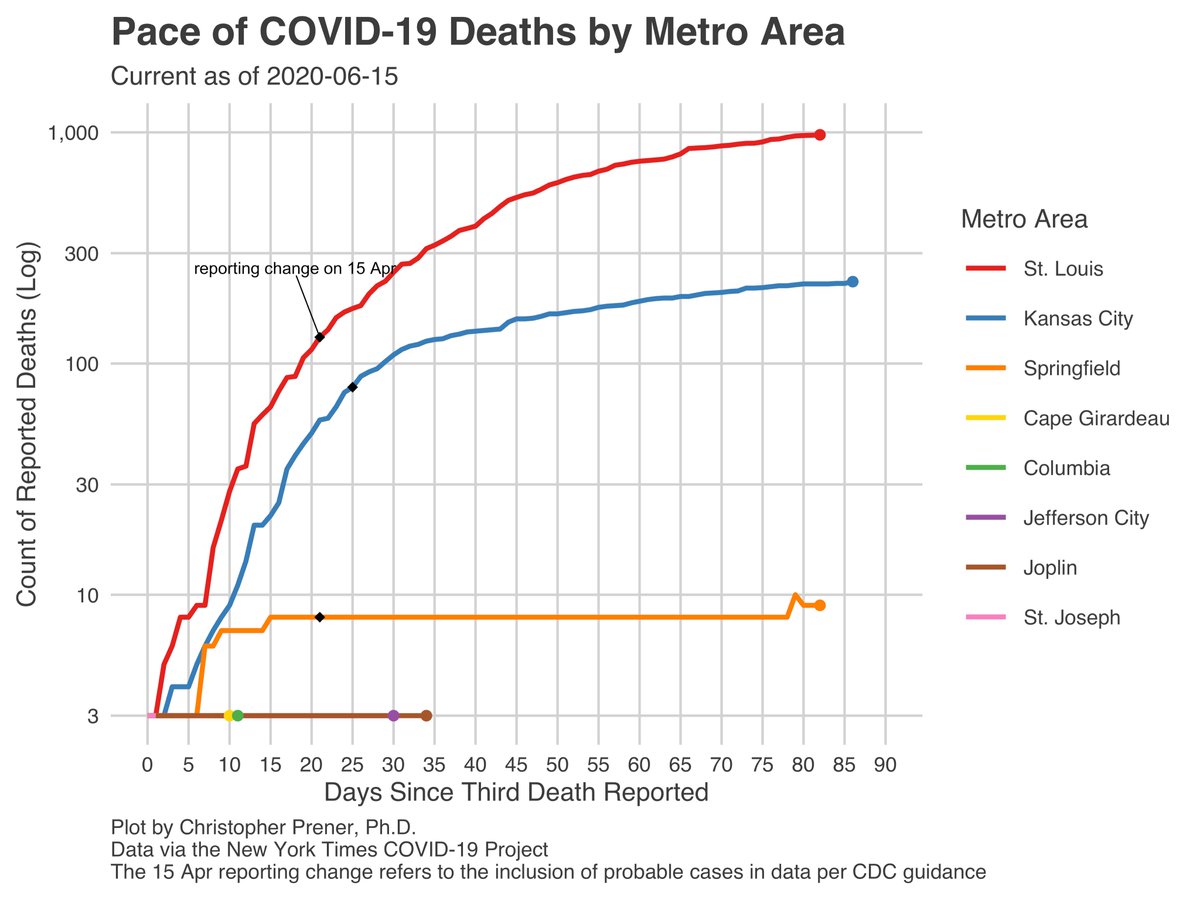
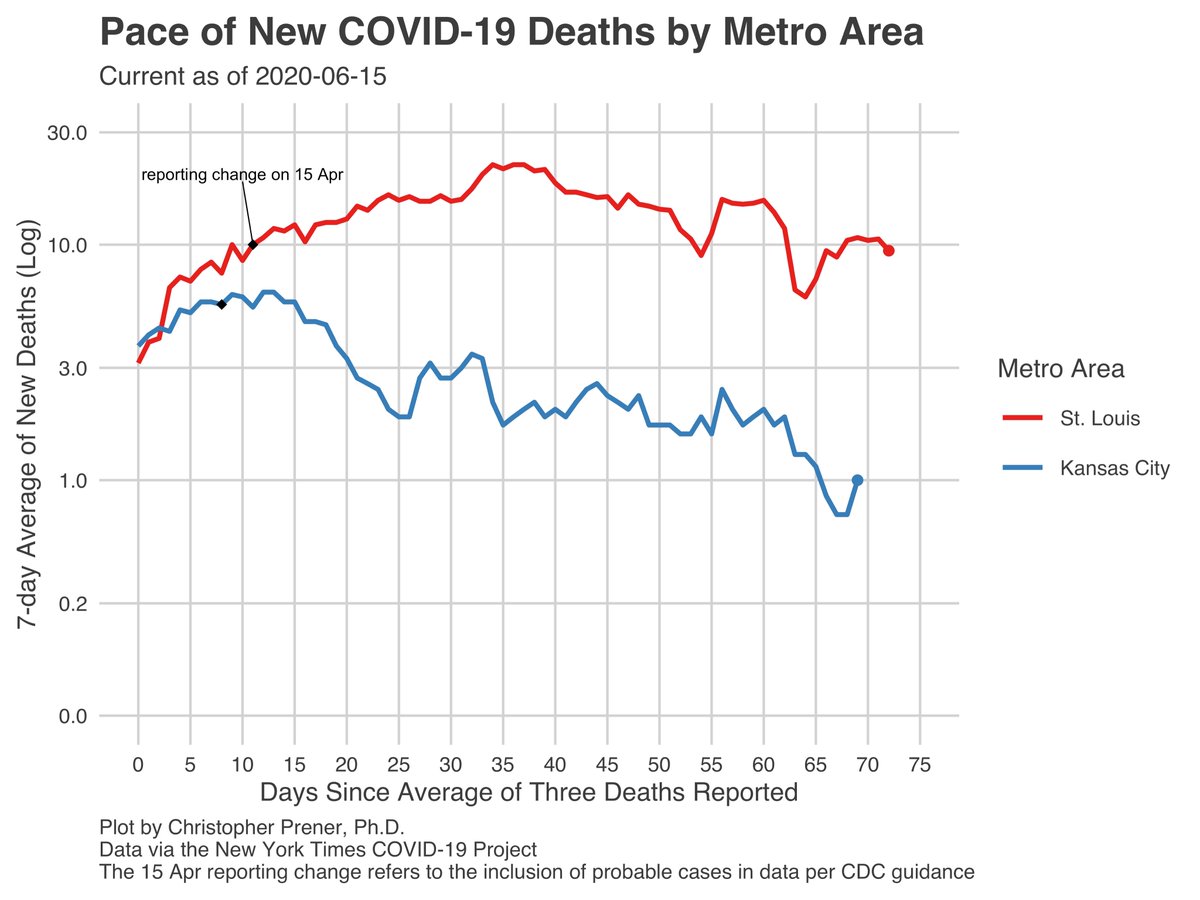
In terms of mortality, the #StLouis metro has continued to sit at an average of 10 deaths per day while #KansasCity is at only about a death per day on average. Overall, MO’s 7-day mortality average is dropping slightly along with our neighboring states. 9/17
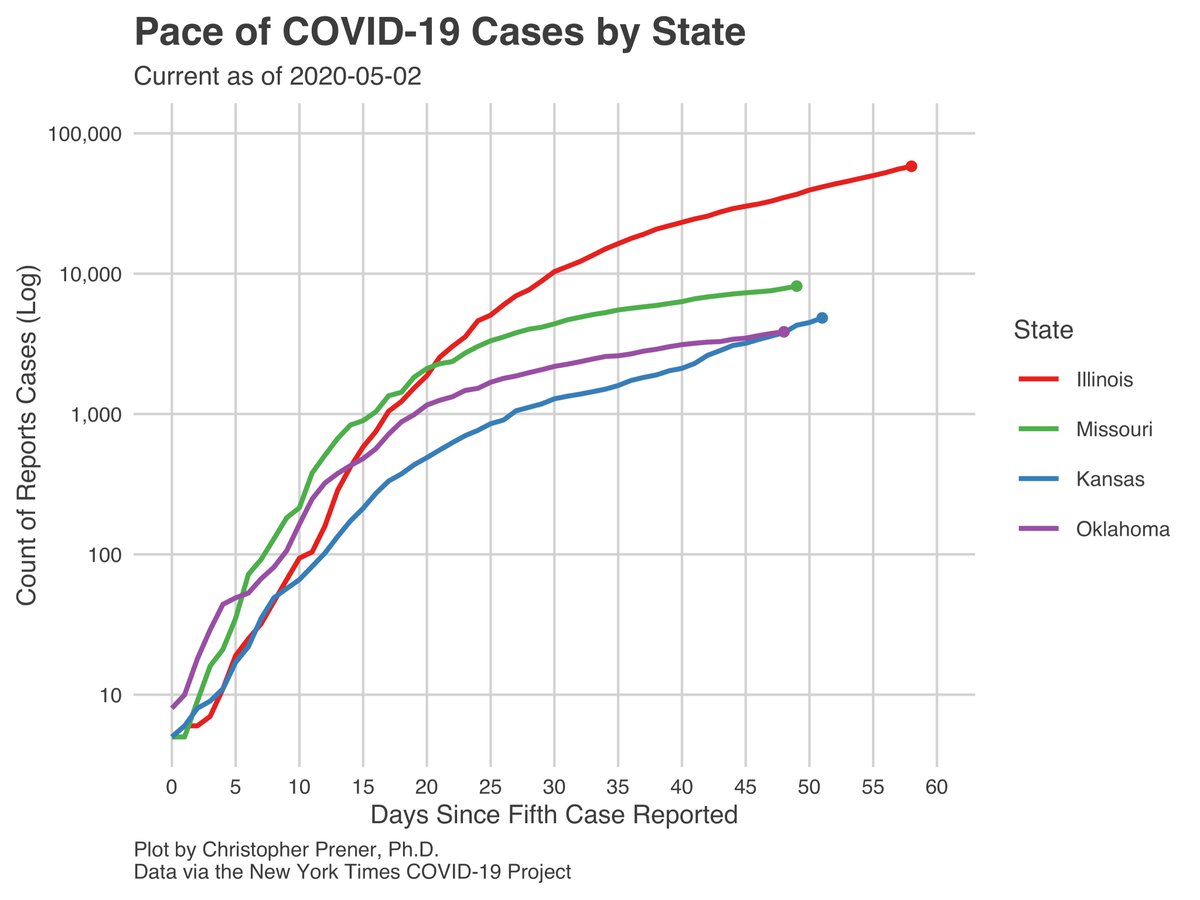
And like most of our neighborhoods these mortality trends may be short-lived - only IL has seen sustained drops in new cases. The other three focal states (and Arkansas, not shown) have seen steady increases in the pace of new cases. Mortality lags behind increases in cases. 10/

IL’s drop in new cases has a corresponding decrease in their percent positive - the number of people with positive tests divided by the number of people tested. MO’s, worryingly, is up a percentage point over the last couple weeks and our rate of new people tested is stagnet. 11/


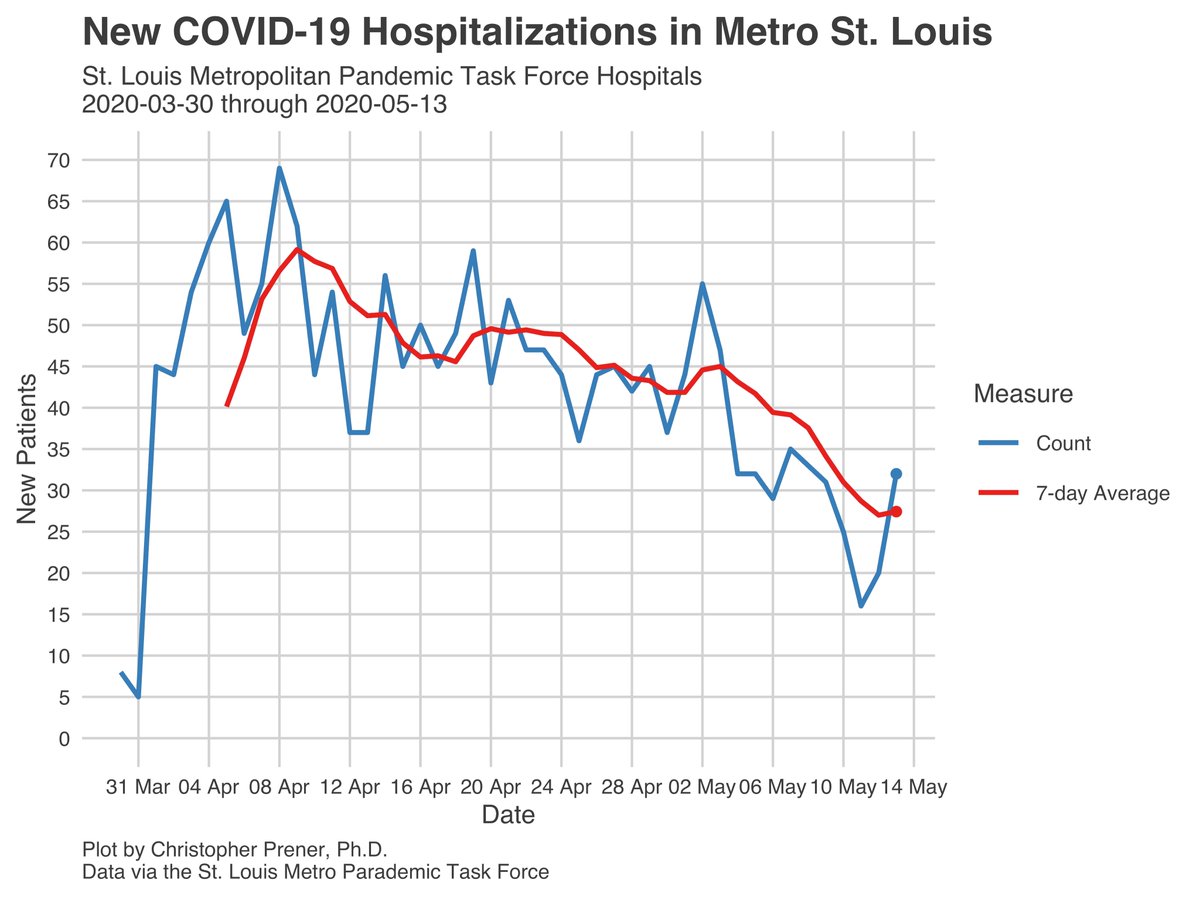
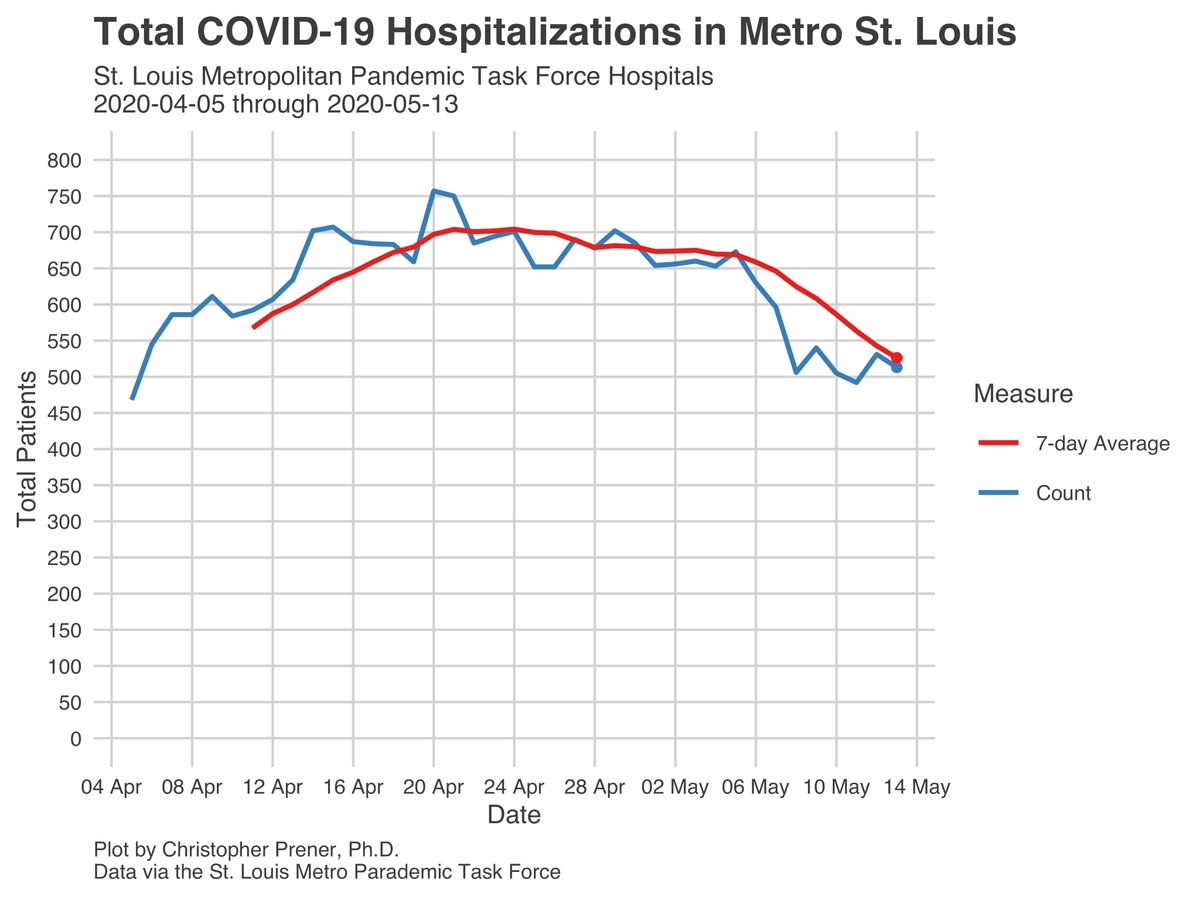
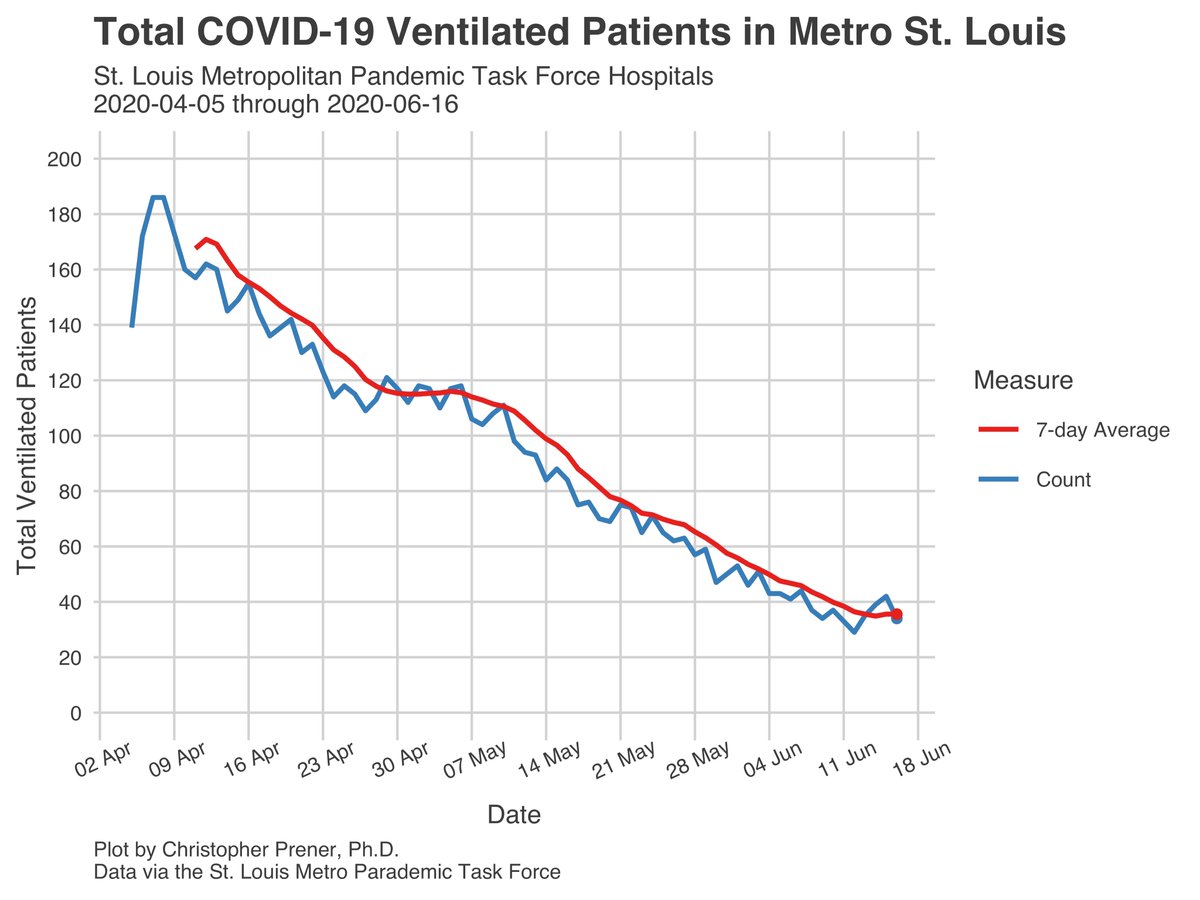
The best news that we’ve had lately had been around hospitalizations in #StLouis, but those metrics are appearing to “bottom out” - we’ll have to see if this pattern holds or they resume their downward decline. 12/17
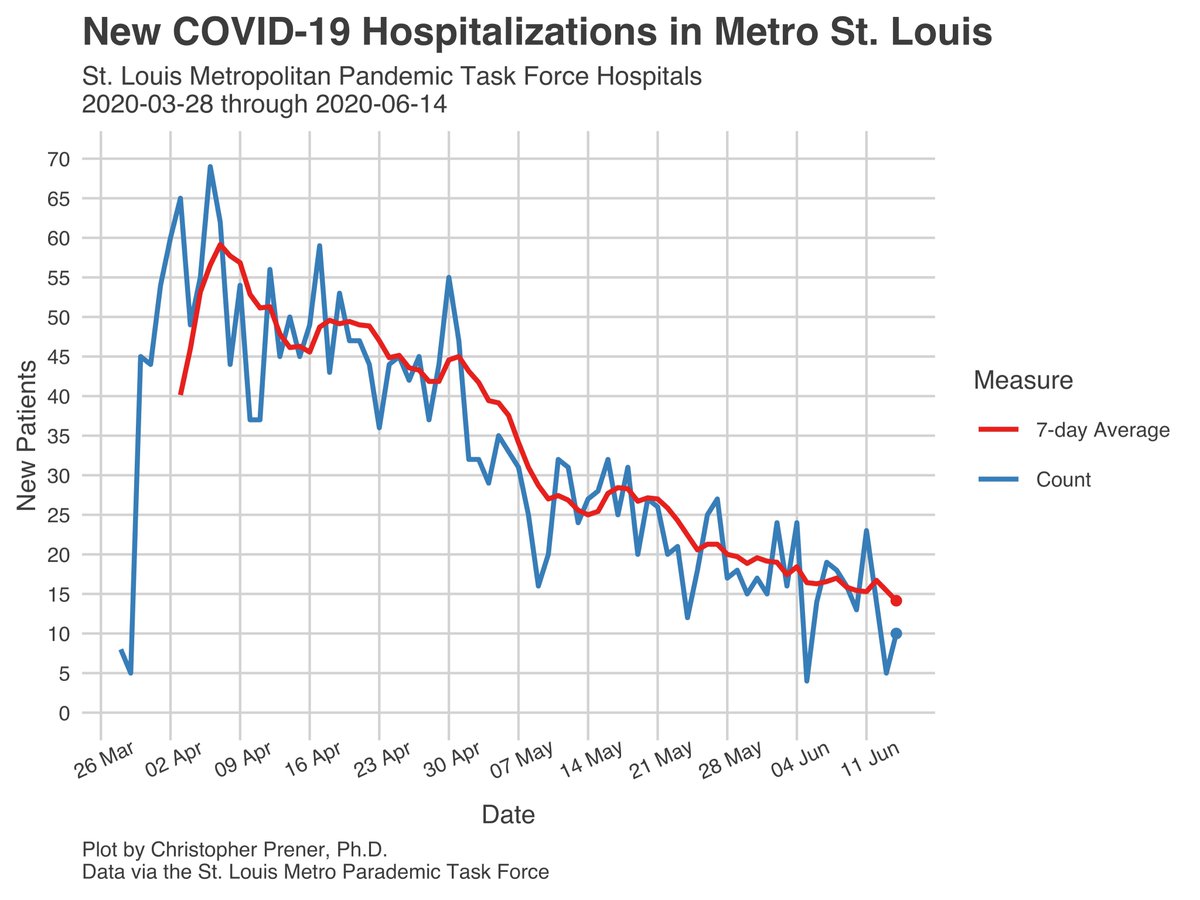
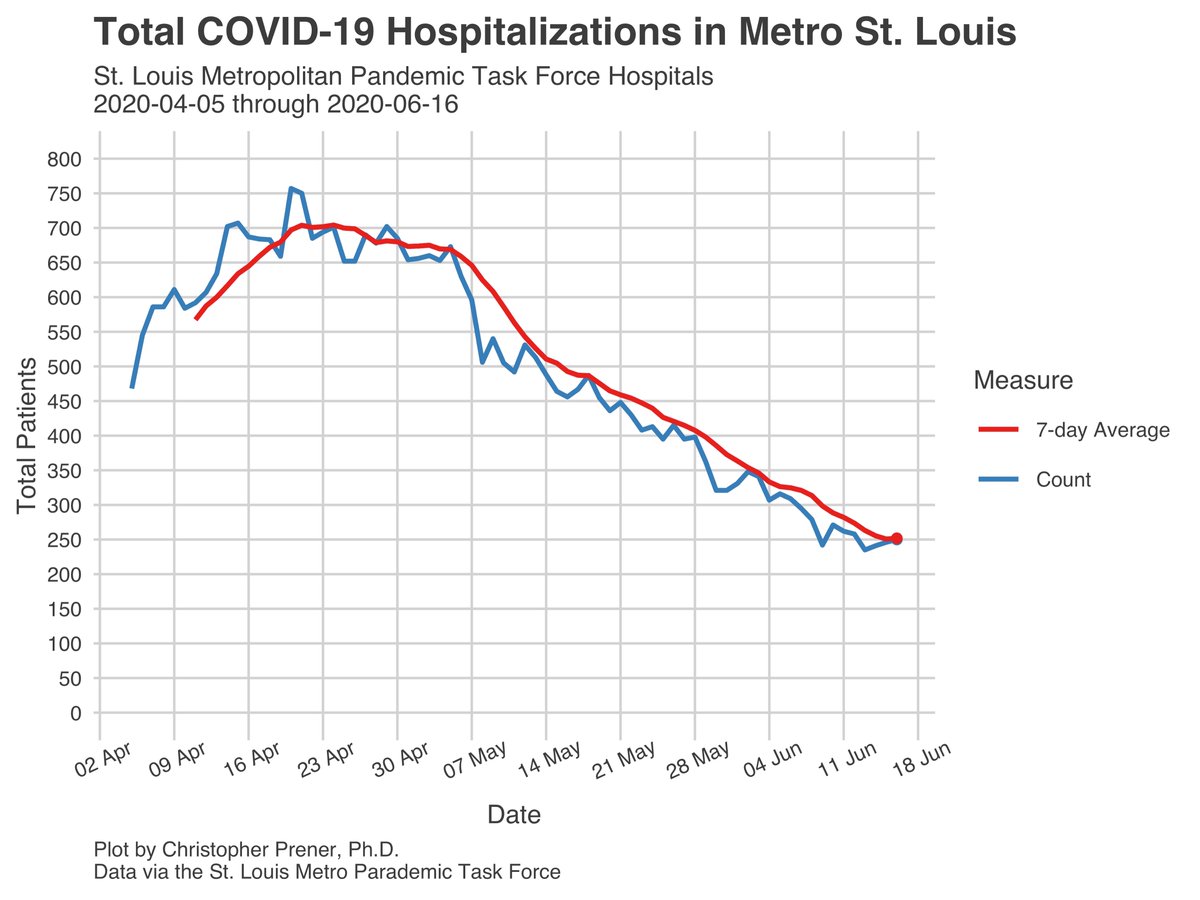
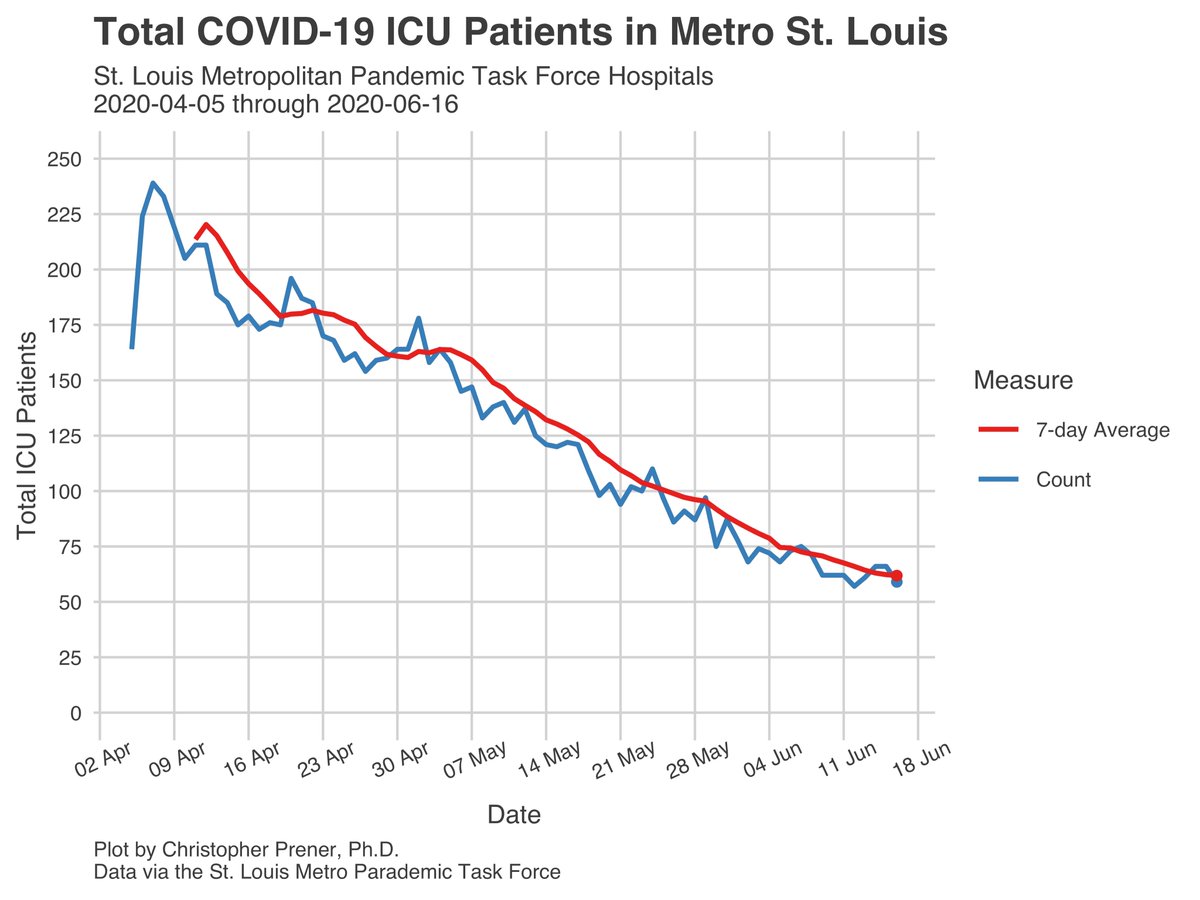
What is frustrating is that we do not have reliable hospitalization data statewide. We need it, but what we get from the state cannot be trusted because the number of hospitals reporting varies day to day. This is a problem that should have been solved weeks ago. 13/17
What is also frustrating are the racial disparities statewide and in #StLouis, which I highlighted in my thread yesterday. 14/17
When we combine them with the unemployment numbers emerging and the effect of COVID on the education system and local tax bases, we have the makings of a multi-generational setback in terms of addressing both social and health structural inequalities in Black communities. 15/17
My standard caveats about uncertainty - infections (1) are historical data that reflect infections 2-3 weeks ago, (2) are biased by testing patterns, (3) may include probable but unconfirmed cases in some counties, and (4) rates are not individual probabilities of illness. 16/17
Additional maps and plots are on my tracking site - slu-opengis.github.io/covid_daily_vi….
My #rstats code and and data are all available on @GitHub - github.com/slu-openGIS/co…. They're licensed for re-use with attribution, and feedback and improvements are always welcome. 17/17
My #rstats code and and data are all available on @GitHub - github.com/slu-openGIS/co…. They're licensed for re-use with attribution, and feedback and improvements are always welcome. 17/17