
1/ Time to dig deep into some Netflix data. #Netflix #Datecdote $NFLX @Netflix
A Thread on Netflix' Feature Film Performance
A Thread on Netflix' Feature Film Performance
2/ Before we get to the data—and we have lots of tables/charts coming—I want to explain where the data comes from and the “5 Data W’s” of this thread.
3/ My biggest gripe on most “data” journalism is they don’t do this.
They obscure global numbers vs US, subscribers versus views and time period measured.
They obscure global numbers vs US, subscribers versus views and time period measured.
4/ I’ve been tracking every Netflix “datecdote”—my term explained here—since they started putting them in quarterly earnings letters.
entertainmentstrategyguy.com/2018/12/04/int…
entertainmentstrategyguy.com/2018/12/04/int…
5/ I’ve updated those with two specific sources. First, the Whats On Netflix folks keep a running tally here.
whats-on-netflix.com/news/every-vie…
whats-on-netflix.com/news/every-vie…
6/ But the big news from last week is that Bloomberg got a hold of a Netflix top ten list of films over time.
bloomberg.com/news/articles/…
bloomberg.com/news/articles/…
7/ Honestly, that scoop is more exciting than the earnings report.
So the plan is to analyze that top ten list and the recent earnings report for every nugget I can find.
So the plan is to analyze that top ten list and the recent earnings report for every nugget I can find.
8/ As for my thoughts on the quality of this data: a caution is this is a “small data” set. Over time I’ve tracked just 30 films that have some sort of data point. That’s a tiny data set to draw insights from.
9/ Also, Netflix has changed their measurement system repeatedly. Now, they use “2 minutes” viewed, previously they used 70% completion. They have also released “estimated viewership” that sometimes differs from final totals. (I’ll show that for the first time!)
10/ My “Data 5Ws” for this thread:
Where- I’m using GLOBAL data,
What- all converted to 70% completion of a feature film,
Who- counting subscribers.
When-The time period is from Q4-2018 (The Bird Box quarter)
…unless otherwise noted.
Where- I’m using GLOBAL data,
What- all converted to 70% completion of a feature film,
Who- counting subscribers.
When-The time period is from Q4-2018 (The Bird Box quarter)
…unless otherwise noted.
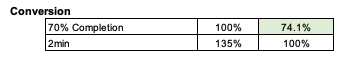
11/ How do I do the conversion from 2 mins viewed to 70% completion? I use this table:
The math is that Netflix told us that the 2 minute viewed metric is about 35% higher than the 70% completion metric, ON AVERAGE. (We’ll explore this in a bit.)
The math is that Netflix told us that the 2 minute viewed metric is about 35% higher than the 70% completion metric, ON AVERAGE. (We’ll explore this in a bit.)
12/ On to the insights.
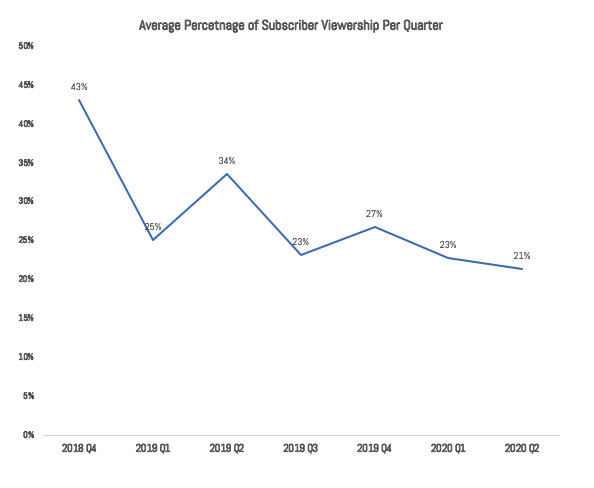
Insight 1 - Netflix films are drawing in progressively smaller audience as a percentage of the subscriber base, and it’s unclear if the total viewers of films is increasing over time.
Insight 1 - Netflix films are drawing in progressively smaller audience as a percentage of the subscriber base, and it’s unclear if the total viewers of films is increasing over time.
13/ Here, for example, is Bloomberg’s Top Ten list alongside the top ten films by 70% completion and my 70% conversion estimates:
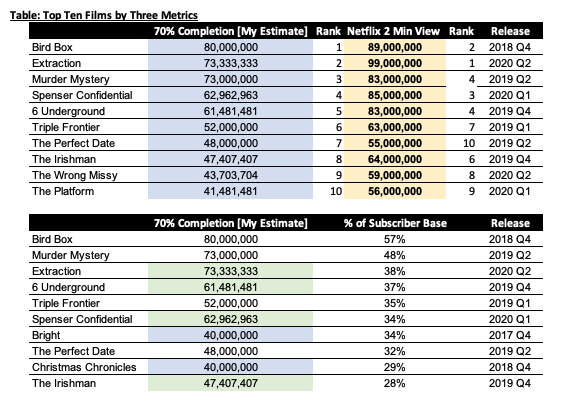
14/ The completion percentage top ten looks much different than the raw number top ten.
So here’s how the total subscribers is tracking over time.
So here’s how the total subscribers is tracking over time.
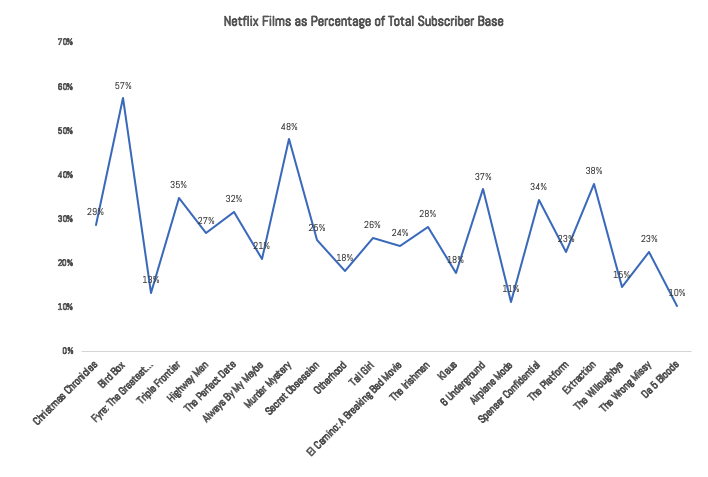
15/ Here's that table by film:
16/ These two charts are part of a new feature the “visual of the week” on my website, which will be coming out every two weeks.
entertainmentstrategyguy.com/2020/07/20/vis…
entertainmentstrategyguy.com/2020/07/20/vis…
17/ Overall, this isn’t devastating news for Netflix, just a realization of the idea that films don’t appeal to every person subscribing to a service.
18/ However, it is bad news for the idea that at some point Netflix can pull back on content spend. If you’re running a service that has to appeal to “everyone”, you need lots and lots of content to appeal.
Still, it's unclear how many true blockbusters they have.
Still, it's unclear how many true blockbusters they have.
19/ Insight 2: The 2 minute viewership number is likely even more unrepresentative of poorly viewed films than highly viewed films.
20/ How do we know this? Well, the Bloomberg article had four films that had previously had their 70% completion metric revealed. Now we know their 2 minute viewed number and can compare.
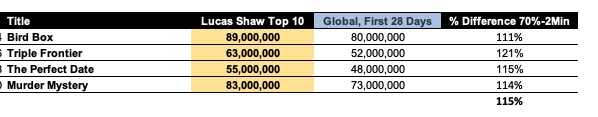
21/ Whereas Netflix previously said the overshoot is about 35%, for these four films the average overshoot is only 15%, and appears to be tighter the higher the films ratings.
22/ This actually matches my experience. Films that are very popular/good tend to do better across metrics. This means that the most popular film in Netflix history (Bird Box) probably has one of the best completion percentages too.
23/ This does provide a caution to my conversion table, though. Likely it has a high degree of error. Some films are likely as low as 10%, while clearly some films are probably over 50% less viewership at 70%. (Meaning lots of folks start a film, but then don’t finish it.)
24/ I've been upfront about this when I started converting numbers.
It's why I wish in addition to the average we always gave standard deviations and distributions.
It's why I wish in addition to the average we always gave standard deviations and distributions.
25/ Insight 3: Netflix estimated completion numbers are also highly speculative.
With the Bloomberg leak, we now have two films that we were given estimated 28 day numbers that we can compare to the “actuals”.
With the Bloomberg leak, we now have two films that we were given estimated 28 day numbers that we can compare to the “actuals”.

26/ You literally can't get a data set smaller than “2”. But still you can see that when Netflix estimates a series’ final numbers, they actually have undershot the one we know for sure. (Extraction was about 10% better than estimated.]
27/ As for the Irishman…it’s complicated. While Netflix says 64 million folks watched at least 2 minutes, that would mean 47 million finished it, on an estimate of 40 million completed views. That’s almost 20% higher than estimated.
28/ My gut is the actual 70% number is closer to 40 million than 47. Why? It was so long that a lot of people never made it through.
29/ Insight 4: US films continue to dominate the top ten lists.
Of the top ten, 10 are US
Top fifteen, 14 are US
Top 20, 19 are US or English language
Top 25, 23 are US or Eng
Of the top ten, 10 are US
Top fifteen, 14 are US
Top 20, 19 are US or English language
Top 25, 23 are US or Eng
30/ Two explanations for this. First, the UCAN region is still a huge portion of total Netflix subscribers. (About one third, and I think higher in actual usage.)
Unfortunately, US viewers tend not to go for foreign language originals. (British films/series are the exception.)
Unfortunately, US viewers tend not to go for foreign language originals. (British films/series are the exception.)
31/ The second explanation is that US Hollywood still really is the movie producing capital of the world.
32/ Insight 5: Netflix does not have a “data based” edge at producing original content.
This is my most controversial opinion I write, but the data of the last year has only backed this up.
This is my most controversial opinion I write, but the data of the last year has only backed this up.
33/ As I’ve said before, Netflix has very ordinary performance of feature films. This means that most of their films are “duds” or “bombs”, while a few have outsized performance. You can see this in the histogram of their film performance by viewership category.
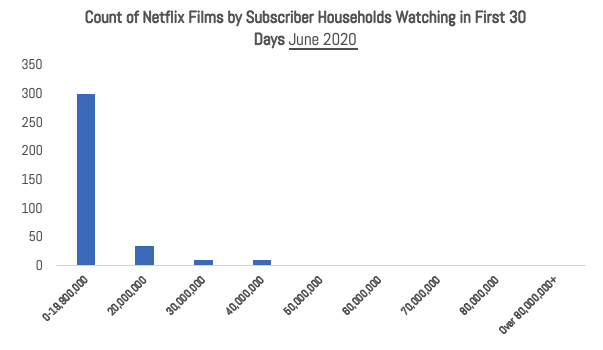
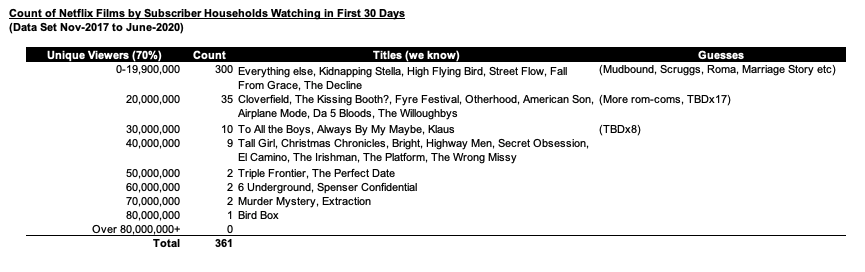
34/ This is what I’ve called the logarithmic distribution of returns. Here’s that table showing which films they’ve released by category, and where I’ve had to estimate the films Netflix DIDN’T tell us about.
entertainmentstrategyguy.com/2018/09/12/the…
entertainmentstrategyguy.com/2018/09/12/the…
35/ Which is worth noting. Netflix has released over 350 films since Q4 of 2017. They’ve given us data points (or Nielsen has) for only 30 of those films.
Meaning, I could double the numbers in 20, 30 million and that still fits the curve.
Meaning, I could double the numbers in 20, 30 million and that still fits the curve.
36/ The caveat one could make is that a lot of films are doing better than 40 million subscribers, but Netflix hasn’t told us about them.
This is the secret insight of the Bloomberg Top Ten list: we know the top ten films which means every other film has to be below that
This is the secret insight of the Bloomberg Top Ten list: we know the top ten films which means every other film has to be below that
37/ And since the other films they’ve given us data points for are all right at the edge of 40 million views (which convert to about 55 million 2 min views), we can know for certain that we have every film above this hit rate.
38/ (Indeed, I think Netflix has told us every film they’ve had over 40 million viewers. The only exception seems to be The Platform.)
39/ Back to the insight. If Netflix truly had an edge on producing content—meaning their data gave them unique insights—then we’d expect to see larger “tail” effects. We’d expect a bump in films that get 60, 70 and 80 million viewers.
But we don’t.
But we don’t.
40/ Indeed, some studios do rarely achieve this performance. Pixar in the 2000s-2010s. The Marvel Cinematic Universe under Kevin Feige. CBS under Moonves.
But not Netflix.
But not Netflix.
41/ Netflix knows this by the way. They just mislead journalists whenever they do interviews.
$NFLX deliberately buys in bulk—361 films!!!—with the goal to see what works and use data to promote it. But they can’t use data proactively to develop films.
$NFLX deliberately buys in bulk—361 films!!!—with the goal to see what works and use data to promote it. But they can’t use data proactively to develop films.
42/ Insight 6: The Oscar films have not done very well.
The Irishman is the only film who got a data point.
The silence on Roma, Marriage Story, Buster Scruggs, Mudbound, etc is deafening.
The Irishman is the only film who got a data point.
The silence on Roma, Marriage Story, Buster Scruggs, Mudbound, etc is deafening.
43/ Insight 7: I was right, by the way, that Netflix’s rom-com strategy wasn’t as successful as they made it sound when they said “80 million customers watched a Netflix rom com”
entertainmentstrategyguy.com/2018/12/06/did…
entertainmentstrategyguy.com/2018/12/06/did…
44/ I speculated at the time this mean that the top rom com, likely “To All The Boys I Loved Before”, got around 25 million subscribers.
And since it didn’t make the top ten list, I feel justified in that estimate.
And since it didn’t make the top ten list, I feel justified in that estimate.
45/ Okay, that’s it for this thread for now. I may write this up as an article since damn this is long.
Hit me up with questions or comments.
Hit me up with questions or comments.

