Commenters didn’t like these objective data points and missed the point that stablecoins are increasingly used for transmission of funds and securitising trade settlement.

It’s not just used for hedging from bearish crypto price action like the old days.
Bitcoin’s cap is tiny next to demands of global remittance and trade. Here you get a sense of just how small and early Bitcoin in its life cycle compared to where it needs to be to serve the finance world in a meaningful sense.
On a markets analysis note, some of us have been using USDT cap vs BTC cap as an oversold / overbought fundamental macro indicator, this signal is likely to be less effective in future given the changing use cases of Tether.
And on a personal note, I can’t help but notice how crypto’s tribalism and maximalism is blinding people from what’s in front of them.

• • •

Missing some Tweet in this thread? You can try to force a refresh
 

Keep Current with Willy Woo

Willy Woo Profile picture

Stay in touch and get notified when new unrolls are available from this author!

Read all threads

This Thread may be Removed Anytime!

PDF

Twitter may remove this content at anytime! Save it as PDF for later use!

Try unrolling a thread yourself!

how to unroll video
  1. Follow @ThreadReaderApp to mention us!

  2. From a Twitter thread mention us with a keyword "unroll"
@threadreaderapp unroll

Practice here first or read more on our help page!

More from @woonomic

19 Mar
A tale of 3 charts...

From March 2020, #Bitcoin undergoes steep and continued supply shock in sync to USD money printing.

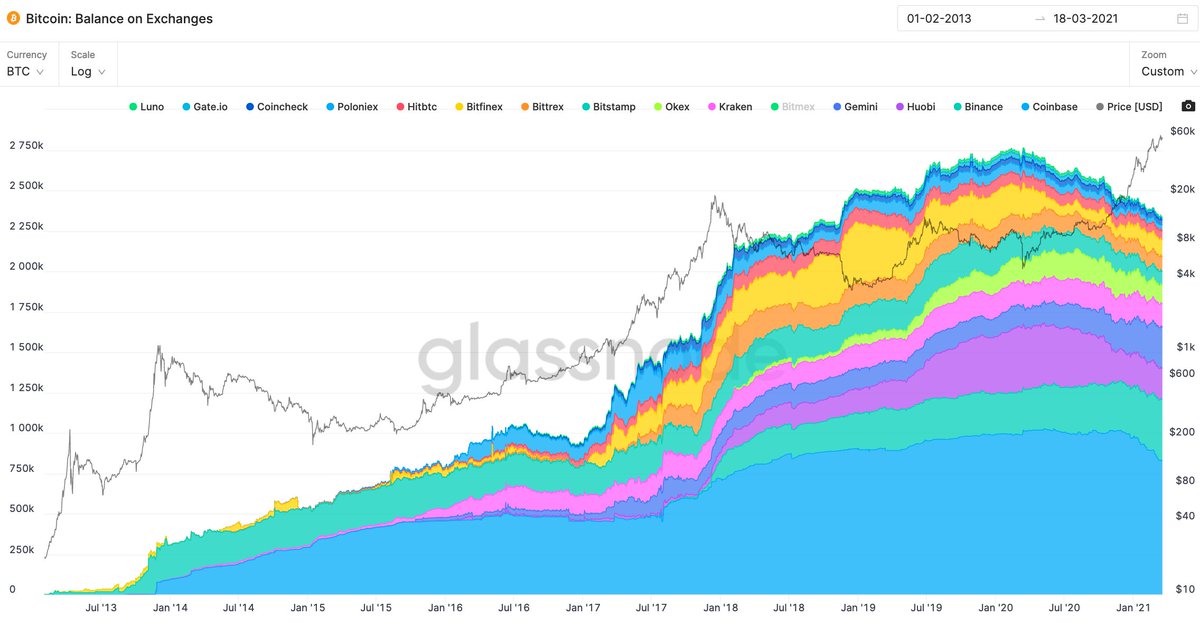
1) Speculative inventory on exchanges deplete. Image
2) Supply held by speculative "weak hands" deplete.

These are the coins held by wallet users that have a history of selling coins.

This is conservative as BTC held by "strong hands" using exchanges as custody will be classified as "highly liquid" / "weak hands" in this chart. Image
3) USD money printing took a steep inflationary jump starting March 2020. Image
Read 4 tweets
16 Mar
Appreciate the dialog @ki_young_ju.

1) me: Whales dumping Gemini is bogus data
2) @glassnode: it's an internal transfer
3) @cryptoquant_com: it's an external transfer
4) @coinmetrics: it's BlockFi

Me: warning 28,300 traders of whales dumping needs fact-checking.
Full chrono breakdown of events as they came to me.

TLDR; Ultimately we have a responsibility to fact-check and take all due care before releasing data.
Markets dumped immediately after @cryptoquant_com issued a warning of Whales dumping into Gemini.

It's actually the second time in a month that this occurrence has happened.
Read 11 tweets
16 Mar
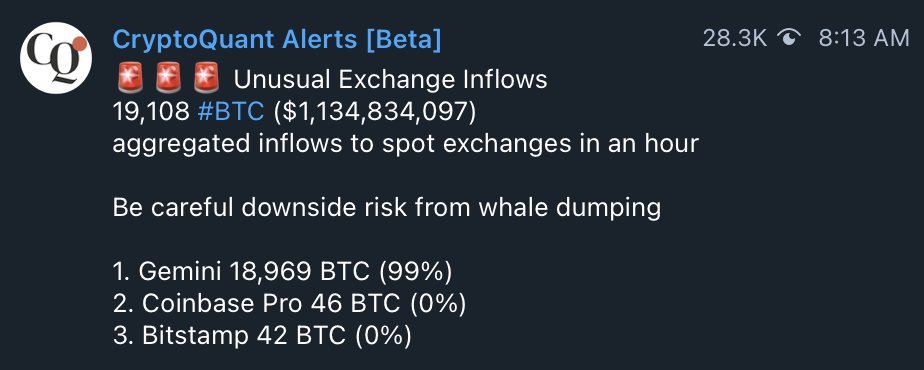
The @cryptoquant_com "data error" debate.

Did a whale send in 18k of BTC into Gemini to dump the markets? Or was it a data error?

This alert was sent out to 28,300 traders warning of whale dumping. Speculators sold off minutes later.
This chart shows Gemini prices vs the average of Coinbase and Binance.

When the warning was sent out to traders, Gemini price did not dip relative to others which is what dumping there would look like. In fact it rose indicating net purchasing on that exchange.
Gemini trades $100m-$200m per day; that's insufficient liquidity to absorb a $1b sell. Price moves 2% on a $2m order there.

It makes no sense sell on Gemini.

Data: @coingecko
Read 7 tweets
30 Jan
While we are in the first great consolidation of the 2021 bull market, here's a bunch of charts to get the feel of where we are in this bull cycle.

👇
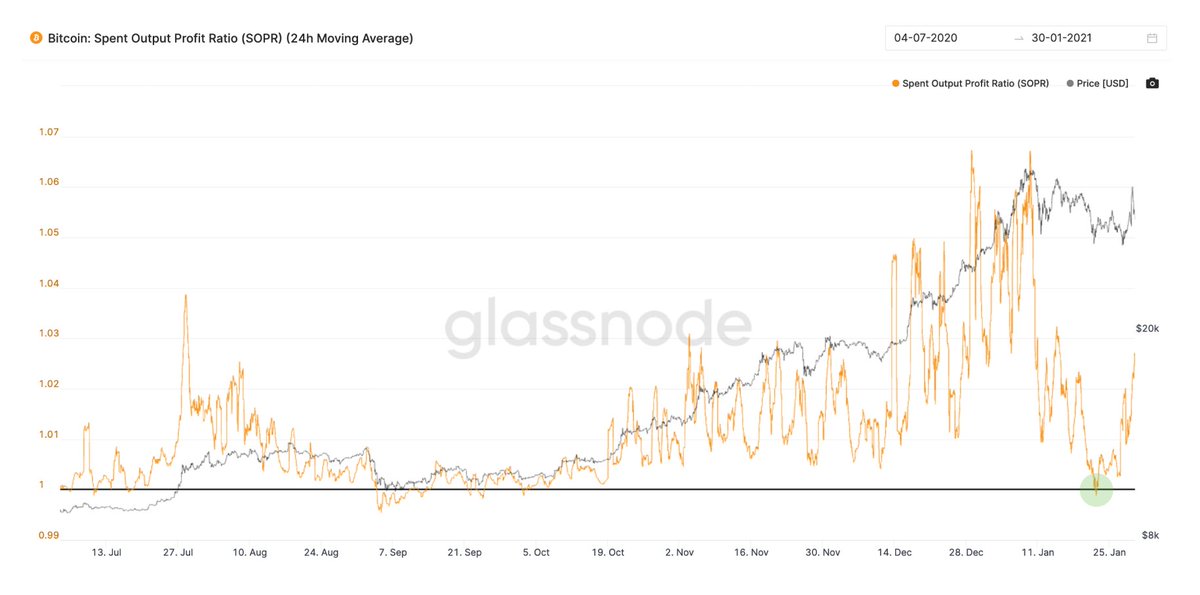
SOPR tracks profit-taken when coins being sold. It hit the 1.0 line which means we completely reset. To go lower we'd need to have investors sell at a loss. This would need a bear phase (that's is NOT on the cards with the current setup) Image
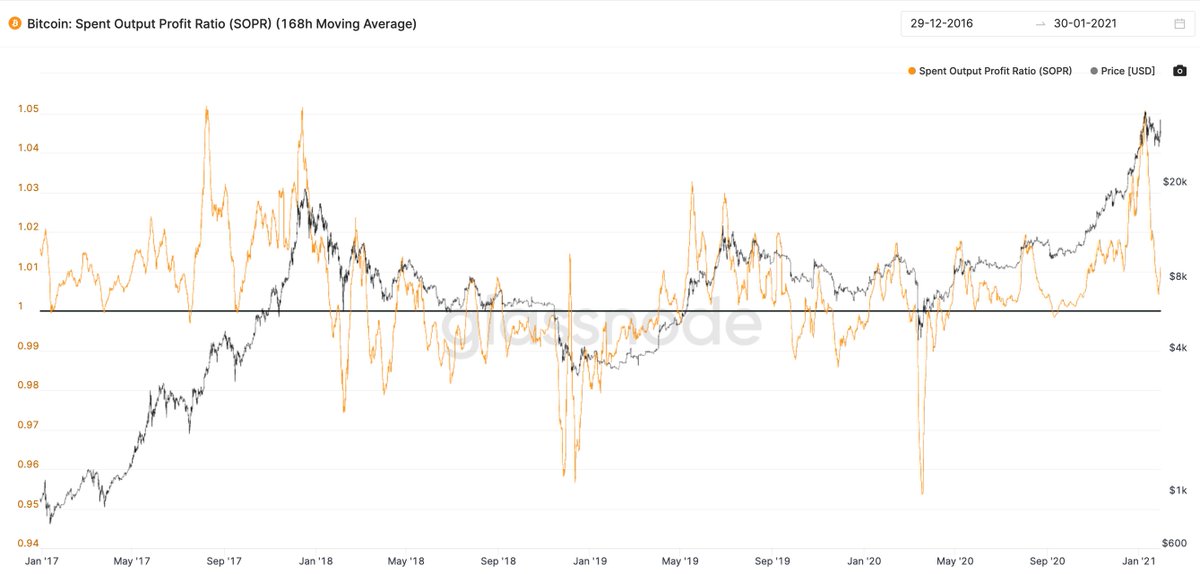
Here's how it looks in the longer time frame (1 week SOPR). Pretty close to a full reset, Elon kind of screwed with it, bounced us early. Image
Read 7 tweets
7 Nov 19
A thread on altcoins.

They are nuanced. We have:
-Protocol coins
-Utility tokens
-Security tokens
-Non-fungible tokens

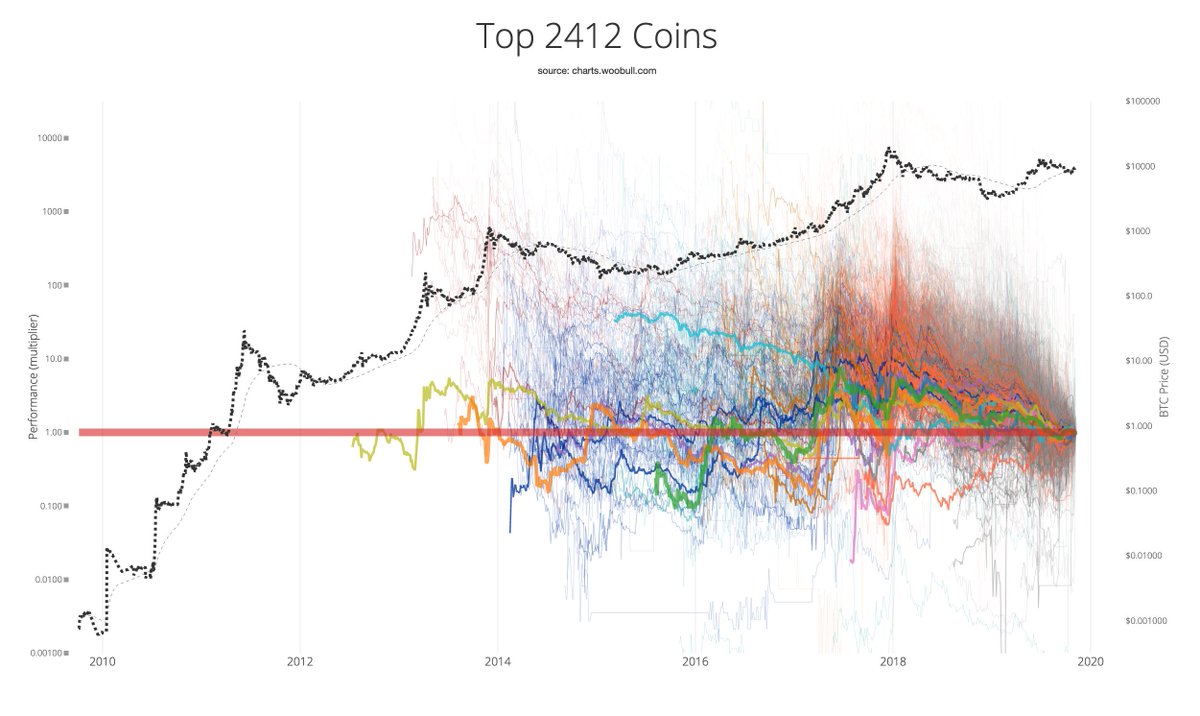
But to an investor, there's only 2 types of altcoins. Oscillators and Degenerators. You can spot them on this chart of the entire market.

/1 Image
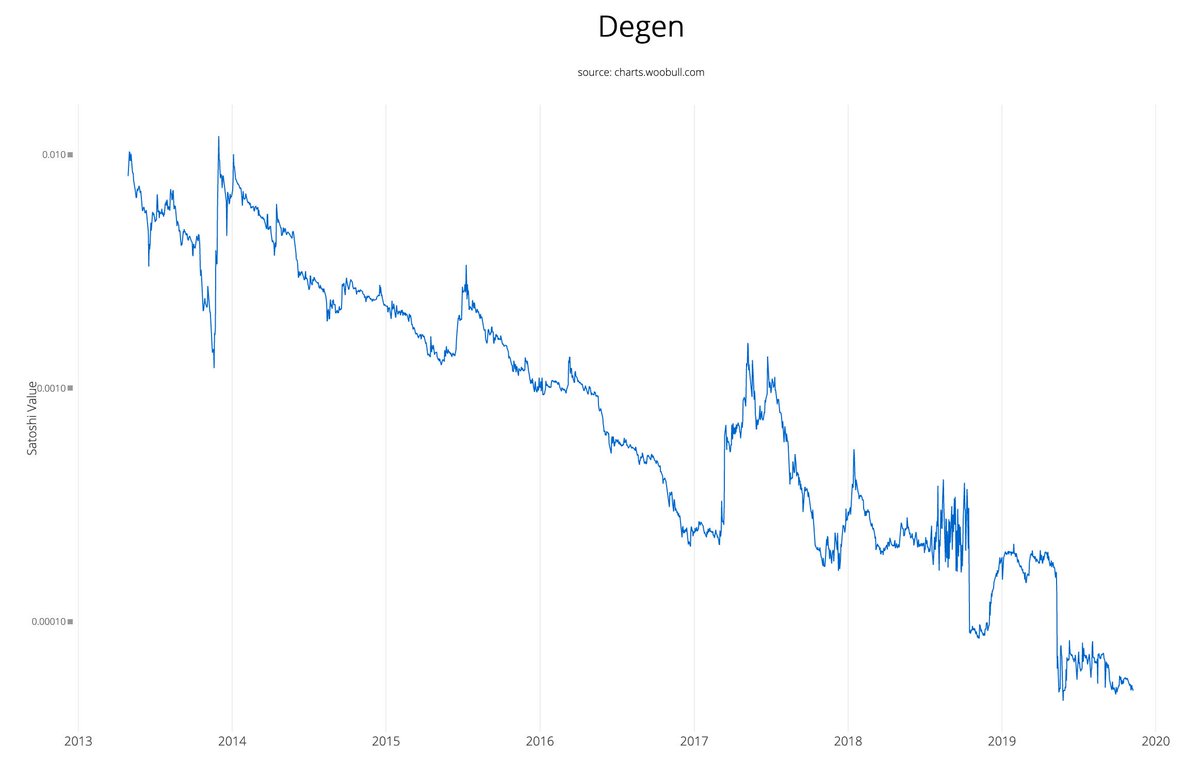
The vast majority of alt-coins are Degens. Their price chart has a measurable half-life, like radioactive decay. Plotted on a log chart, it's a straight line down. (This one is Namecoin, a promising coin of its era, there's over 2000 examples like this).

/2 Image
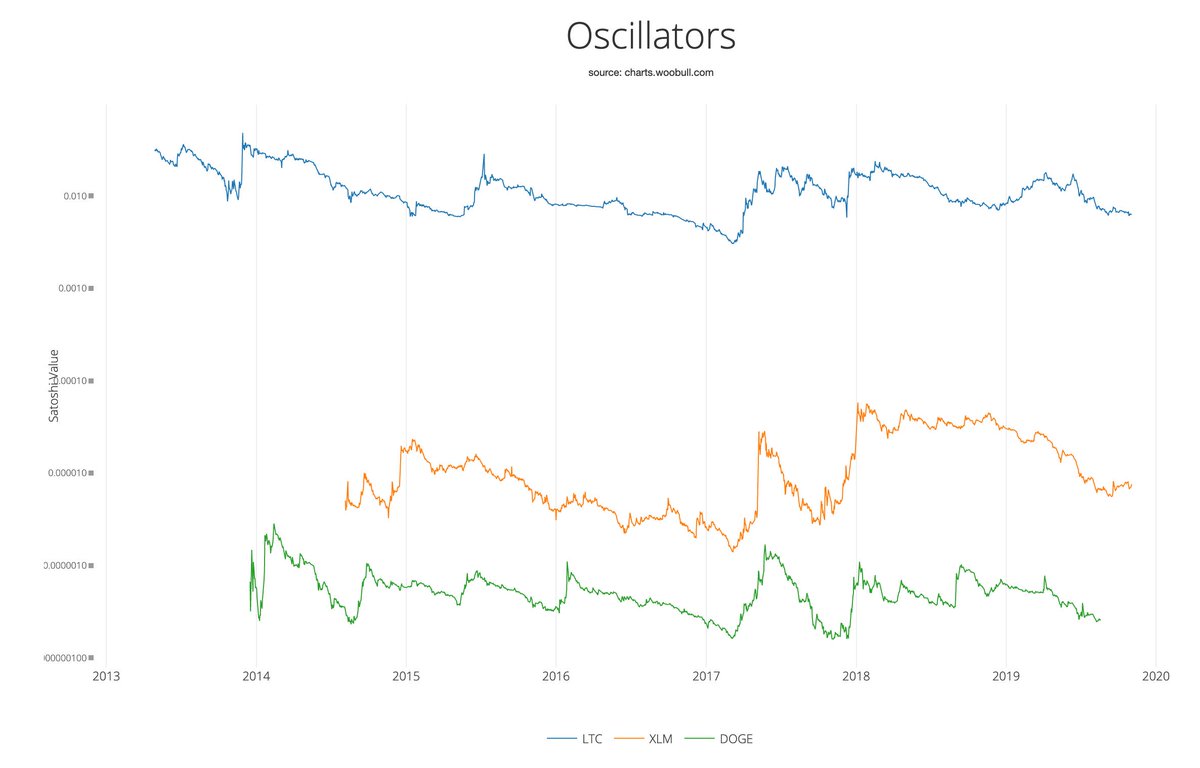
A handful are oscillators. Oscillators are proving SoV properties.

To qualify they need to keep up with BTCUSD gains. To find them, plot their BTC value. It must oscillate around a horizontal line, for at least one full bull-bear cycle (around 4yrs). More cycles are better.

/3 Image
Read 8 tweets
24 Jul 19
A nice collation of research, facts and figures, on the topic of Bitcoin energy consumption published by the International Energy Agency.

Some of my key takeaways in this thread...
Bitcoin's annual energy use is 69.6TWh (upper bound)

With a bit of math, lets see how big this is...

Global energy consumption rate is 18TW, thus Bitcoin consumes 232 mins of the year's energy demand. (69.6TWh/18TW*60mins=232mins)

In other words 0.044% of the world's energy. Image
Interestingly I see Bitcoin currently uses the same amount of energy as the Internet did in 2016.

70TWh per year.

forbes.com/sites/christop…
Read 8 tweets

Did Thread Reader help you today?

Support us! We are indie developers!


This site is made by just two indie developers on a laptop doing marketing, support and development! Read more about the story.

Become a Premium Member ($3/month or $30/year) and get exclusive features!

Become Premium

Too expensive? Make a small donation by buying us coffee ($5) or help with server cost ($10)

Donate via Paypal Become our Patreon

Thank you for your support!

Follow Us on Twitter!