
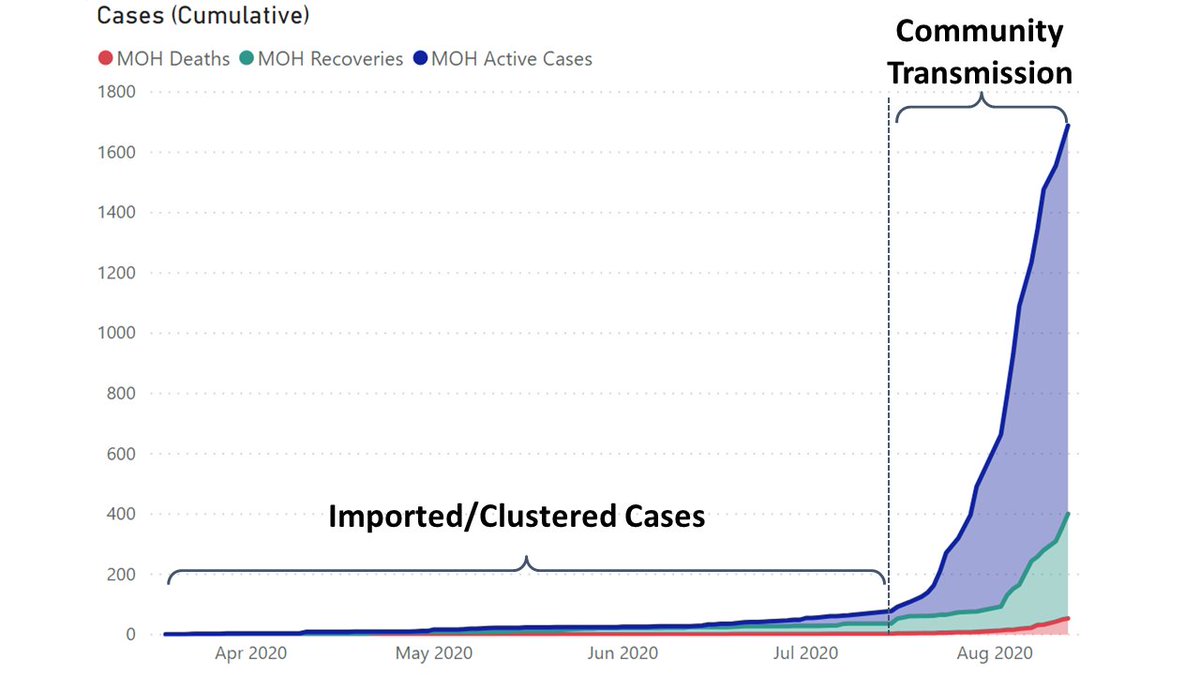
There have been two distinct phases 1) the imported cases and localised clusters phase, and 2) the current community transmission phase beginning in mid-July. Since then we have seen a steady increase in the number of cases reported each day 2/10 

n.b. it is difficult to be certain of the true picture at any time due to limited testing, but lower positivity rates (which we’ll come to) before mid-July and less reported pressure on the health system tend to support this analysis of the timing of the phases in #Gambia 3/10
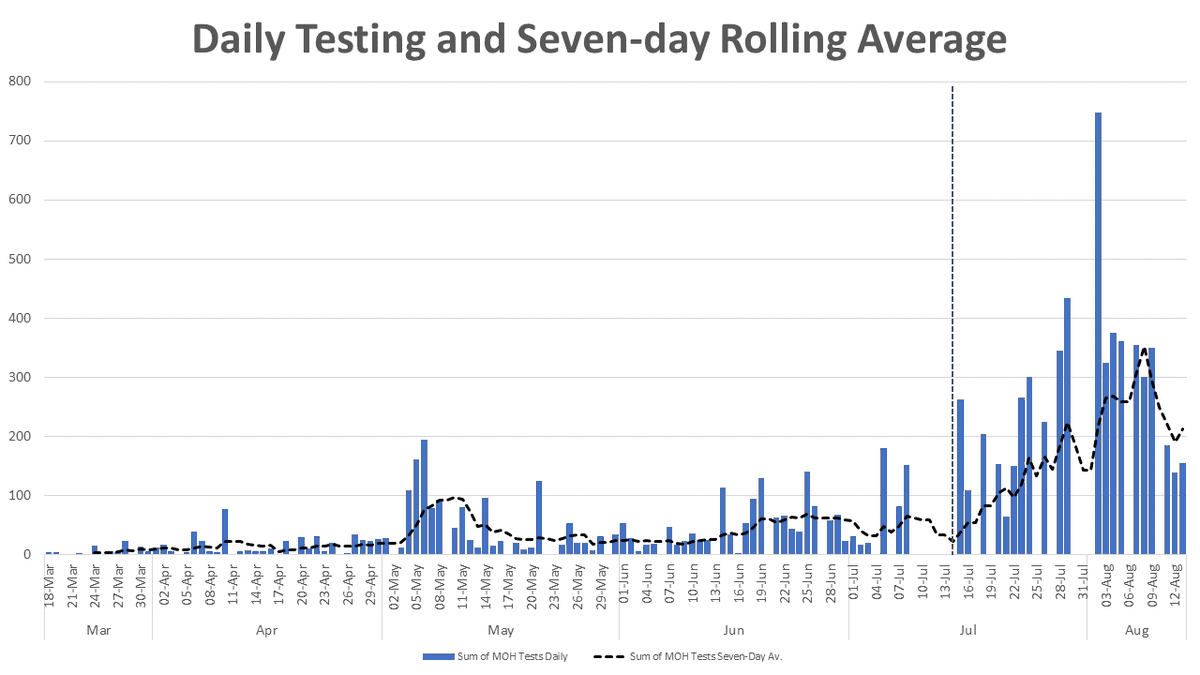
Since mid-July we can also see a steady scaling up of the number of #COVID19 tests being carried out per day, but there is still some way to go. As we can see, the number of new cases closely follows the number of tests being carried out… 4/10
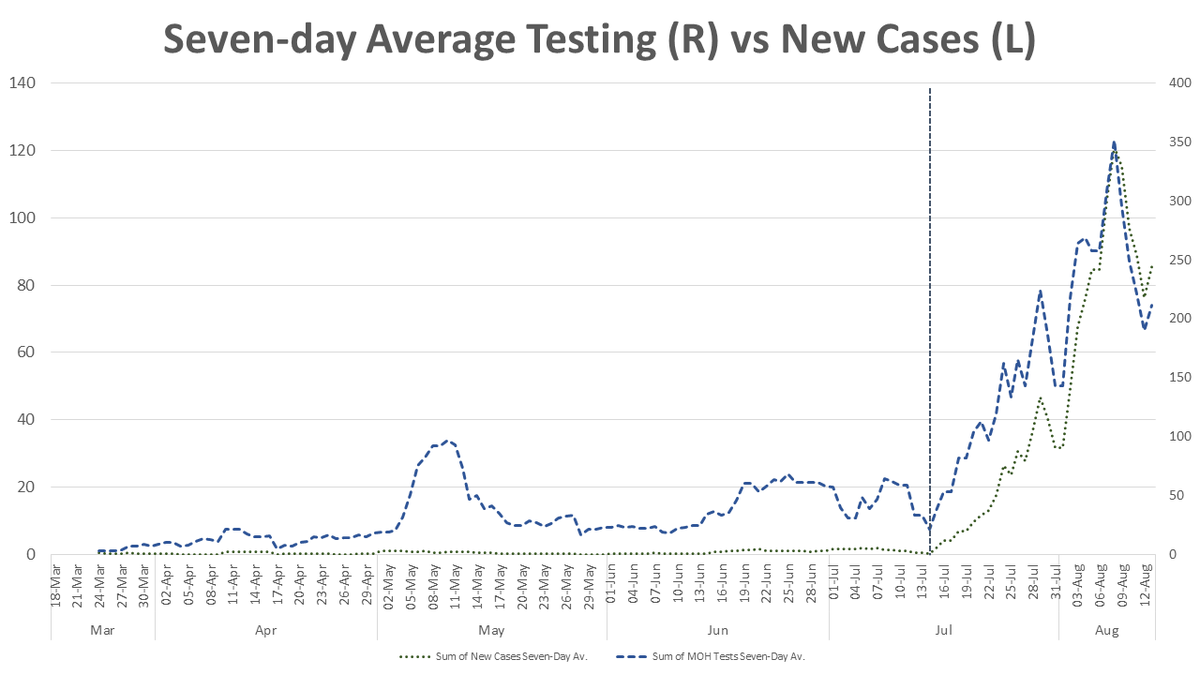
…the reason for this is the positivity rates. In recent weeks the number of tests coming back positive each day has been around 30% and increasing, a good indicator that there are likely many more cases in the population not currently being picked up 5/10

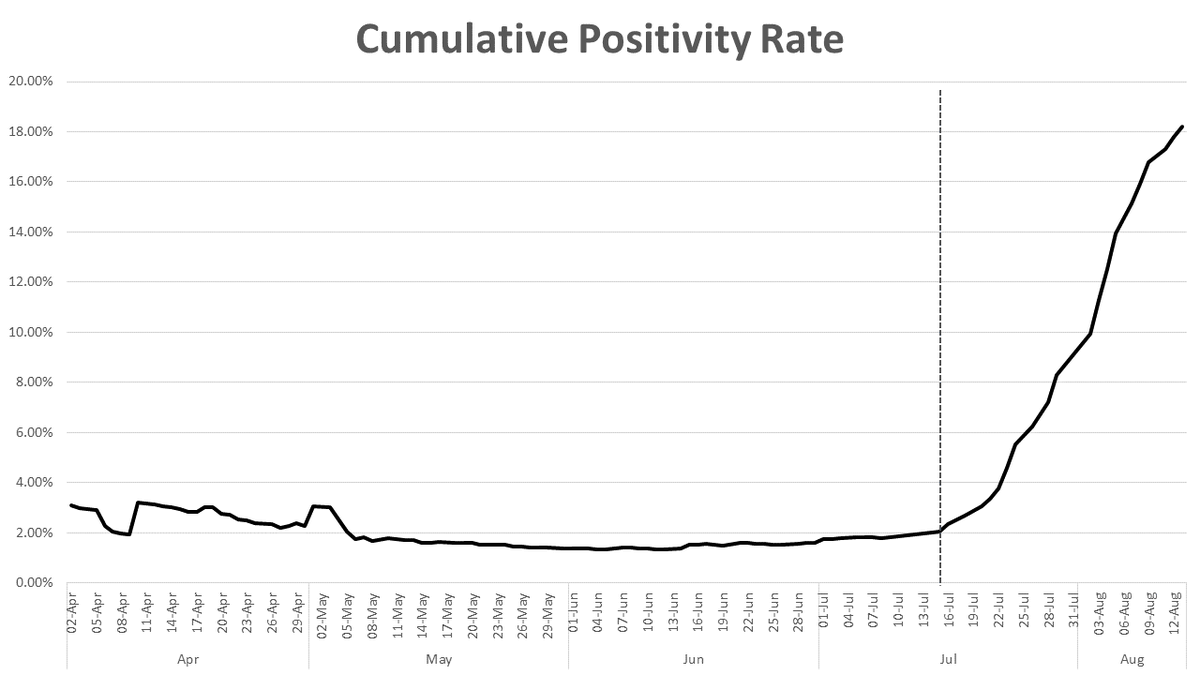
A declining positivity rate should be one of the first signs that the #COVID19 outbreak is under control, with cases being identified and isolated early, and stopping further spread. Cumulative positivity rate (total cases as % tests) needs a flattening and a gradual decline 6/10
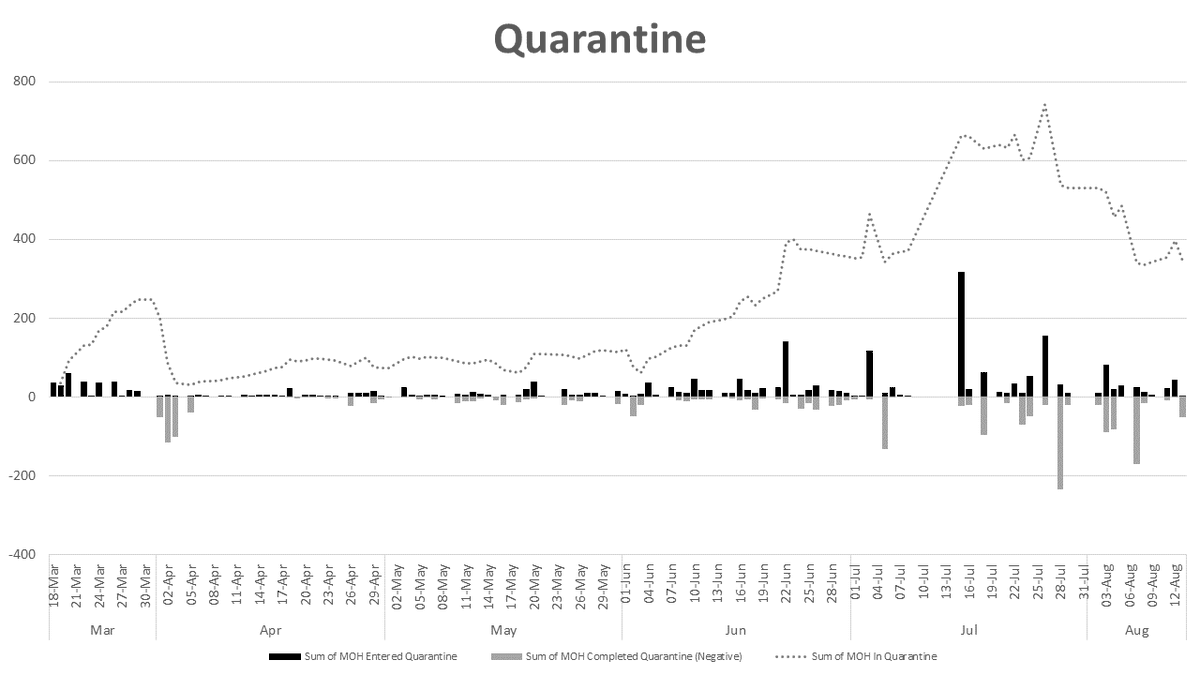
The data on people being quarantined shows the recent changes in policy reflected in the new guidelines for quarantine, isolation and testing issued by the @MohGambia in favour of home isolation for some cases and high-risk contacts 7/10
Please note that all charts are from my own dataset, compiled from @MoHCovid19GMB Situation Reports, for which the @MohGambia team deserves a lot of respect for their accuracy and timeliness. Any mistakes in are my own 8/10
moh.gov.gm/covid-19-repor…
moh.gov.gm/covid-19-repor…
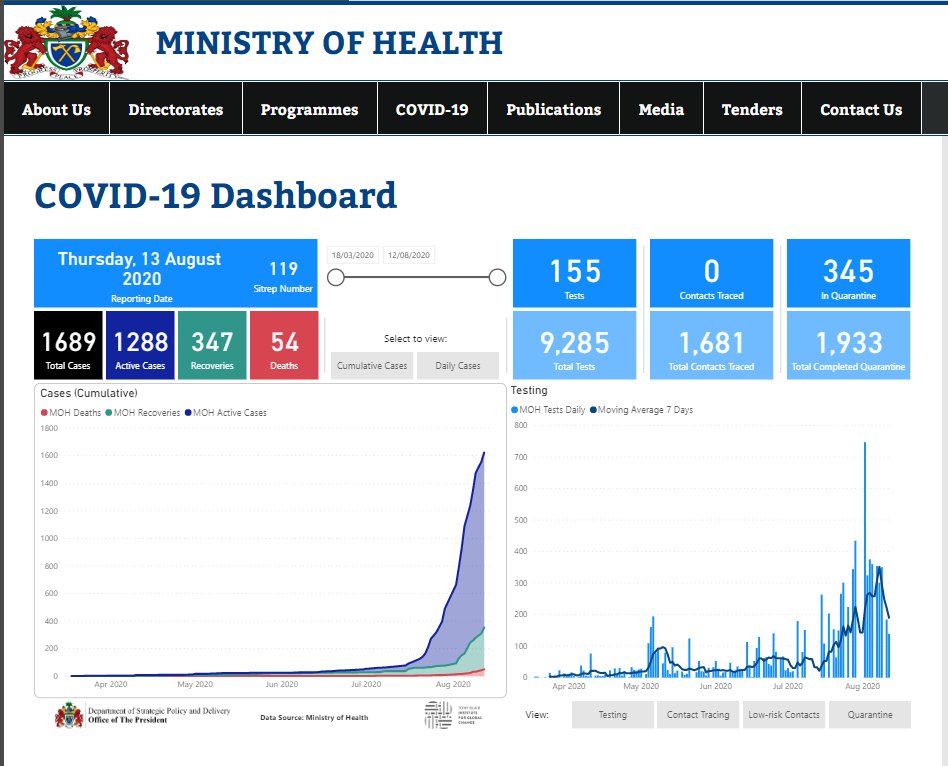
For more information and to examine the data for yourself you can check out the interactive dashboard I have developed with @MohGambia on the website moh.gov.gm Any feedback on which is always welcome 9/10
Finally, if you are interested in looking further into the #COVID19 data across #Africa I would recommend taking a look at our @InstituteGC interactive dashboard #StaySafe 10/10
institute.global/advisory/covid…
institute.global/advisory/covid…

