Dear all. Please read following: My friend @officialwazzan is looking for software developers to join his startup pofty.com
๐ an ecosystem for labour and services, serving every professional and every profession (the legal ones of ๐)
....Thread ๐๐
๐Ecosystem for physical and virtual labour and services
๐ All professions, not just an area or a niche
๐For the wide use, no boring categories or questionnaires just down to the point
๐Searching for senior developers for equity in return
๐Developers who are experienced with:
Swift(IOS), MySQL(or other DBs), Ruby on Rails, Python Flask, Java, Good with API, Mentality of a founder
If you are not a developer, you can still help by filling in this survey. Only takes a few minutes: pofty.com/survey
โข โข โข
Missing some Tweet in this thread? You can try to
force a refresh
Major #BlowOffTop before #Recession. The Recession will be very severe - and cause the largest Market Crash since the Crash of 1929.
This is my Outlook (January 2024)!
In early 2023, I said that I would be met with doubts and a question of "Why Recession?, as the stock market soared into late 2023 - and continues to do so into 2024.
Now we are here! My doubters are rising (and will continue to do so, as the market strengthens coming months)
The arguments are:
1) "We already had the Recession in '22"
2) "Fed is aware and will not allow it"
3) "Fed has changed the Game"
4) "We are in a new liquidity cycle"
5) "It will not be allowed in a Presidential Election year"
..... and so on!
All chitchat - and based in a complete lack of understanding of the Business Cycles.
So - why Recession? (....this is giving more than I should - so stay tuned๐)
First argument is based on our Business Cycle Model developed with Swissblock and @Negentropic_
Our Business Cycle has flashed a Recession signal in 2023. Leading Indicators have crashed under our Equilibrium Line.
In 80 years of data, the Recession Signal from our Model has NEVER been wrong. No false signals - ever!
Second argument goes on the Yield Inversion.
Yield inversion is a signal of coming Recession. Not immidiately - but eventually.
Analysts have observed this signal in 2023 - but due to impatience dismissed it. This is a great mistake.
From the bottom of the Yield Inversion, we normally see 12-15 months before a Recessions sets in. The bottom was in June 2023.
On Wednesday, we got a CPI print of 7% over the duration of a year. Fastest since 1982! Surely, everybody can see, that #inflation is here to stay!?
NO!
WHY?
Because of the real gauges of inflation which tells us, that current inflation is due to Supply and Demand issues!
Gold Miners will soar, when REAL ECONOMIC INFLATION is here. For now, they are dead in the water - which is 100% in line with Elliott Wave predictions. "Wave C" is unfolding in 5 waves down. As surplus demand is being flushed from the system, Deflation will reemerge
Beautiful chart for GDX. Observe top in 2011 and nice decline into wave A. Then a clear ABC-correction into top in 2020, before Miners again have started a decline. Observe top in 2020! Right at 61.8% fib. Beautiful! ๐
Decline in wave C should take us just below bottom from 2015
@RaoulGMI Good Morning! You asked what is happening to #Gold and #Silver. This is my take - a summary of the governing Thesis on TheZebergReport.com for a long time! Hope you can use the input! ๐โโ๏ธ๐
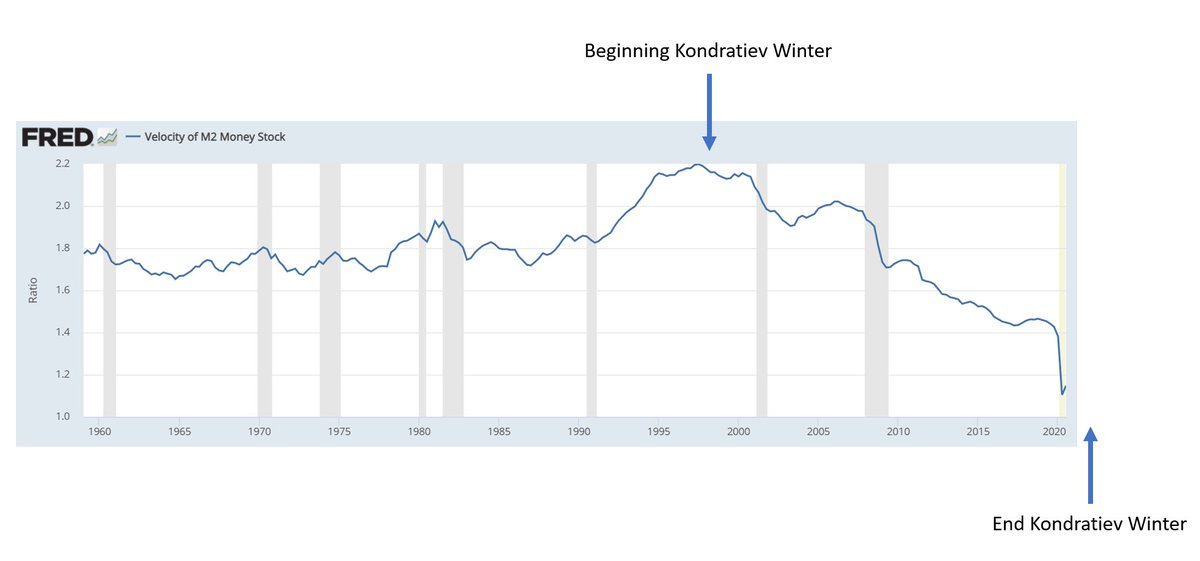
Since ~2000 we have been in Kondratiev's Winter. A period where GLOBAL DEBT causes low and falling growth rates. Central banks try to counter this by printing money (Monetary Stimulus). However, Deflationary forces from debt causes deflations to unfold - despite extreme measures
To the frustration of Central Banks, they cannot create inflation despite extreme money printing. They stimulate by infusing money into the system but cannot make the money circulate. Velocity drops dramatically. What they miss...You cannot solve a solvency problem with Liquidity
Why do I think #Gold, #Bitcoin are about to tumble? Because of my cross-market-analyses approach with >100 charts pointing to a deflationary bust AND the Elliott Wave structures for Gold, Bitcoin and USD. Let's try investigate 1) Deflationary Thesis and 2) Elliott Wave-structures
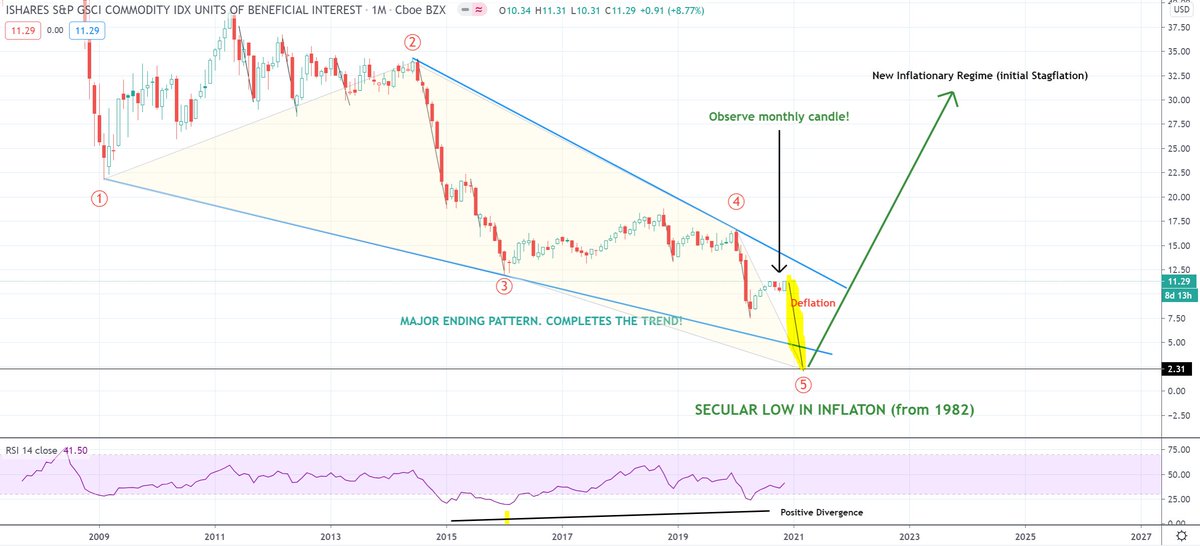
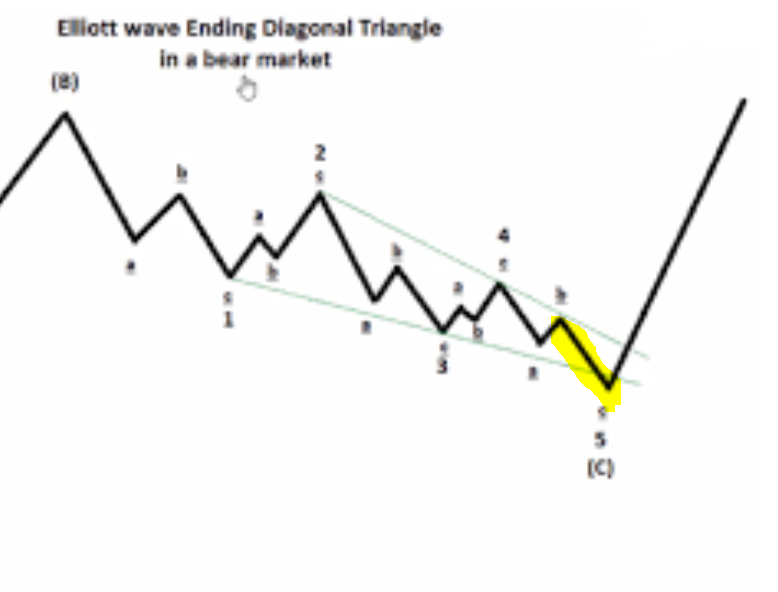
The Deflationary Thesis is due to the patterns shaping up in all commodities. Commodities drive inflation. First GSCI Commodity Index - a very clear Ending Diagonal Triangle (Descending Wedge). Calls for DEFLATIONARY BUST before MAJOR SECULAR BOTTOM. TheZebergReport.com
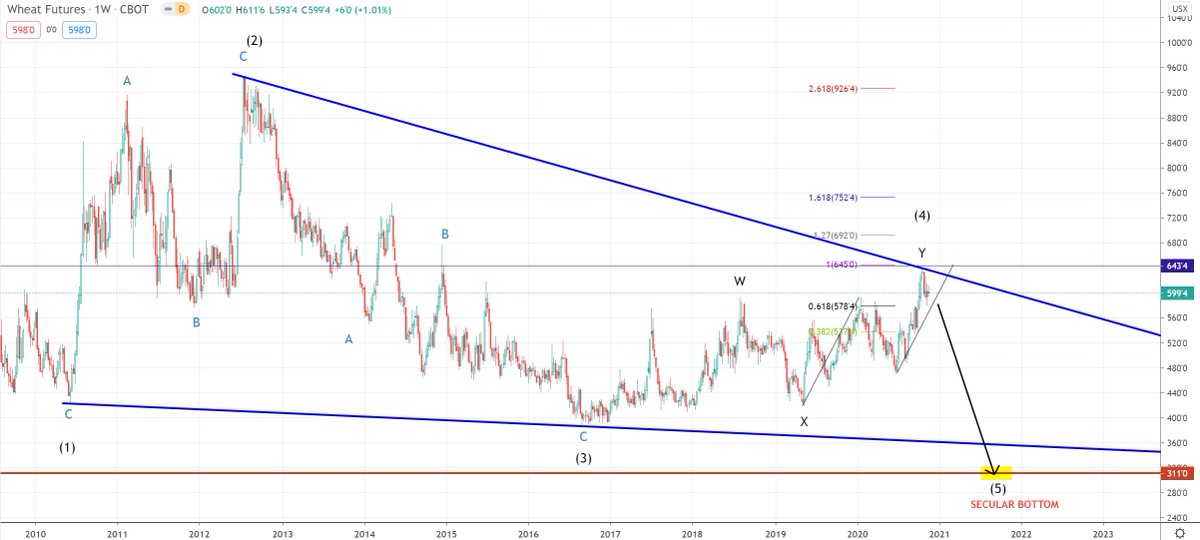
#Wheat which is part of #Commodities setting direction for Inflation. Same pattern! Descending Wedge. Calls for Deflationary Bust - before Major SECULAR BOTTOM. Deflation before New Inflationary Regime! TheZebergReport.com
These are the "events" we experience during Kondratiev's Winter. We have seen some of these but they will play out a range of times. First in 2000-03, then worse during 2007-09 and now the big one 2020-23(?). Some major dominoes are about to fall - before we reach end of Winter
Major events still to be seen (apart from rest which will be repeated and become much worse than before!): 1) Pension fund crisis 2) Run from paper money 3) War (hope not!) 4) Debt resolution (Monetary Reset?). We are NO where near end of this major crisis, which ends K's Winter
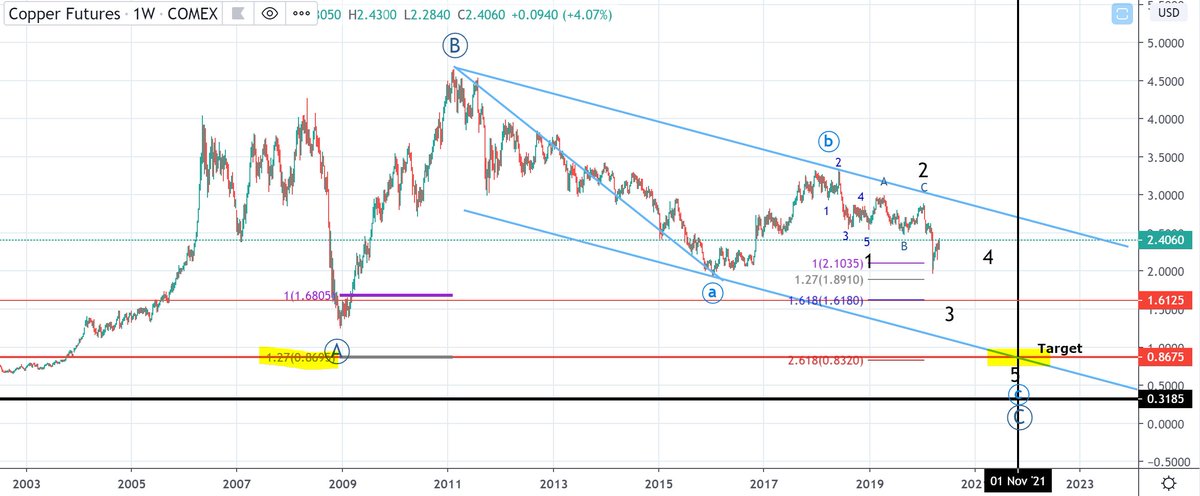
My LT #Copper chart tells me, that we may very well see the crisis (with various phases) continue until end-21 or beginning of '22. That is for the bottom in the economic activity which means, that repercussions may be felt way into 2023-25. No where near the end of this crisis!
Some investors, analysts seem to think, that #Equity Bear Market is over and we will rally to ATH. Imo this is naive taking the severe blow to economy into consideration - and the size of the equity bubble which has burst. Some comparisons to earlier Bear Markets provide heads-up
First, Bear Market 2000-02. Rather mild recession due to burst of IT-bubble (somewhat confined) despite extreme Market Cap. to GDP of ~141%. Monetary stimulus had effect as Fed Funds rate >6% at entry of crisis. Still Bear Market for ~638 days and decline of ~50% before bottom
Second, Great Recession 2007-09. Strong recession. Close to Financial World collapse driven by Housing bubble bust. Market Cap. to GDP only at 109%. Monetary stimulus opp. were stretched - QE was introduced. Yet Bear Market for ~517 days with a ~57% decline in stock market value.