Chart 1
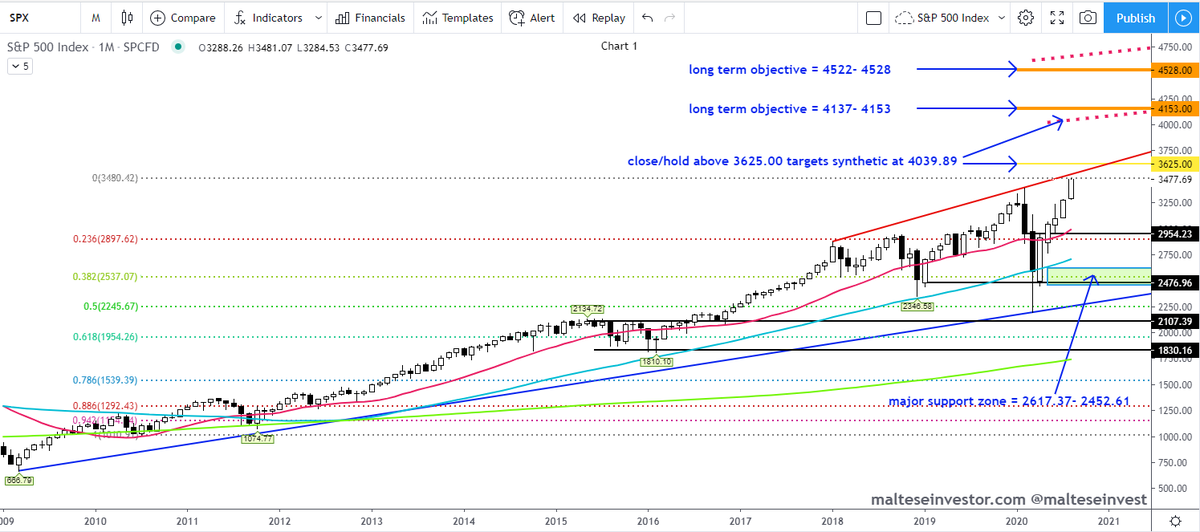
Monthly Chart: Since the complete breakdown of the Jan. 2009 on May 2019 price has been unable to react and is trapped in a $70 range. Heavy sell orders seen between 176.34- 186.63 then 227.79- 240.51. To the downside, .....
BIDU 2/4
Monthly Chart: Since the complete breakdown of the Jan. 2009 on May 2019 price has been unable to react and is trapped in a $70 range. Heavy sell orders seen between 176.34- 186.63 then 227.79- 240.51. To the downside, .....
BIDU 2/4

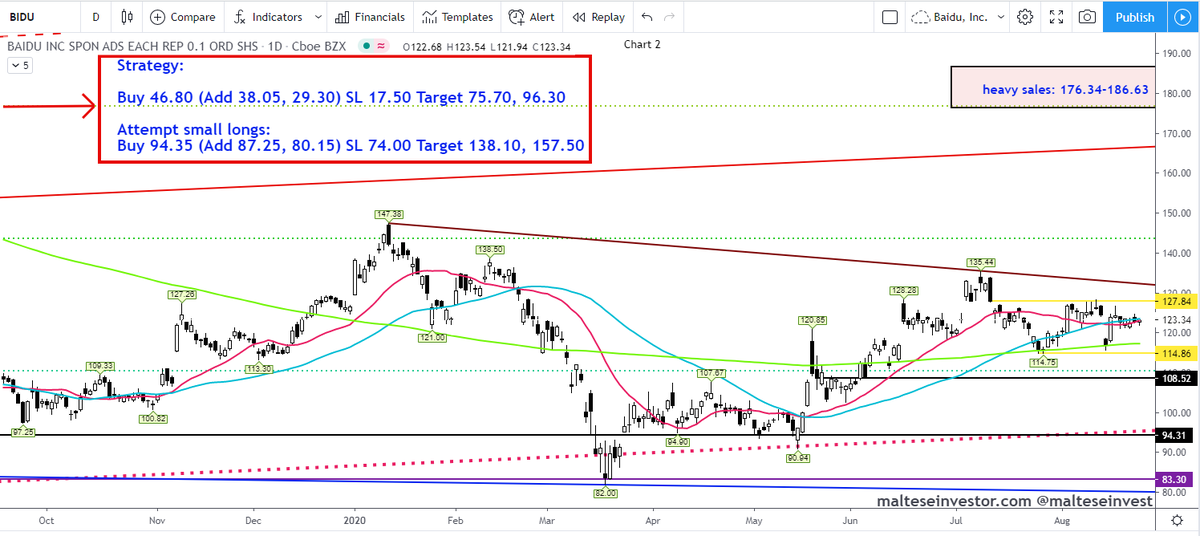
Chart 2
Daily Chart: The daily range is between 114.86- 127.84 with immediate #trendline #resistance at 132.29. Short term conditions are very tricky and messy, with positive #momentum but about to turn negative. Caution advised.
The #Strategy is printed on the image.
$BIDU 4/4
Daily Chart: The daily range is between 114.86- 127.84 with immediate #trendline #resistance at 132.29. Short term conditions are very tricky and messy, with positive #momentum but about to turn negative. Caution advised.
The #Strategy is printed on the image.
$BIDU 4/4