Analysis: #NASDAQ $ADMA
Case 444 #ADMABiologics Inc.
DISCLAIMER: The analysis is strictly for educational purposes and should not be construed as an invitation to trade.
#ADMA 1/4
Case 444 #ADMABiologics Inc.
DISCLAIMER: The analysis is strictly for educational purposes and should not be construed as an invitation to trade.
#ADMA 1/4

Chart 1
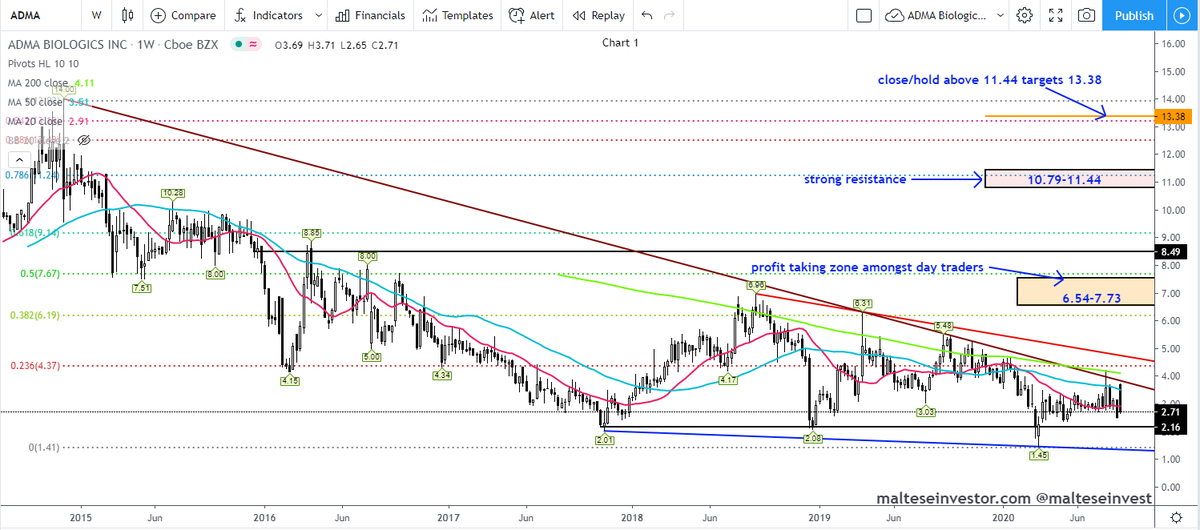
Weekly Chart: Conditions are very #bearish with falling negative #momentum and a close below the Oct. 2017 #pivot at 2.16 could see price drift lower to a new all time low 1.32 and possibly extending to 1.13. Immediate #resistance seen at .....
ADMA 2/4
Weekly Chart: Conditions are very #bearish with falling negative #momentum and a close below the Oct. 2017 #pivot at 2.16 could see price drift lower to a new all time low 1.32 and possibly extending to 1.13. Immediate #resistance seen at .....
ADMA 2/4
..... the SMA 200 at 4.11, then Oct. 2018 #trendline resistance sloping at 4.70. Above the latter short term profit taking prevalent at 6.54- 7.73. A close/hold above 8.49 is long term #bullish and targets strong resistance 10.79- 11.44.
ADMA 3/4
ADMA 3/4