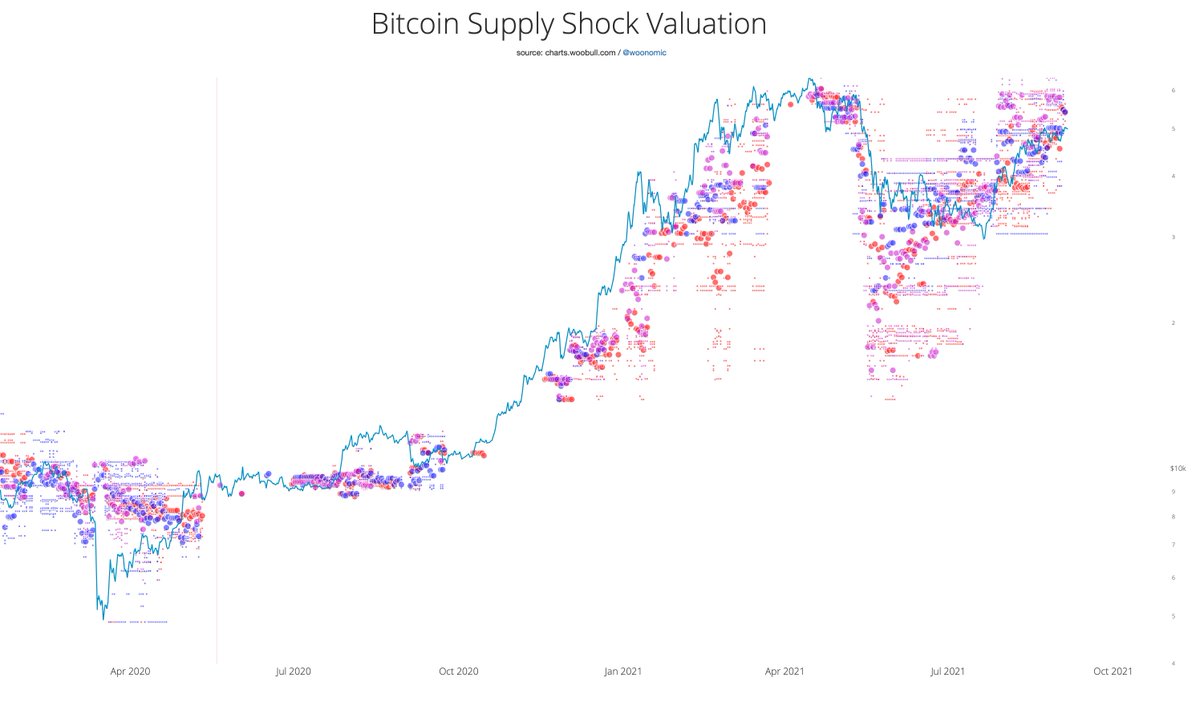
When coins on spot exchanges drop, it's a sign that new buyers are coming in to scoop coins off the markets and moving them into cold storage HODL, we are seeing new HODLers right now. Very macro bullish. Image
It's even more exaggerated with global exchanges. Image
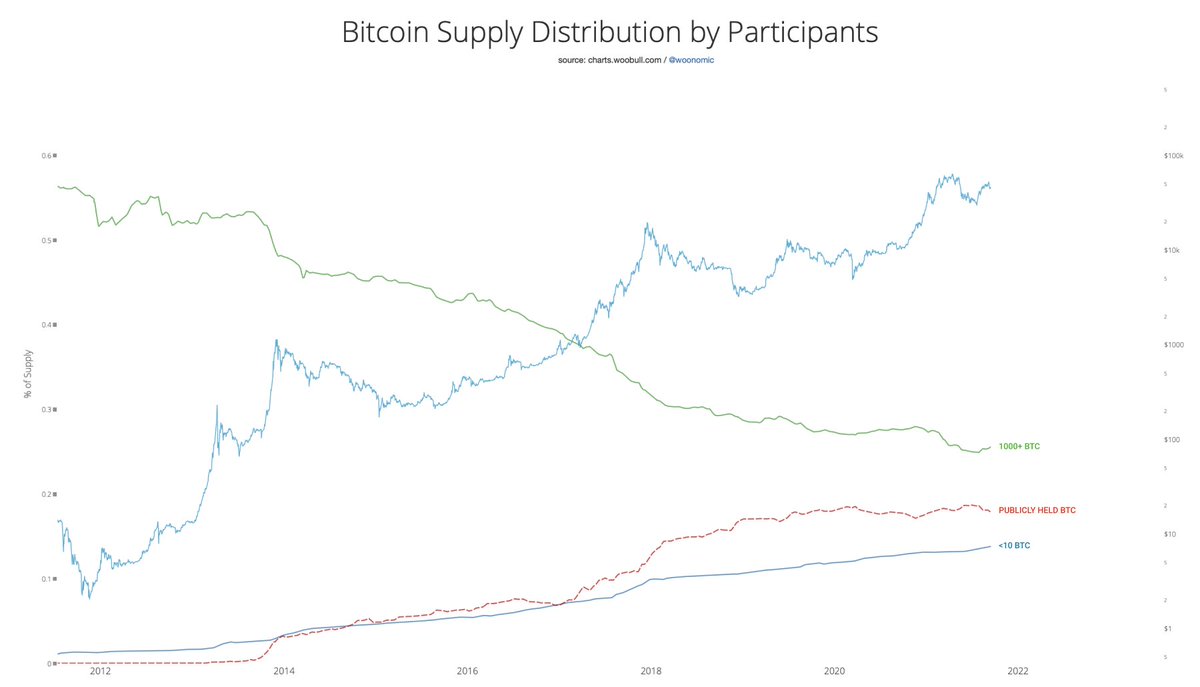
First scoop up of coins coincided with WSJ press coverage of Bitcoin as a legitimate investment vehicle off the back of the Winklevoss ETF news. It fueled the 2017 bull market.

The latest coincides with @michael_saylor's timeline of research into buying Bitcoin for $MSTR.
Data by @glassnode
No it's not DeFi. This is Bitcoin. Wrapped BTC for DeFi only have volume starting in late June 2020.

Image

• • •

Missing some Tweet in this thread? You can try to force a refresh
 

Keep Current with Willy Woo

Willy Woo Profile picture

Stay in touch and get notified when new unrolls are available from this author!

Read all threads

This Thread may be Removed Anytime!

PDF

Twitter may remove this content at anytime! Save it as PDF for later use!

Try unrolling a thread yourself!

how to unroll video
  1. Follow @ThreadReaderApp to mention us!

  2. From a Twitter thread mention us with a keyword "unroll"
@threadreaderapp unroll

Practice here first or read more on our help page!

More from @woonomic

1 Nov
The BTC network undergoes a constant daily sell pressure independent of investors selling. 2017 was simple, 2021 is more complex.

Oct 2017
Miners: 2134 BTC

Oct 2021
Miners: 917 BTC
Futures Fees Revenue: ~944 BTC
GBTC Fees Revenue: 30 BTC
Proshares ETF Contango Rollover: 8 BTC
I call this "The Last Cycle"

ELI5:
Every business operation on the network that earns revenue in BTC will sell BTC to pay for operational costs, this represents a constant sell pressure on the network.

Data presented here are the actual numbers.
This study illustrates how we can't just assume the 4 year halvening of miners sell pressure will just keep us locked into a 4 year cycle.

There are other important factors at play in 2021... The newer impacts will further dilute mining influence as the ecosystem matures.
Read 7 tweets
5 Oct
#bitcoin in public company treasuries has exceeded 200,000 BTC.

Live chart: charts.woobull.com/bitcoin-etf-co…
Added: @exodus_io (ticker: EXOD)
Updated: Galaxy Digital, Hut8Mining, Riot Blockchain, Marathon, Bitfarms

Not all Q4 quarterly filings have been updated so these numbers are expected to be the conservative lower bound.
Contribute new data via the Google spreadsheet: docs.google.com/spreadsheets/d…
Read 4 tweets
29 Sep
Deep inside baseball for on-chain analysts...

This is @glassnode's Illiquid Supply adjusted for drift.

The implication is that the raw data will give overly bullish signals, in reality we are NOT at all time highs of Illiquid Supply.
Primer... there's 3 classification of owners:

Illiquid - coins owned by "Rick Astley", the people who buy without much selling activity.

Liquid - coins owned by HODLers who buy and sell

Highly Liquid - coins owner by highly speculative people who mainly trade
The reason why Illiquid Supply is over estimated lies in how Illiquid Supply is derived.

It uses heuristics to cluster wallet addresses together into distinct owners (entities).

As more data comes in, more knowledge comes to light...
Read 9 tweets
13 Sep
I posted this map of the BTC supply distribution, but many asked "but what does this mean?".

Well, it says quite a lot, this is the whole ecosystem talking to us. Since people didn't see what I though was in plain sight, I'll break it down and add a bit more colour.

👇
1) Most importantly.

Bitcoin continues to distribute coins evenly. Publicly held and retail entities continue to gain more control of the supply while whales are reducing their control.

Remember the gold standard failed as a monetary standard due to centralisation of the supply
2) Retail drives macro cycles. When retail stack their sats at an increased rate, like they are doing right now, it's the fundamentals saying we are in the middle of a bull market.

I repeat; middle of a bull market. Traders in disbelief 2 months ago when this data was shown.
Read 6 tweets
5 Sep
Supply Shock valuation model.

Uses a look-back algo to determine what the market priced BTC at prior demand and supply situations.

Currently puts BTC above $55k.

It's conservative as one of the SS metrics, exchange SS, is now above all-time-high so no look-back is possible.
Interpolated best fit line.
Read 4 tweets
10 Aug
Ethereum supply shock well and truly at all time highs.

Looks like the market overpriced it in May but is probably underpricing it July / August.
Switching to an oscillator view of this, it's moving out of its no-brainer buy zone with the latest rally. But importantly, despite short term technicals being quite warm, it's far from over-bought on fundamentals.
On-chain data by @glassnode.

Note: the latest supply burn from EIP-1559 is not accounted for in Glassnode data. But it should not impact these metrics just yet (~0.01% impact on this indicator for now). Glassnode will be rolling in EIP-1559 burn data soon.
Read 5 tweets

Did Thread Reader help you today?

Support us! We are indie developers!


This site is made by just two indie developers on a laptop doing marketing, support and development! Read more about the story.

Become a Premium Member ($3/month or $30/year) and get exclusive features!

Become Premium

Too expensive? Make a small donation by buying us coffee ($5) or help with server cost ($10)

Donate via Paypal

Or Donate anonymously using crypto!

Ethereum

0xfe58350B80634f60Fa6Dc149a72b4DFbc17D341E copy

Bitcoin

3ATGMxNzCUFzxpMCHL5sWSt4DVtS8UqXpi copy

Thank you for your support!

Follow Us on Twitter!

:(