I'm retracting this statement. It was originally based on estimates by @fundstrat for every dollar going into "crypto" in 2018.
It doesn't look like the right number for BTC from a quick glance at the data. BTC is very liquid.
Here I'll lay a method to estimate it.
It doesn't look like the right number for BTC from a quick glance at the data. BTC is very liquid.
Here I'll lay a method to estimate it.
https://twitter.com/woonomic/status/1314127879819550720
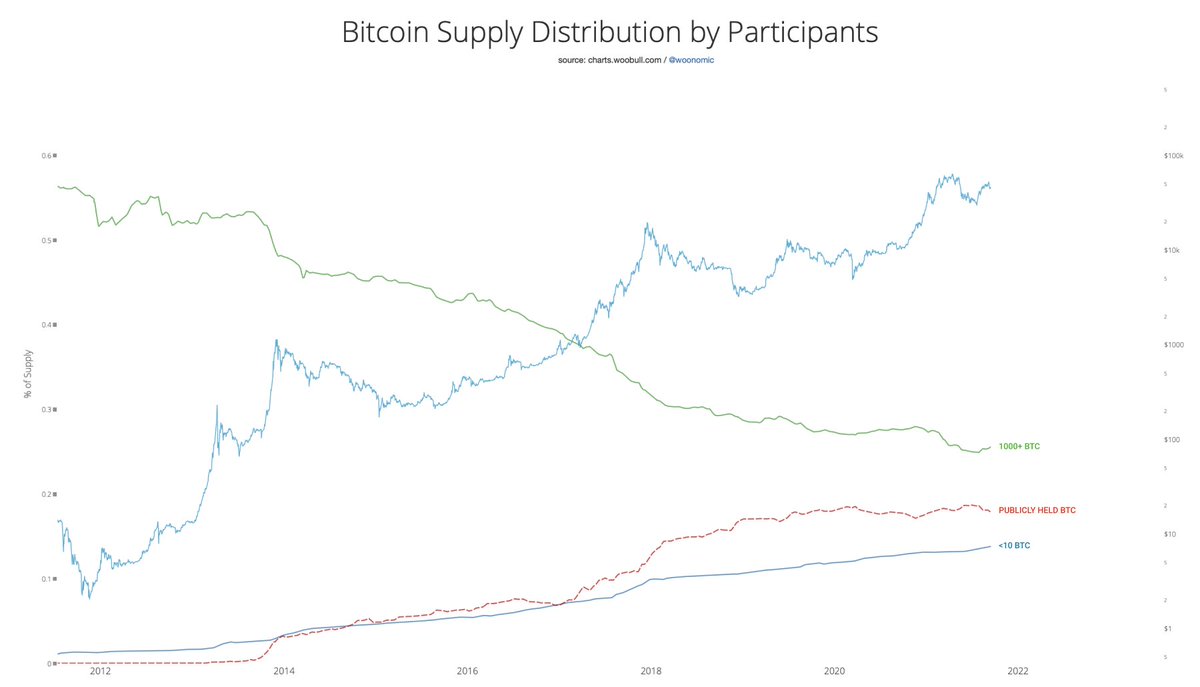
Realised cap approximates the total capital current investors paid for their coins by peering into the blockchain and using the time (and therefore price) at which the coins moved into their wallets.
Right now Bitcoin's cap is $202b for $116b of capital invested.
Right now Bitcoin's cap is $202b for $116b of capital invested.

So all-time impact is $1.70 per dollar invested.
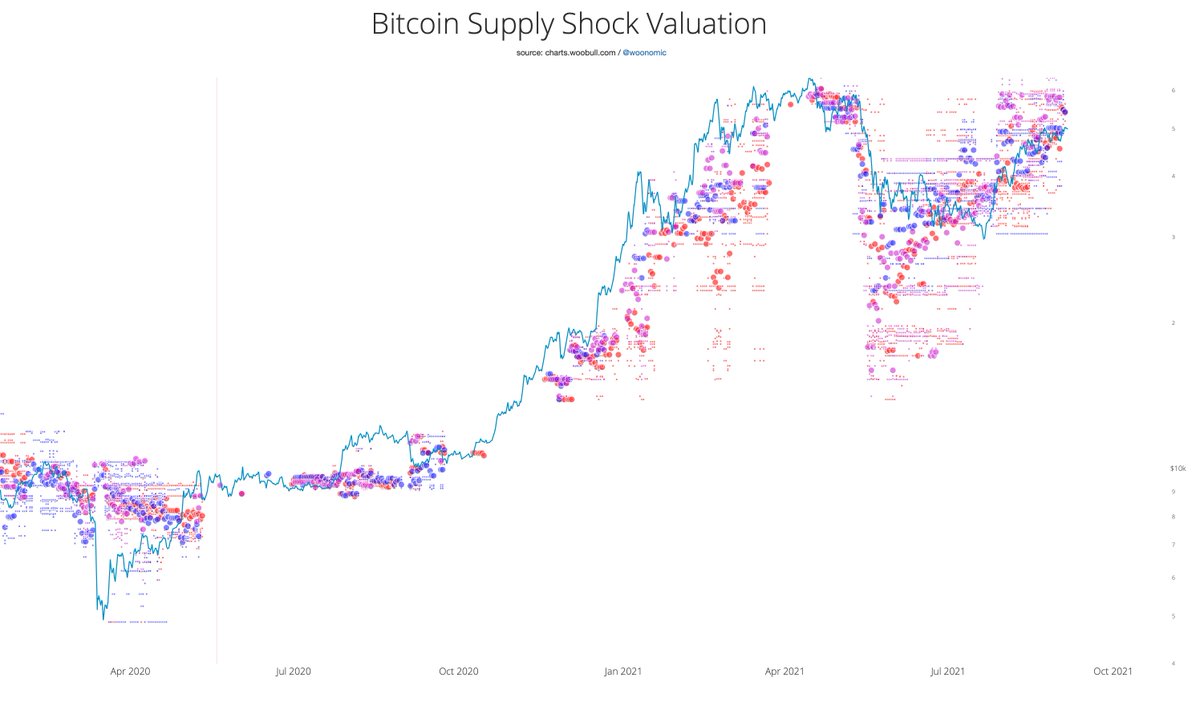
For the impact of the latest dollar, we need to take the current slope of the market cap (change in cap) and divide by the latest slope of the realised cap (change in money invested).
Depending on market phases it changes a lot.
For the impact of the latest dollar, we need to take the current slope of the market cap (change in cap) and divide by the latest slope of the realised cap (change in money invested).
Depending on market phases it changes a lot.
I'll set aside time to create this chart, I think it's important as we see more companies like Square and MicroStrategy hedge their USD stockpiles into BTC.
Also note this method underestimates the ratio as Realised Cap is imperfect and does not cluster addresses belonging to one participant. Moving coins from hot wallet bought for $400 in 2014 to cold storage in 2018 at BTC $12k counts as $11,600 of new capital per coin.
• • •
Missing some Tweet in this thread? You can try to
force a refresh