Let's not lose sight of what's happening.

We may not be able to rely on case data. But here's the latest PHE map of cases. Not now restricted to the north east and the north west - look at London

So if we can't rely on cases, we have to use other metrics. Image
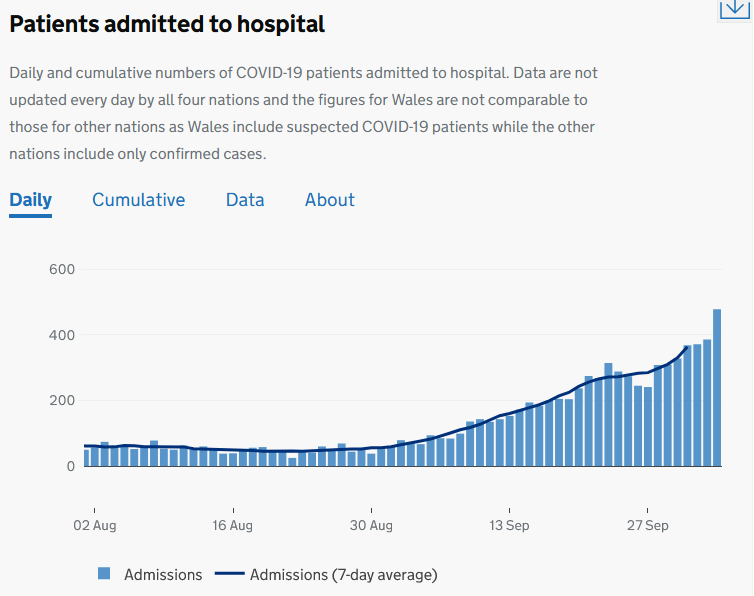
Here is a graph of admissions to hospital in England.

478 people were admitted today. And the trend is upwards. Image
What happens if you deteriorate is that you end up in ICU or a High Dependency Unit.

So what's happening there? These are increasing too. Image
And, sadly, deaths (note that there is a delay in reporting deaths, and that only deaths within 28 days of a test are shown here) Image
Remember that deaths from case numbers reported now are inevitable. It takes just under a week to present symptoms from catching the disease, and a week or so before admission to hospital, and a few weeks after that until sadly some people die.
We know more deaths are coming. Government policy can influence how many.

The question we need to be asking is:

What is the Government's reasonable worst case scenario estimate for deaths?

And, if the Government cannot provide an answer, why not?

• • •

Missing some Tweet in this thread? You can try to force a refresh
 

Keep Current with Dr Duncan Robertson

Dr Duncan Robertson Profile picture

Stay in touch and get notified when new unrolls are available from this author!

Read all threads

This Thread may be Removed Anytime!

PDF

Twitter may remove this content at anytime! Save it as PDF for later use!

Try unrolling a thread yourself!

how to unroll video
  1. Follow @ThreadReaderApp to mention us!

  2. From a Twitter thread mention us with a keyword "unroll"
@threadreaderapp unroll

Practice here first or read more on our help page!

More from @Dr_D_Robertson

8 Oct
Test Trace and Isolate isn't working.

Specifically
- Testing isn't working
- Tracing isn't working
- Isolating isn't working
SAGE minutes of 1 May (Meeting 32) stated that 'at least 80% of contacts of an index case would need to be identified for a system to be effective'

gov.uk/government/pub… Image
Here's a chart of the progression of people through the TTI system
nuffieldtrust.org.uk/resource/chart…

Also follow @ADMBriggs for excellent analysis of the TTI statistics

You can see we are nowhere near where we need to be
Read 9 tweets
6 Oct
Positivity calculations (please ignore this everyone, trying to work something out)

@theosanderson @ADMBriggs @dan_grey (please add in anyone interested)
We are trying to reconcile the data from this chart
(source: assets.publishing.service.gov.uk/government/upl… ) Image
Let's look at week 36, as that's what @theosanderson used in his FOI request
whatdotheyknow.com/request/689515…
Read 8 tweets
5 Oct
I thought I would share with you the PHE work on where cases are on the watchlist.

For each:

A map showing how cases per 100,000 last week and this week.

A chart showing positivity. High positivity = not enough testing.

Here's the national picture. Image
For context, New York closing schools at 3%. However, positivity in New York may be measured slightly differently.

Here is a case study - Liverpool vs New York
duncanrobertson.com/2020/10/04/we-…
Knowsley ImageImage
Read 23 tweets
5 Oct
We may be systematically underestimating R by excluding students in halls of residence. A Thread
We know that data on the Government Coronavirus dashboard is unreliable (see this thread)
We also know that we are not doing enough testing as the positivity rate is so high (7% overall for Pillar 2 tests and up to 15% in some areas such as Liverpool) (see this thread)
Read 9 tweets
4 Oct
Nearly 23,000 Covid-19 cases were reported today. This is due to a delay.

Analysis thread.
Public Health England have released a statement. It is here: gov.uk/government/new…

First, note that the Department of Health and Social care is the data controller for Pillar 2 tests. It passes these data to Public Health England, and DHSC are responsible for the data.
The statement says:
"we have identified that 15,841 cases between 25 September and 2 October were not included in the reported daily COVID-19 cases"
Read 14 tweets
4 Oct
New York compared with Liverpool: Schools

A Thread
The @WSJ is reporting that

"New York City on Wednesday will close public schools and nonessential businesses in parts of Brooklyn and Queens that have registered a week-long spike in coronavirus cases"

wsj.com/articles/new-y…
Let's look at New York and then compare to a UK city, Liverpool.
Read 13 tweets

Did Thread Reader help you today?

Support us! We are indie developers!


This site is made by just two indie developers on a laptop doing marketing, support and development! Read more about the story.

Become a Premium Member ($3/month or $30/year) and get exclusive features!

Become Premium

Too expensive? Make a small donation by buying us coffee ($5) or help with server cost ($10)

Donate via Paypal Become our Patreon

Thank you for your support!

Follow Us on Twitter!