9 October 2020 #BetweenTheLinesDotVote Analysis
The Power Of A Single Question
We've discussed this before. The chart here is the one and only chart, most closely approximating the 2016 Dornsife method.
It is: "Who do you think people in your state will vote for?"
The Power Of A Single Question
We've discussed this before. The chart here is the one and only chart, most closely approximating the 2016 Dornsife method.
It is: "Who do you think people in your state will vote for?"

2) It is good to remember that 2016 Dornsife only asked these 3 questions:
1) Will you vote?
2) Who for?
3) Who will win?
To my eye, #3 was always the most important. It also accords with the Flynn Doctrine: Who the people think will win, will win.
1) Will you vote?
2) Who for?
3) Who will win?
To my eye, #3 was always the most important. It also accords with the Flynn Doctrine: Who the people think will win, will win.
3) Throughout this season so far, it's been my contention that the entire Anti-Trump Establishment (ATE) - hey, not a bad acronym, eh? They want to eat him! - has employed a propaganda-driven False Polling based Psyop to project Biden as winner regardless of fact or truth.
4) I have conservatively estimated that False Polling has been 4 times worse this year than it was in 2016. And, with broken heart, I have deemed Dornsife to have fallen into the ATE realms, also. That is, tantalizingly, with the exception of this one question, this one chart.
5) If it weren't for this one chart, alone, I'd not be talking about Dornsife anymore. I'd likely still be tracking their boring numbers - Biden won on 19 August, in case you missed it. Happily, I've gotten over my obsession with their Insignificant Difference malarkey. Whew...
6) I don't know if anyone has noticed, but I have a standard protocol for presenting my charts. I almost always give both campaigns first, Biden second, Trump third. Today, I'm going to reverse that order. We're seeking both simplicity, as well as a solid footing with the data.
7) One last process point. One of the beauties of a time period such as an election season, is how the chart formations have time to emerge and clarify toward a specific end point in time. Start and finish, in between in the middle. It is lovely. And it speaks to confidence.
8) I'll return to the point about confidence in our concluding thoughts today. For now, just hear me say that when I can make rational sense of the formations, it reduces my stress regarding the caliber of the data. No data is perfect, so we always have to test. This is one way.
9) Here's Trump. How much do I love about this chart? I can't quite count the ways. I love its slope, beautifully sustainable. I love its sweet distance from top to bottom. Lots of space to move and play without too much threat of breaking channel. Did I just say channel?

10 Ach! Oh how I adore channels. Trading ranges. Same thing. And best of all: TRENDS! Each of these are synonyms.
We can also identify both the resistance and the support lines as trends as well. Okay, you forced it out me. Bull and Bear Markets! I swoon.
We can also identify both the resistance and the support lines as trends as well. Okay, you forced it out me. Bull and Bear Markets! I swoon.
11) Bull Markets have higher highs AND higher lows, successively. There's no better way to show that than in a channel. Just look. We can call this Trump's Bull Market, and it is positively typical for him. This is how he plays.
12) Just for thoroughness, a Bear Market is the precise opposite. Lower lows AND lower highs, successively. As you'll see, I have been searching for someone to show up in Bear where the other shows up in Bull. I haven't had that yet. Thus, no call so far.
A business call is about to interrupt for a bit. I'll return after and pick up with Biden's lovely chart...
13) Back again! And did I mention Biden's lovely chart? Oh my, it's so fabulous I had to do two, no kidding. You'll love both, and that should be true be you for Biden or be you for Trump. It's just a couple of lovely charts, okay? Here's the first.

14) You'll see, there are some fantastic charts coming, but I think this one takes today's cake for this happy chartist. Would you look at those tested trend lines. Wow! 6 tests each. Wow! I still can't believe how this channel sneaked up on me this season. I won't forget that.
15) I can't tell you Biden fans that this is a stronger channel than Trump's for the following reason. While Biden's is much more tested, 12 times vs 7, the range is narrower and has always felt, well, heavy to me. Also, he's got a bit more form beneath support, a good bit more.
16) In fact, if I was an evil, lying, cheating scumbag analyst, I could easily sneak in a downward sloping channel over this data, and you'd be hard pressed to catch me. Honest. I know. I tried that channel enough times to know. It's not exactly that I'm tempted that way.
17) What it really is, is that I just try every possible analysis my eyes and playful line drawing fingers can come up with. Also, I do have to throw some steak tips to my evil lying analyst soul's demons, or they'll maybe break out of jail and that's not okay.
18) That said, my broccoli and spinach loving analyst angels have a humble need to show how honorable and loving they are, today. So here all you Biden fans go. I'm for you! Check this out!!

19) Sadly, you do have to expand this chart to catch its drift. Drawing the possible current surge line at its lowest slope, we've got just a one-day break, but a pretty clean snap there. Of course, there was a much steeper earlier possible surge line previous broke good too.
20) Well, further sadly, it is part of the heaviness of a flat channel that when you hit and test resistance hard, it's much harder to break that resistance than it is to break support below. Especially when you have sub-support form in place. Heavy. You know, heavy.
21) So what about my little fanciful hypothesis there to the upper left? If this data is right, and if Biden is going to win, then that's where he's about to bounce. We can refer to the famous Kangaroo Function in charting. (I'm kidding again, there is no such famous function.)
22) I do assure you, though, if anyone in the MSM has anything right about this election, then it will soon show up in the indicated curvy line and possible surge slope. Again, if this data is right, and Biden is going to win, that's what it will have to look like.
23) Alright Biden fans, I'm about to get very dangerous. What you're about to see is classic me. These two charts show how I called the election by the data in 2016, as a method. I am NOT calling the election today. I hate that, but I'm not. Here's the first.

24) What you're looking at is solely the campaign data, with two competing resistance lines. If these lines do not change, Trump wins. There is a logical point of crossover between them, somewhere around the 25th or 26th or so. This shape can't last, it's got an expiration date.
25) There's no logical requirement about what the forms will look like following that. It's a true end point for the current resistance competition. But it does offer some hints and clues, and once again, if this data is right, it's not hinting so good for Biden. I'll explain.
26) A resistance battle is, by definition, a weighty, heavy thing unto itself. Resistance is where upward progress slows or stops. Note the difference. On a flat resistance line trend, ascent stops. That means that Biden's ascent has hit the roof, hard, six times so far. Ouch.
27) On the other hand, Trump's ascent, at resistance, merely slows down. Well, it's a bit more complicated. He hits resistance hard too. But his upward slope has this strange, anti-gravity lift effect in that it ends up drawing him higher with his next high, so far.
28) I know, we already talked about Bull Markets above, with an earlier chart. But looking solely at resistance lines you get a different feel from the data. There is no other way for me to look at these two competing lines other than to say, momentum is with Trump.
29) We have to take a little side trip now, before we turn to our last chart of the day. It's called Trump Supporters Iceberg theory (TSI). Here's an iceberg. TSI theory indicates that polled Trump support is just the tip. His unpolled is the base area below.

30) If TSI theory is correct, than Biden's campaign is the Titanic and 2020 will be one of the historically great landslides AND upsets, both at the same time. And would that just be so Trump, and so MAGA? That's the way we role, or at least it's what we believe, anyway...
31) I can lay this down for you now from simple logic alone. If Trump wins by anything other than the slimmest of margins, let alone any kind of landslide, it will have been TSI + False Polling that accounts for us having NO CLUE other than my charts. Can you imagine? I can!
32) And that brings us to today's final chart. I don't know if you trust me, but I'm telling you, even if I thought this chart called for Biden, and not Trump, I would LOVE it. I'd be proud. And let me tell you again, if Biden wins, and I failed to call it, I will be ashamed.
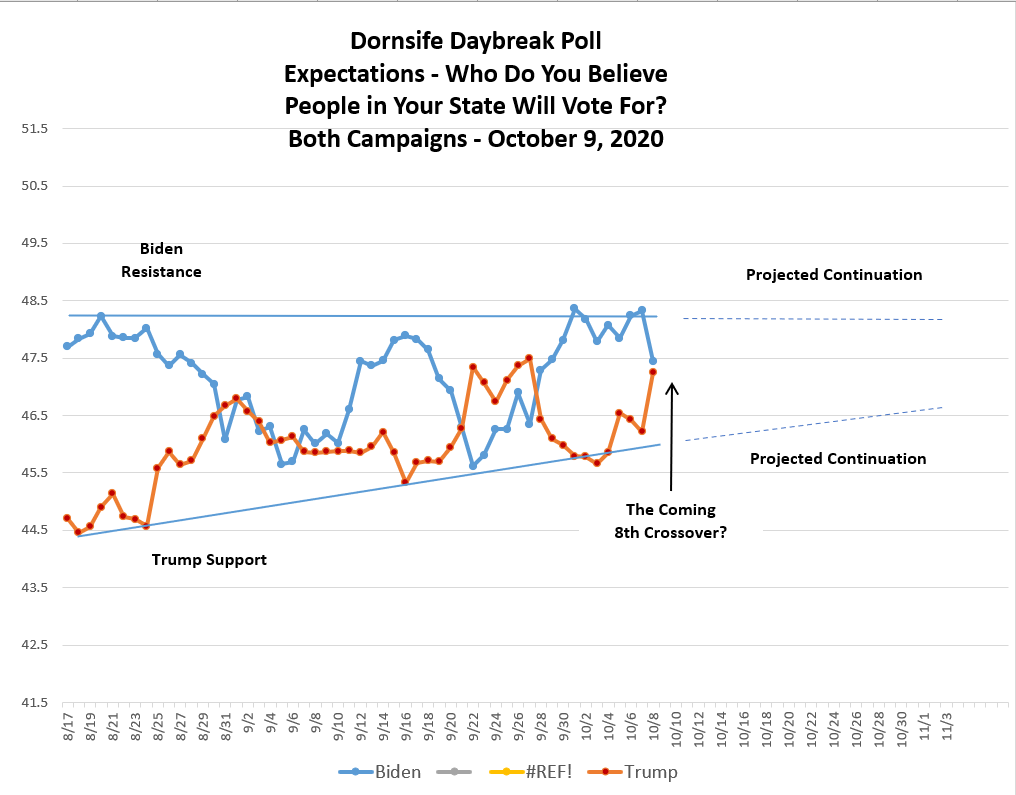
33) We have the same data, here, as on the previous chart, exactly. But, the battle here is shown as between Trump's support and Biden's resistance. I won't bother you with it again, but I have lovely examples of this exact form of analysis from 2016 readily available for review.
34) The logic is again simple. The winner wins by rising resistance, or at least protecting his own higher resistance against his competitor's attempted but failed assault. The loser loses by inadequate support to inform his resistance's rise to victory. It's just logic.
35) When we look at the full arc of an election, it isn't easy to remember how each day was thing unto itself. I can assure you, though, I will remember October 9, 2020. What drama! Look at that little tiny, itsy bitsy difference between the two campaigns here.
36) I do confess this. If I were a Biden supporter, I'd mark this one up with something like: The Coming Final Smackdown? You see, if Biden springs right back up tomorrow, and Trump back down, then the new formations that follow could put paid to this contest. Biden wins.
37) But, being me, I'm feeling the momentum upward. I don't know if it'll be tomorrow, but it certainly wouldn't surprise me. On the other hand of that one, there's plenty of room here for the contest to continue without a knock out blow for either side.
38) Actually, that's the one thing I like the least about this chart. Look how open the formation is out to November 3. The data really could just dither around, up and down, petering out to the end with a whimper and not a bang. If that happens, I will not be happy.
39) In fact, that open end out there is the visual path of a contested election, outcome not known for weeks, months, or until SCOTUS decides it. And what if SCOTUS has only 8 Justices, and ends up hung, what then? UGLY!
40) I thought to talk more about forms and confidence, but we've covered enough ground for one day. I'll just say this, at least these charts do not appear irrational to me. I do appreciate that, and yes intelligible forms do, absolutely, build my confidence, such as they can.
Thread ends at #40.
You have to know, though, I could have kept going all day long with this stuff. Damn that was fun! For me at least. I hope it was for you too.
You have to know, though, I could have kept going all day long with this stuff. Damn that was fun! For me at least. I hope it was for you too.
• • •
Missing some Tweet in this thread? You can try to
force a refresh