National Flu and COVID surveillance report now out, reporting 5-11th Oct.
Short(ish) summary
gov.uk/government/sta…
Short(ish) summary
gov.uk/government/sta…
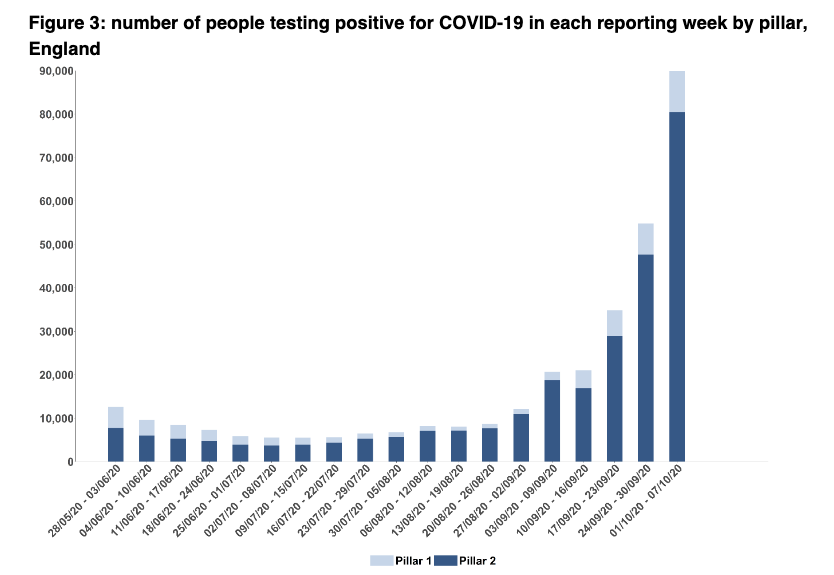
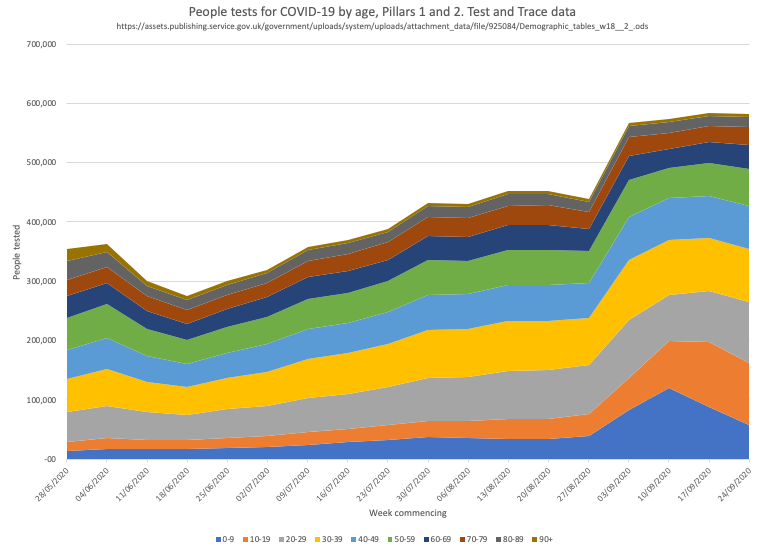
Cases and positivity (to 7.8% in pillar 2 and 2.7% in pillar 1).
Although not rising as quickly this week as in previous weeks, it remains hard to interpret what it means for community prevalence because it's still unclear what testing access issues remain across the country.
Although not rising as quickly this week as in previous weeks, it remains hard to interpret what it means for community prevalence because it's still unclear what testing access issues remain across the country.

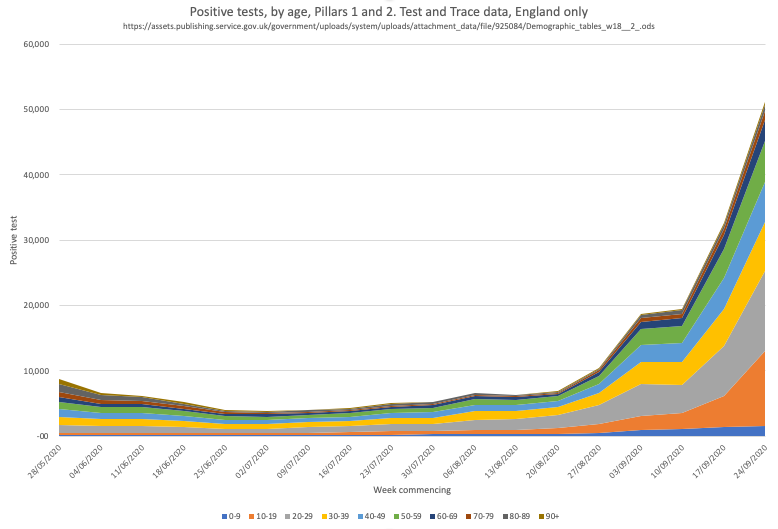
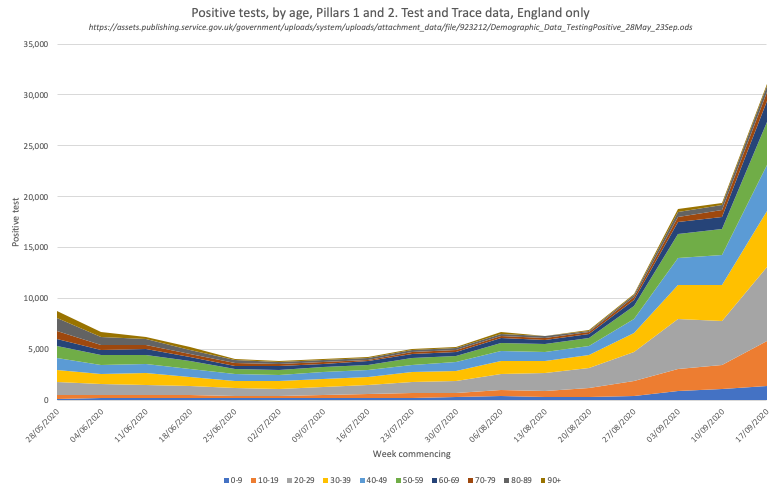
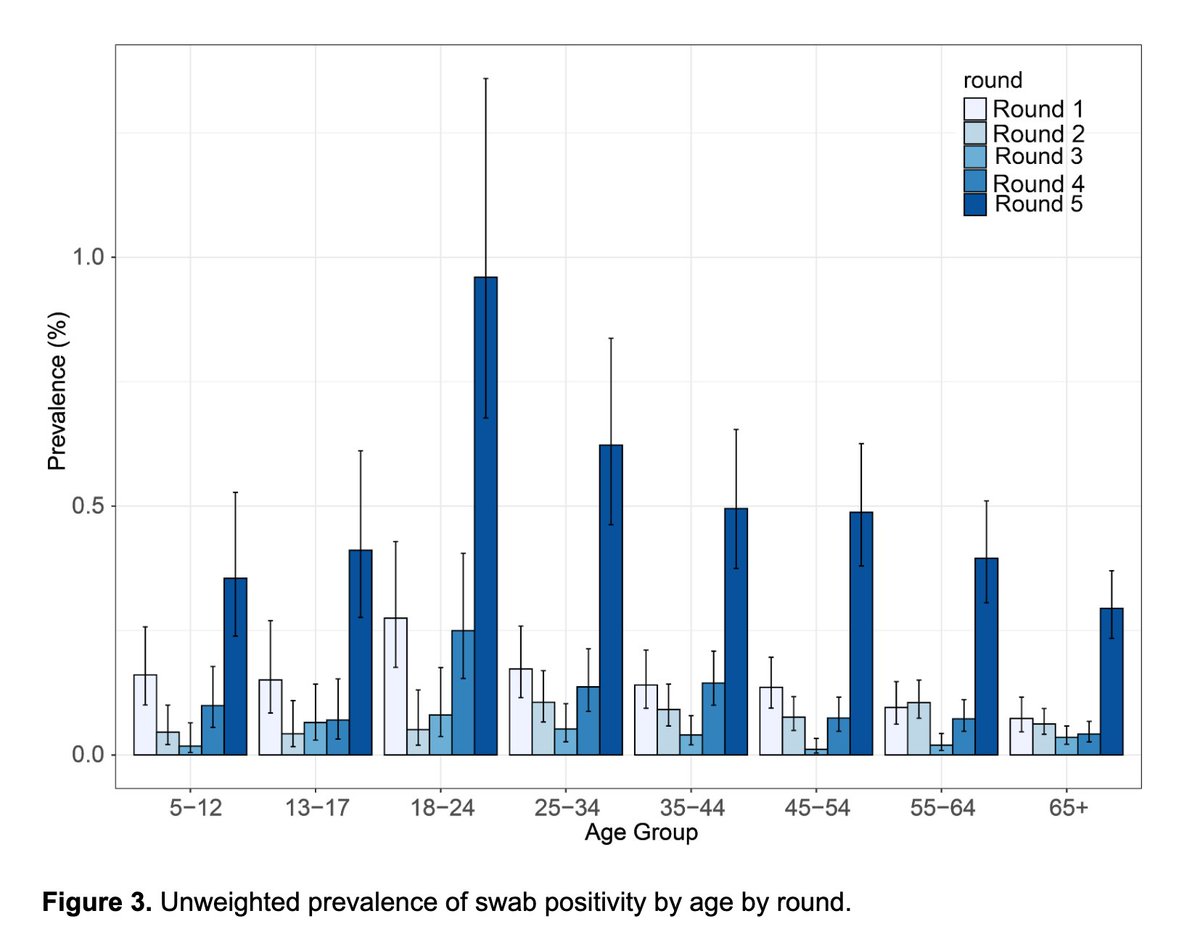
Case numbers and rates still dominated by 10-29y/o age gp, but worth looking at rising case rates in all age gps, including 0-4 and 5-9y/o


And positivity rates show how 10-18y/o are more likely to test positive than other age groups. I think this is going to be dominated by 18-19y/os given the student case loads, but we don't know from the data presented here.


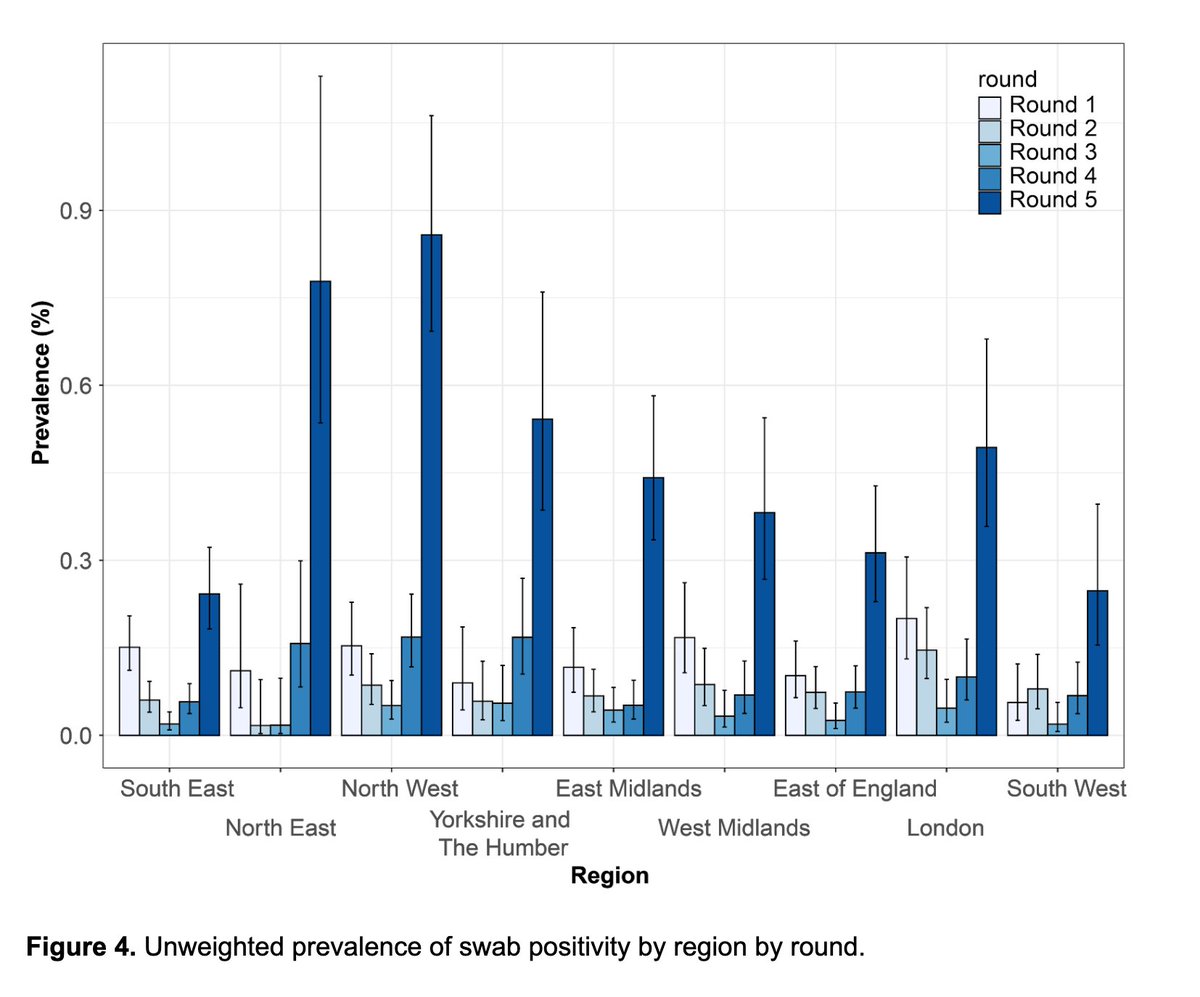
Note ongoing geographic variation in case rates, with SE now coming out in clear fourth place after NW, NE, and Yorkshire/Humber (positivity rates also shown)


And ongoing significant variation in case rates by ethnicity. Clearly more still needs to be done both to understand the drivers of these differences and mitigate their impact.

And the useful thing about the surveillance report is that it includes other respiratory viruses. Cases of flu are beginning to emerge, and parents will be relieved that cases of rhinovirus are beginning to decline.


In terms of incidents and outbreaks, the numbers over the past week has significantly grown in care homes (from 174 to 321), this is worrying. Almost no change for edu settings but still growth in workplaces - clearly not all are COVID-secure.


And hospital and ITU admissions are climbing ever upwards. As nightingale hospitals prepare to reopen, we can see how the NE, NW and Midlands have been so disproportionately affected and are so concerned regarding capacity.


The hospital and ITU admissions are being driven, as ever, by those aged over 65 yrs, which big rises in hospital admissions for 85+ and ITU for 45-85y/o.
COVID has made it's way back up the age groups.
COVID has made it's way back up the age groups.


And is leading to more deaths at 28days and 60 days.


Deaths aren't yet translating to a signal in excess mortality but this is potentially a matter of time given the 2-4wk lag b/w COVID infection & death. Plus if hospitals reach capacity with COVID, then there's no room to manage all the other conditions that don't simply disappear

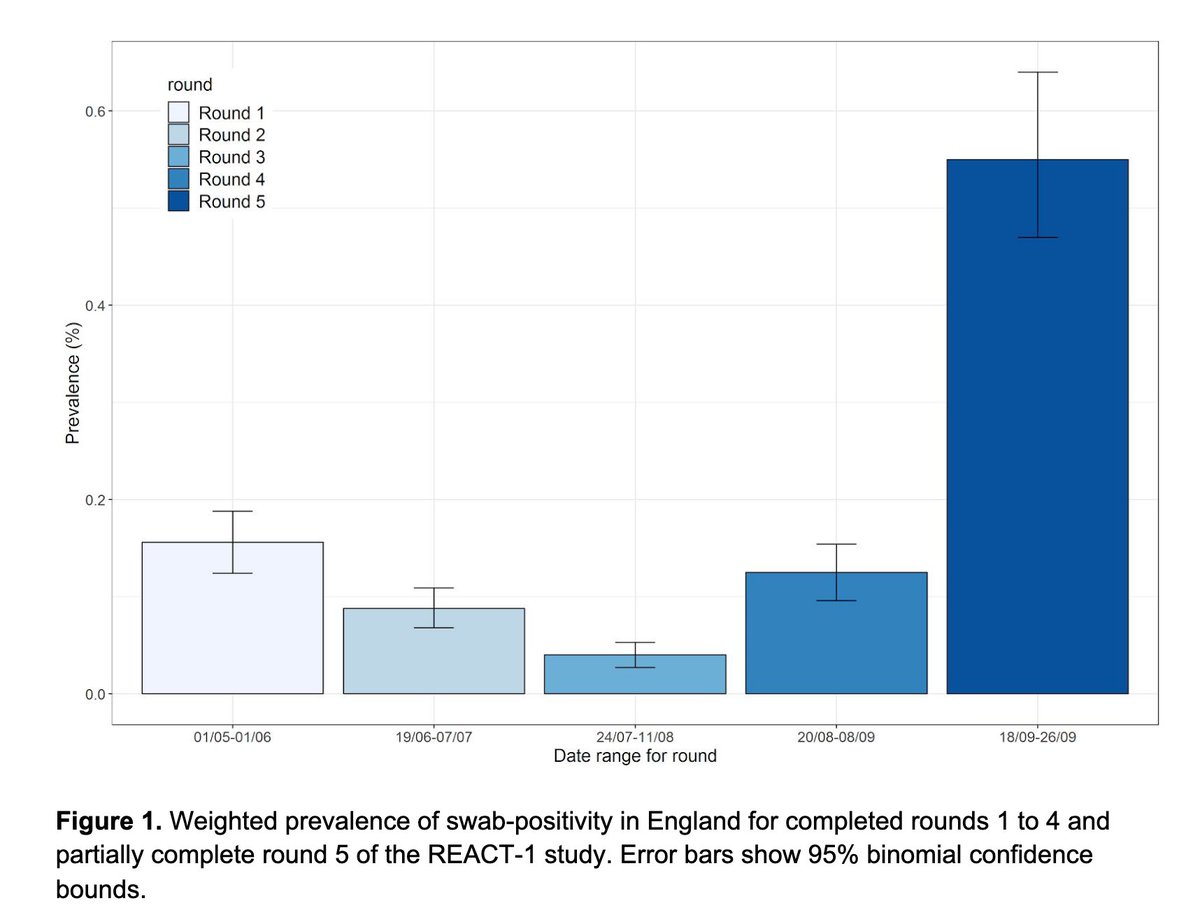
To manage this NEEDS infection rates to decline. ONS survey shows that they're still rising fast in the community.
ons.gov.uk/peoplepopulati…
ons.gov.uk/peoplepopulati…

To do that needs people to isolate when they have symptoms, when they're a case, when they're a contact.
To socially distance, to wash hands, wear a mask. It can be helped by consistent comms + support from local and central gov.
Otherwise it'll be a really hard few months.
To socially distance, to wash hands, wear a mask. It can be helped by consistent comms + support from local and central gov.
Otherwise it'll be a really hard few months.
PHE surveillance rpt👆. T&T coming later. @felly500 @deb_cohen @martinmckee @carolecadwalla @mgtmccartney @ADPHUk @Jeanelleuk @fascinatorfun @profchrisham @petermbenglish @HPIAndyCowper @Davewwest @HSJEditor @KateAlvanley @IndependentSage @nedwards_1 @SamanthaJonesUK @ewanbirney
Twitter wasn’t working on my laptop last night, therefore will write Test and Trace thread this eve instead.
In the meantime, we launched our new @HealthFdn Test and Trace tracker earlier yesterday - do let us know what you think.
In the meantime, we launched our new @HealthFdn Test and Trace tracker earlier yesterday - do let us know what you think.
https://twitter.com/admbriggs/status/1316776224992169985
• • •
Missing some Tweet in this thread? You can try to
force a refresh