Wk 19 Test & Trace. 01/10/20 – 07/10/20.
Cases up.
Positivity up.
More cases reached but fewer contacts.
And it's taking longer.
Plus this week has 11k extra cases because of the delayed transfer of 15.8k cases
gov.uk/government/pub…
Summary in pics, detail in thread 👇
Cases up.
Positivity up.
More cases reached but fewer contacts.
And it's taking longer.
Plus this week has 11k extra cases because of the delayed transfer of 15.8k cases
gov.uk/government/pub…
Summary in pics, detail in thread 👇


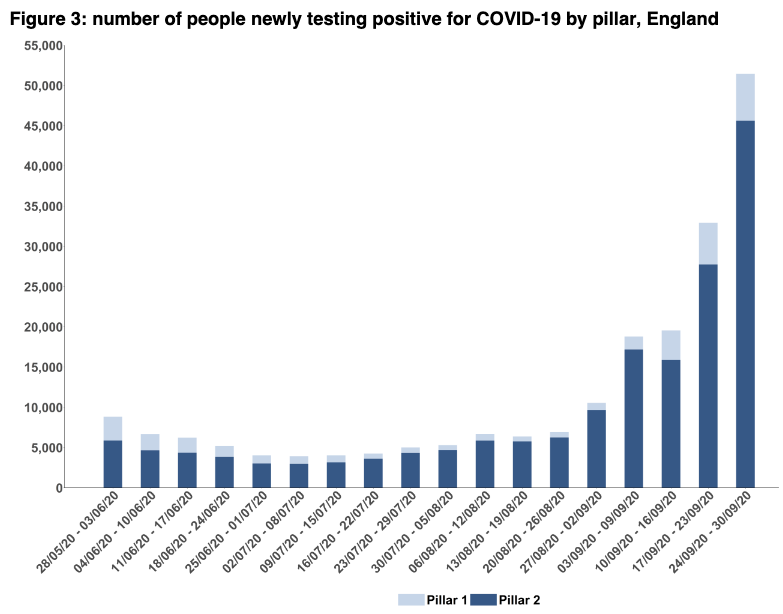
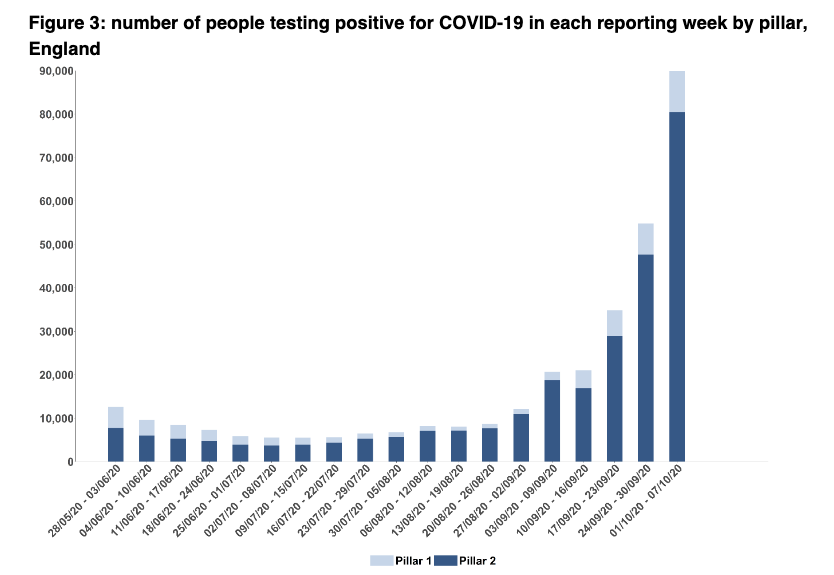
Cases⬆️64%
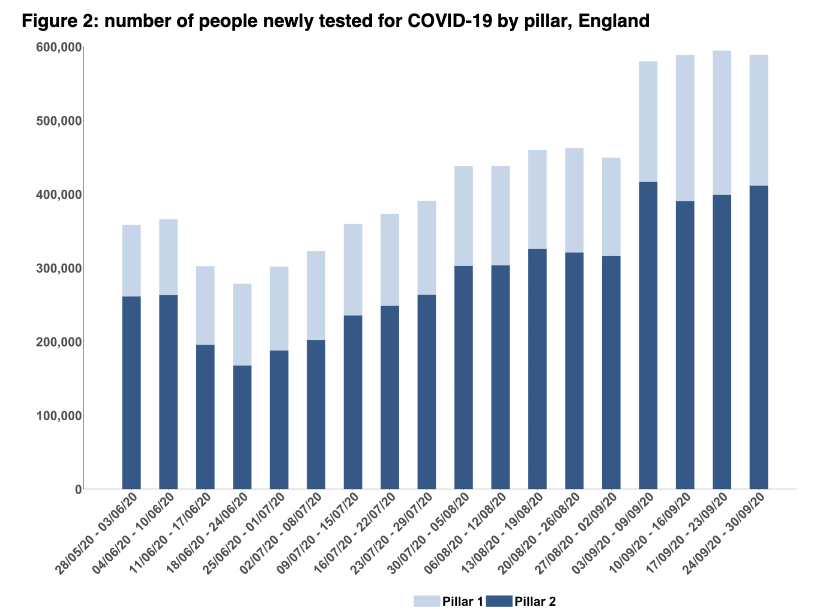
Particularly pillar 2 (community)
Cases⬆️69% from 47,656 to 80,485; positivity⬆️to 7.7% from 5.3%
For Pillar 1 (hospitals/outbreaks)
Cases⬆️32% from 7,119 to 9,389. Positivity now 2.5% from 1.9%
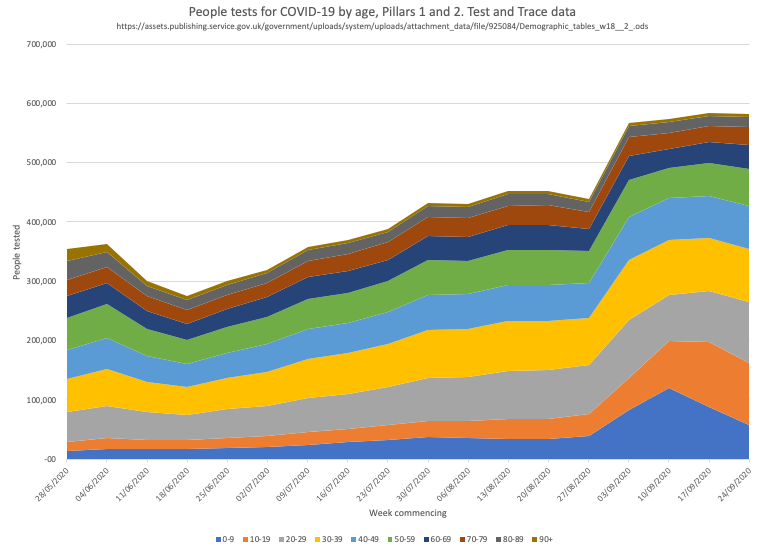
And new for TT, number of individuals tested each week rising wk on wk.
Particularly pillar 2 (community)
Cases⬆️69% from 47,656 to 80,485; positivity⬆️to 7.7% from 5.3%
For Pillar 1 (hospitals/outbreaks)
Cases⬆️32% from 7,119 to 9,389. Positivity now 2.5% from 1.9%
And new for TT, number of individuals tested each week rising wk on wk.


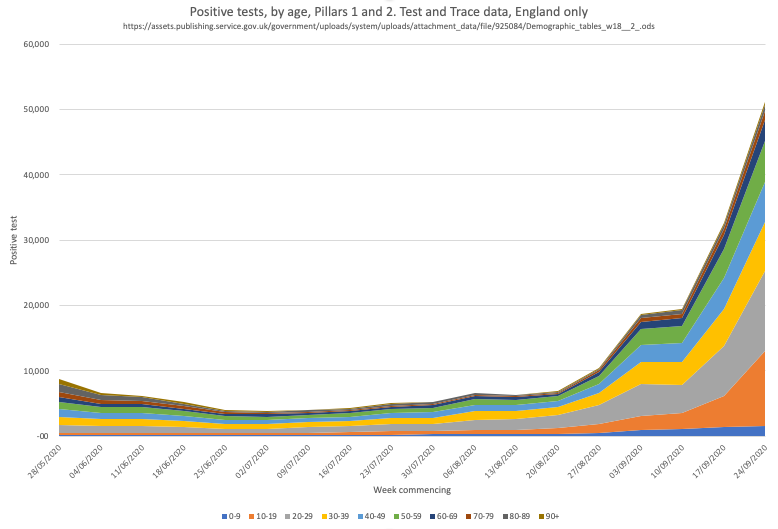
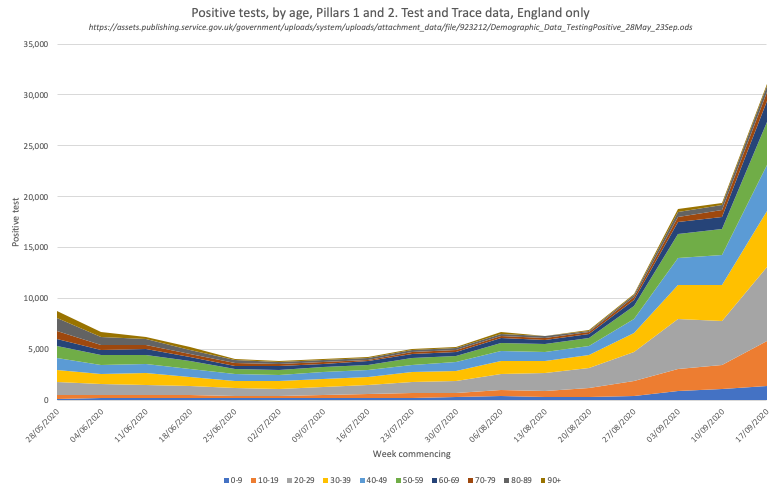
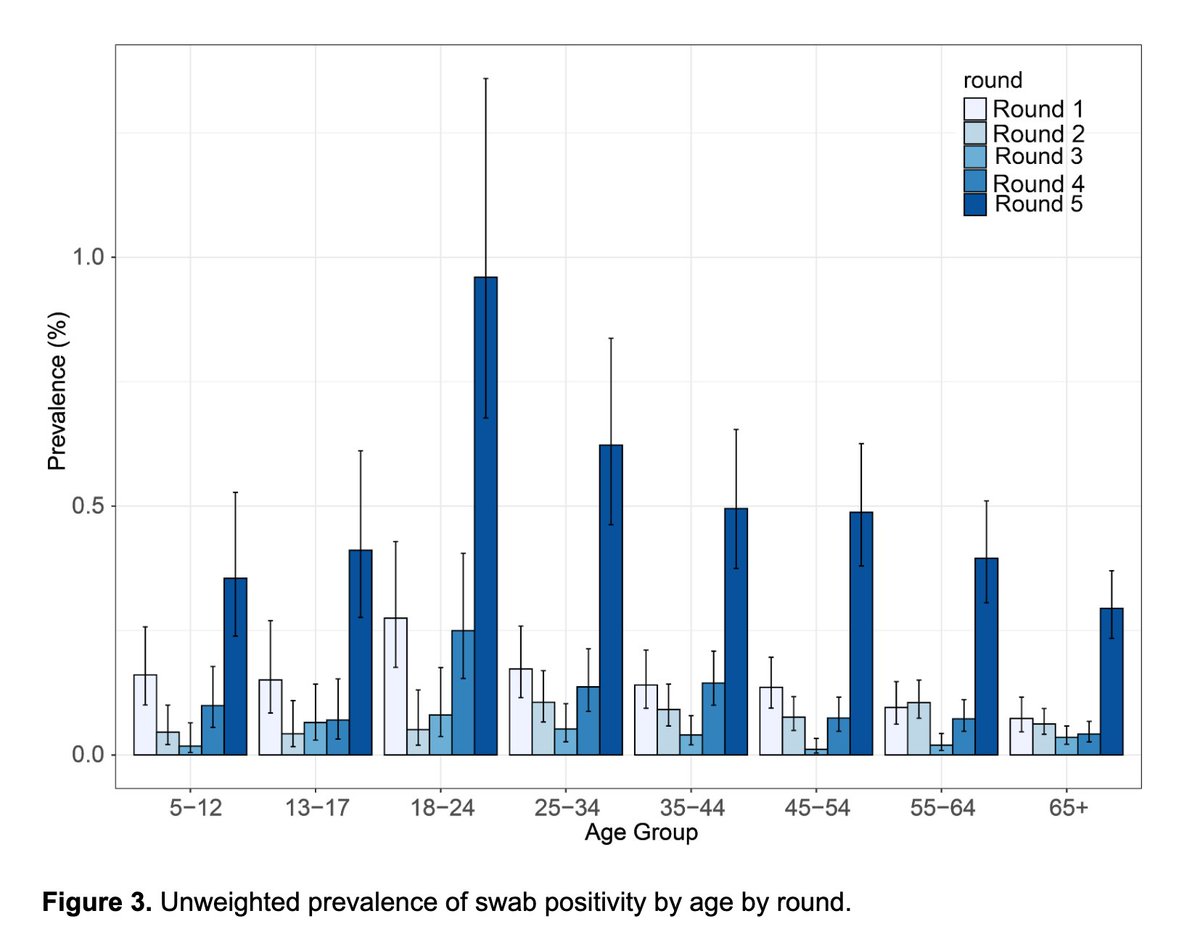
By age – as with last week, cases in 10-29 y/o STILL rising fast without big changes in numbers of tests done. This is reflected in the PHE surveillance positivity data by age.
https://twitter.com/ADMBriggs/status/1316751971353845760?s=20


But ONS breaks this down into much more useful age categories, showing cases now starting to rise in 11-16y/os, so not just 17y/o+
https://twitter.com/ADMBriggs/status/1317221986142224389?s=20
(and a brief aside on testing, good to see positivity rate now being published by TT, but would be even more helpful if this distinguished between symptomatic and asymptompatic/routine testing as frequently argued by @fascinatorfun)
In terms of T&T performance, it’s remains disappointing.
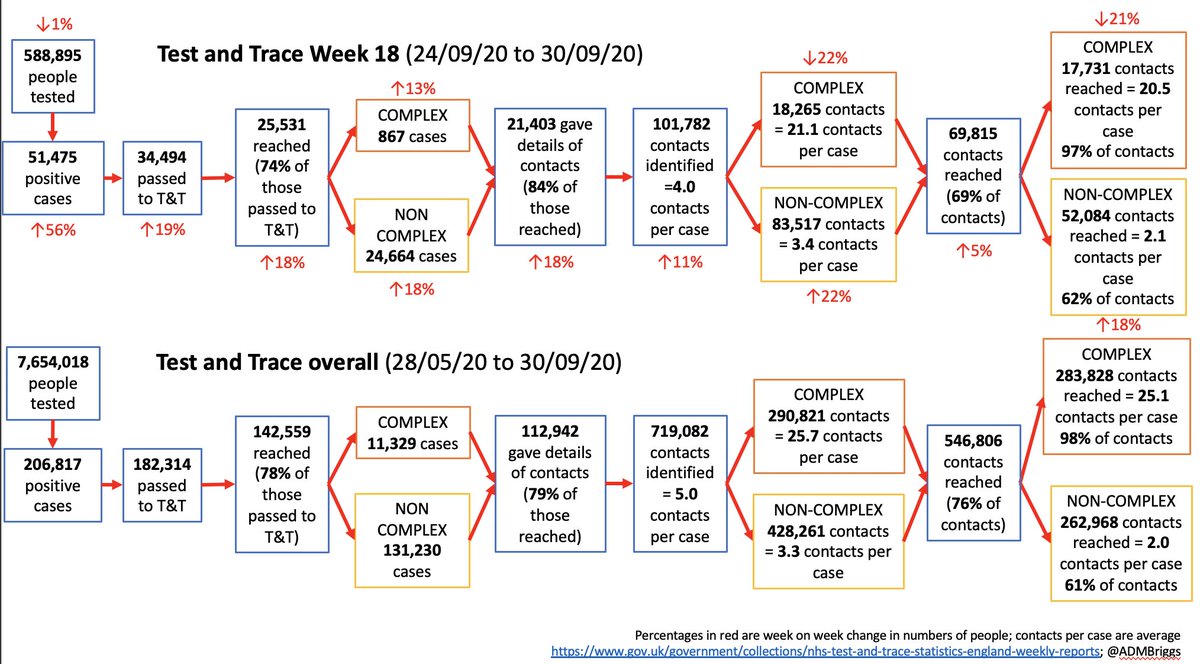
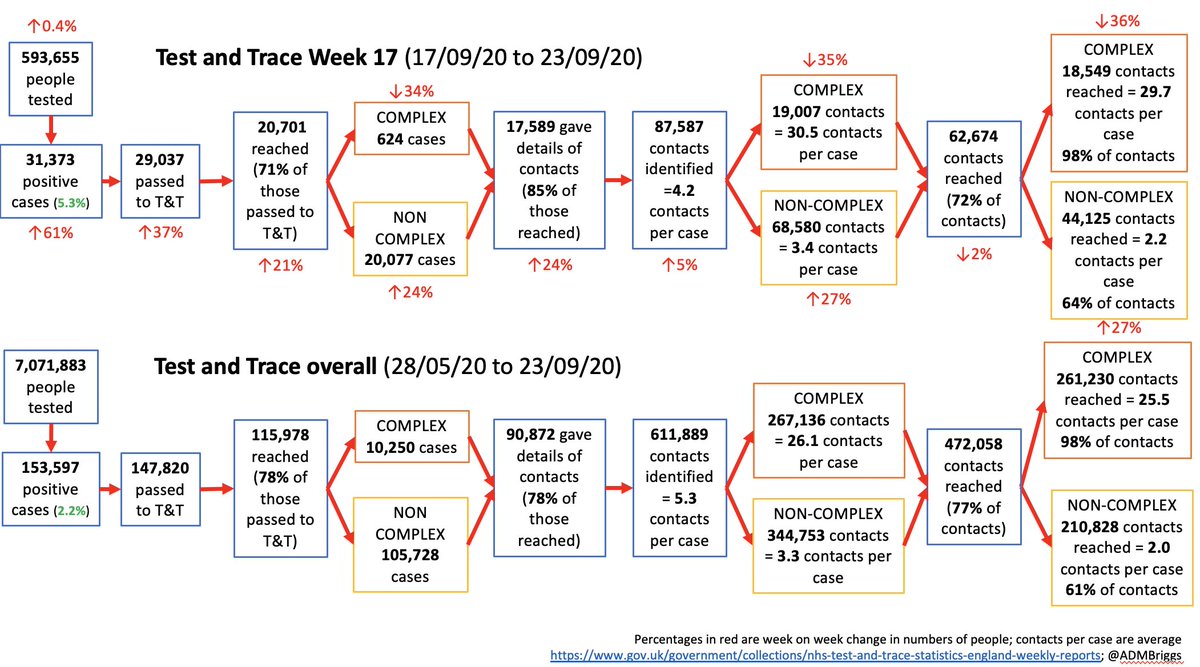
First, a whopping 87,918 cases transferred – includes 11k from the 15.8k cases that were missed between 25/9 & 02/10, transferred in bulk on 3/10.
Despite this, the percentage of cases reached was up from 75% to 77%.
First, a whopping 87,918 cases transferred – includes 11k from the 15.8k cases that were missed between 25/9 & 02/10, transferred in bulk on 3/10.
Despite this, the percentage of cases reached was up from 75% to 77%.

And the number providing details of close contacts, also at another all time high of 85%

This mean a lot of contacts. 216,627, to be exact.
And this is where we see problems.
And this is where we see problems.
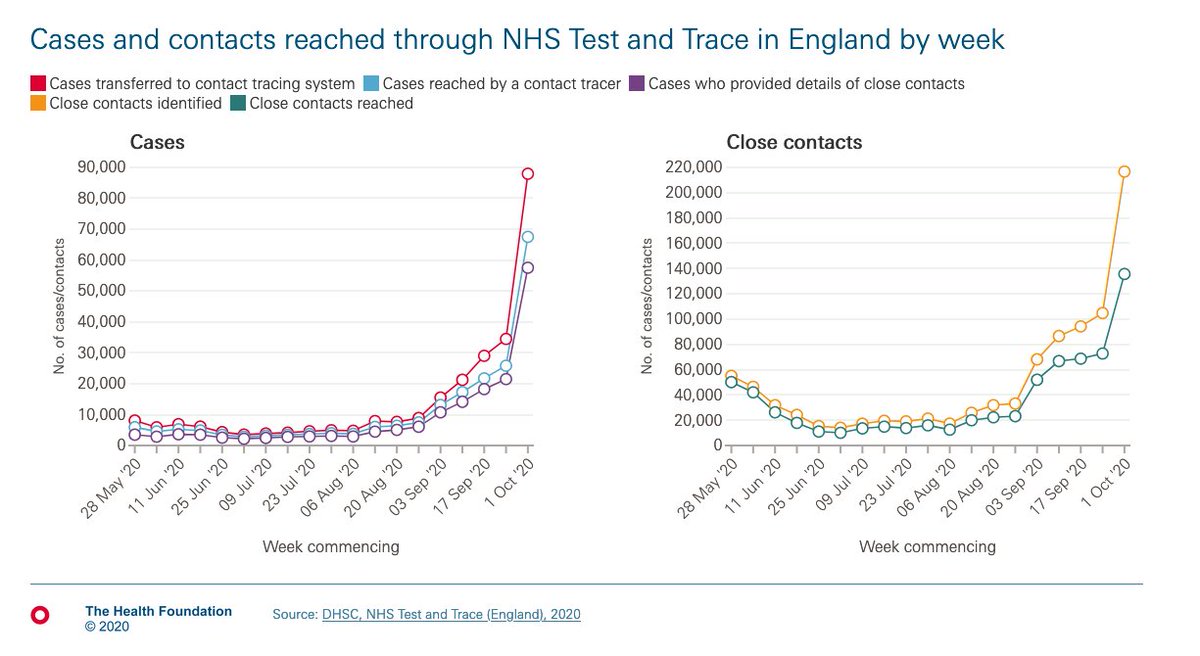
The time taken to reach these cases has fallen for four consecutive weeks and is now just 56% compared with 77% in the first week of Sept.

This has massive implications for local contact tracing systems, now operating in around half of local councils across the country.
They generally take cases that haven’t been reached within 24 hrs.
They generally take cases that haven’t been reached within 24 hrs.
This means that this drop in TT performance means not only are local gov receiving more cases to manage (without more ££) due to rising case rates, but also because a smaller proportion are being reaching by TT in a reasonable time.
More detail here:
More detail here:
https://twitter.com/ADMBriggs/status/1315773684469166083?s=20
It also begs the question, what proportion of the 77% reached are by TT & what are local gov systems?
This would be so useful to understand the impact of local systems, especially given talk of the widening role/responsibilities of local gov in TT as local case rates increase.
This would be so useful to understand the impact of local systems, especially given talk of the widening role/responsibilities of local gov in TT as local case rates increase.
Of the 216,627 close contacts, there are big drops in the numbers of contacts identified per case.
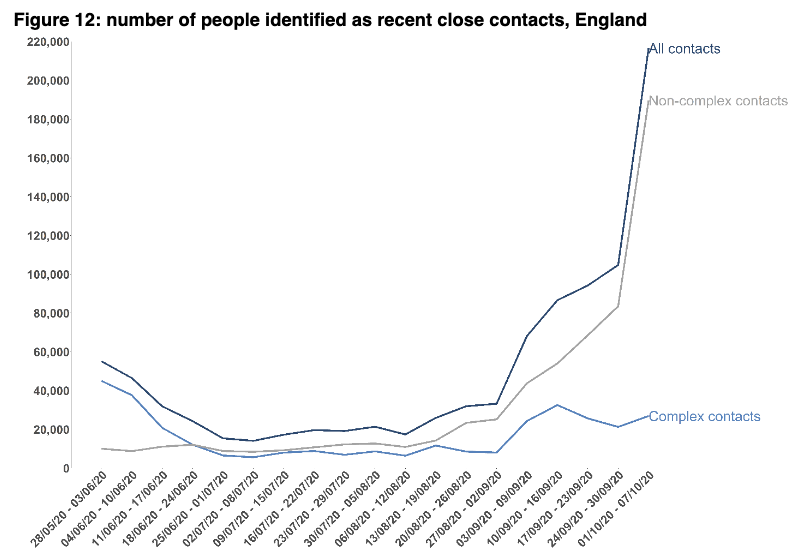
Down to 2.9 per case for non-complex cases (3.4 wk before)
And 14.8 per case for complex cases (outbreaks/high risk settings) down from 21.7 last wk.
Could be 11k delayed cases not remembering their contacts, or it may be a sign of the impact of growing social restrictions.
And 14.8 per case for complex cases (outbreaks/high risk settings) down from 21.7 last wk.
Could be 11k delayed cases not remembering their contacts, or it may be a sign of the impact of growing social restrictions.
Or may be something else (like people not wanting to report contacts - but I think unlikely given proportion of cases reporting contacts is increasing).
The rising proportion of close contacts that are same household may support the possibilities it reflects social restrictions.
The rising proportion of close contacts that are same household may support the possibilities it reflects social restrictions.

Unfortunately the percentage of contacts reached has also dropped again, now at just 58% down from 64% two week ago.

And the proportion of close contacts reached within 24 hours of either the contact or the case first being identified is now at an all-time low of 61% and 39% respectively.

Finally – a functional TT system is so so important.
And if our current one can be improved by working more closely with local gov then that's great & we should do it. But this has to be supported by the necessary resources for already madly stretched local teams.
And if our current one can be improved by working more closely with local gov then that's great & we should do it. But this has to be supported by the necessary resources for already madly stretched local teams.
And finally two - we've started a new TT tracker summarising a few key points each week/every other week. Do let us know what you think.
health.org.uk/news-and-comme…
health.org.uk/news-and-comme…
Wk 19 T&T eventually here @felly500 @trishgreenhalgh @deb_cohen @martinmckee @carolecadwalla @mgtmccartney @ADPHUk @Jeanelleuk @fascinatorfun @profchrisham @petermbenglish @HPIAndyCowper @Davewwest @HSJEditor @KateAlvanley @IndependentSage @nedwards_1 @chrischirp @SamanthaJonesUK
• • •
Missing some Tweet in this thread? You can try to
force a refresh