Short thread on today's latest @ONS COVID Survey release for 02/10 to 08/10

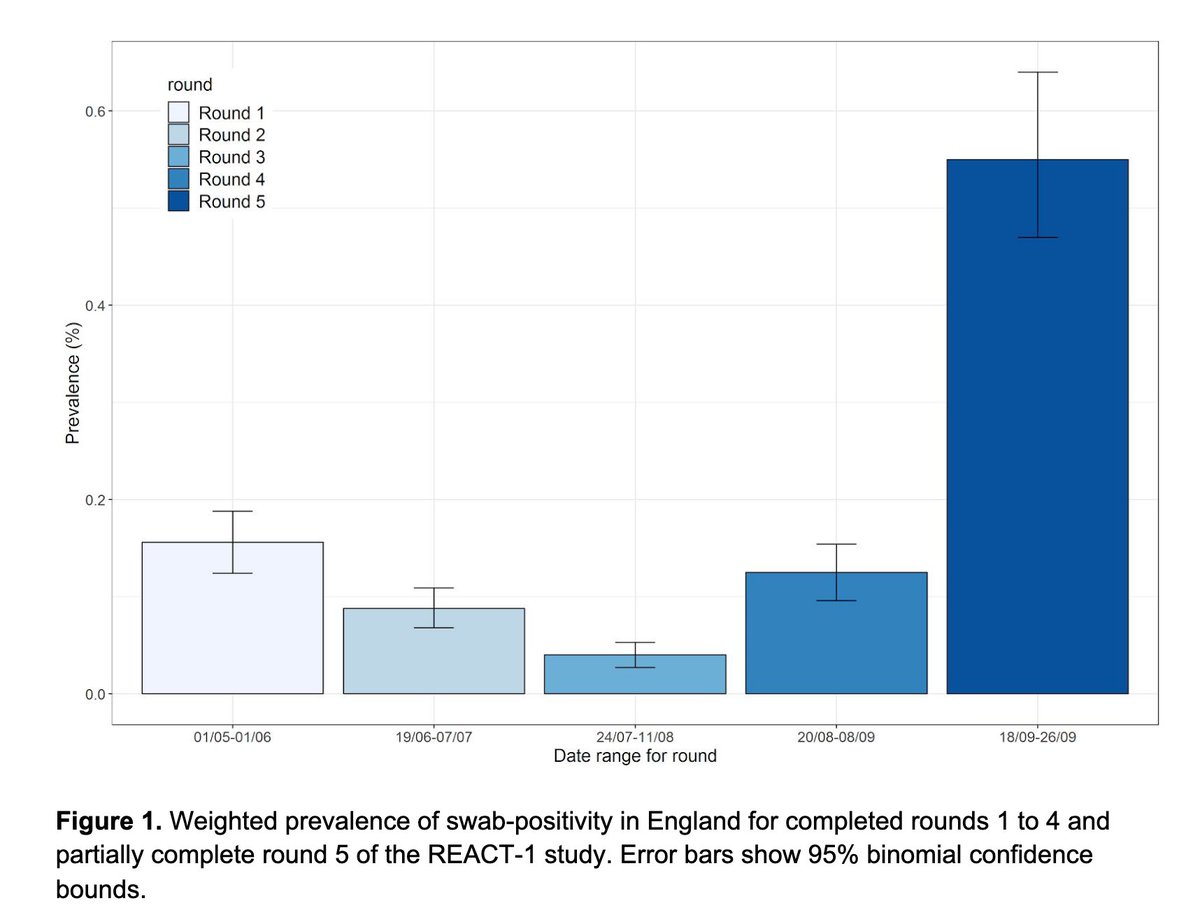
The number of community cases is really rocketing - now estimated at 27,900 cases/day in England.

ons.gov.uk/peoplepopulati…
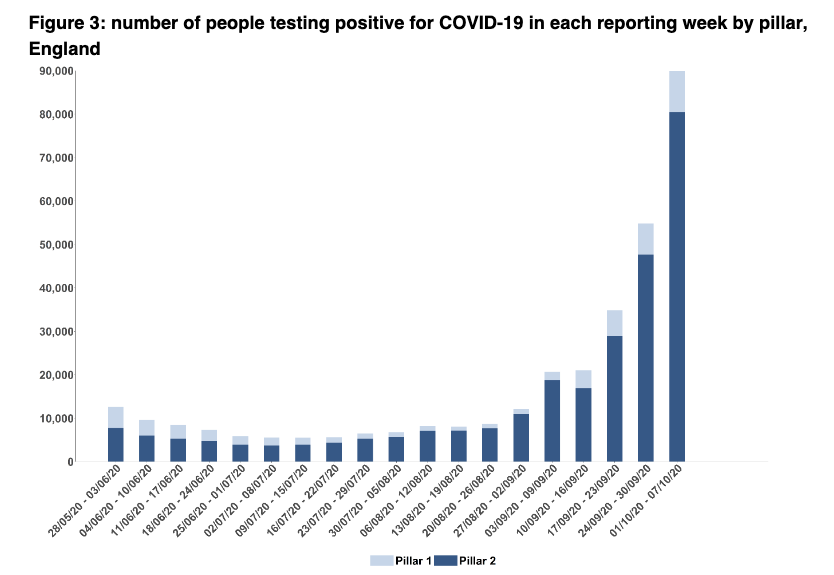
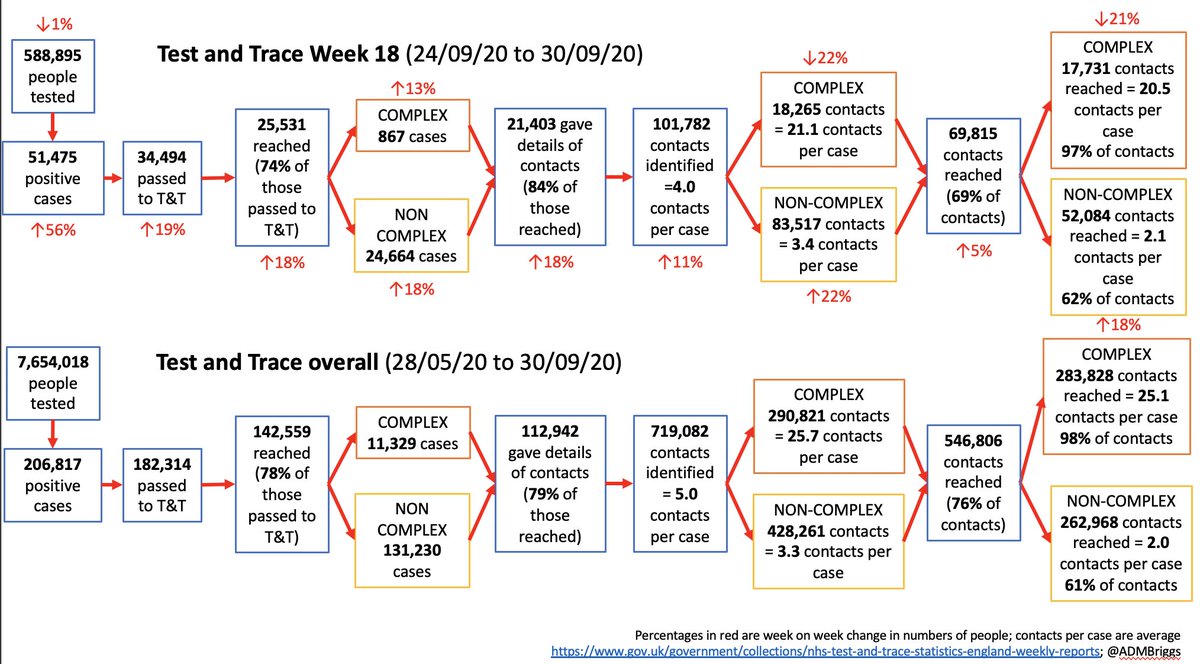
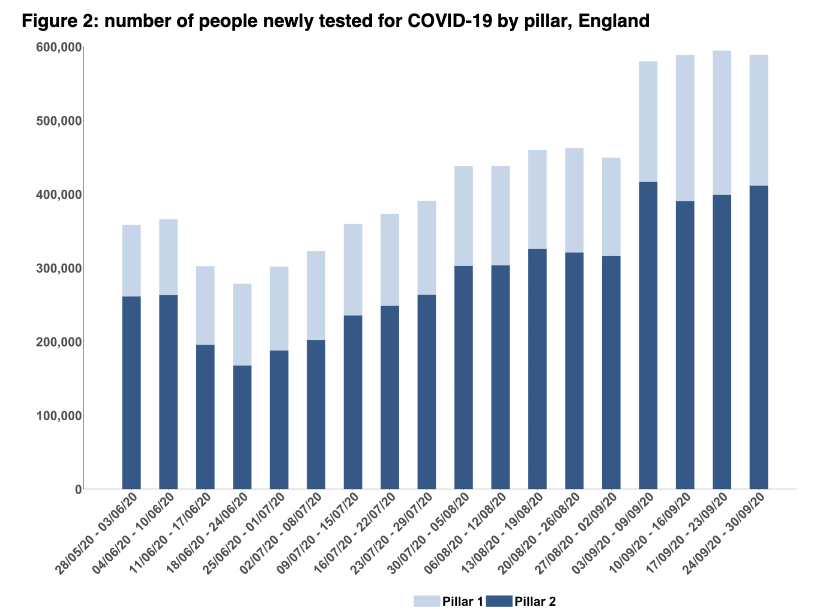
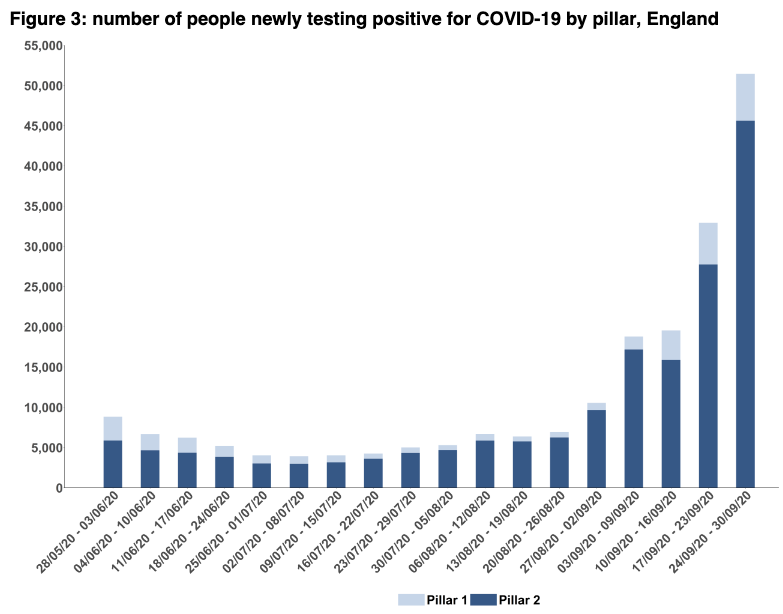
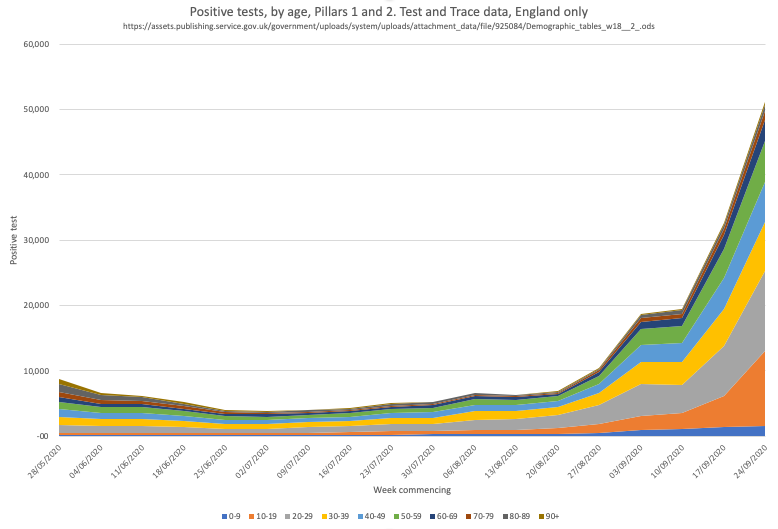
This is about double what's coming through on Test and Trace data for the same time. And note that ONS doesn't include care homes, hospitals OR INSTITUTIONS - this means Uni halls of residences and colleges where we know there are significant outbreaks.
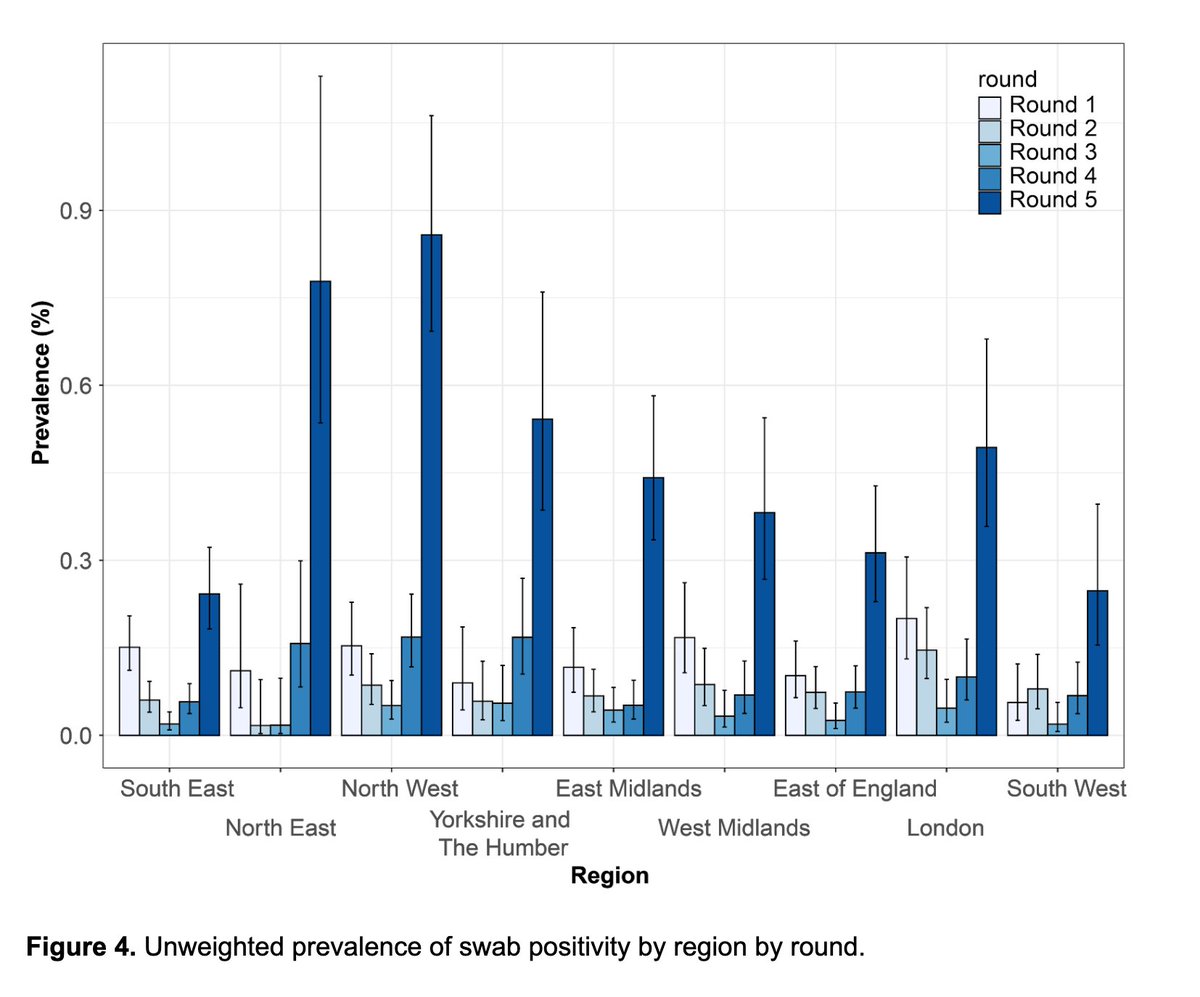
As with national testing data (as reported in PHE surveillance report), huge geographic variation with NE, NW, Yorkshire/Humber still massively more cases than elsewhere.

BUT cases may be plateauing in the north, although not in midlands/London.
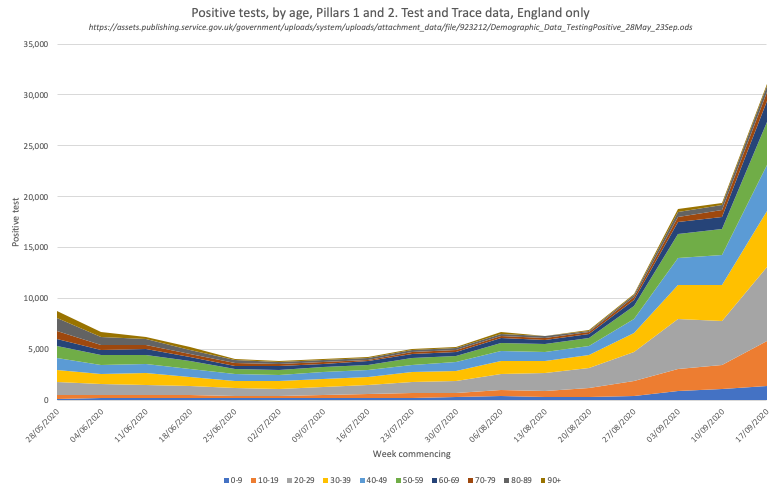
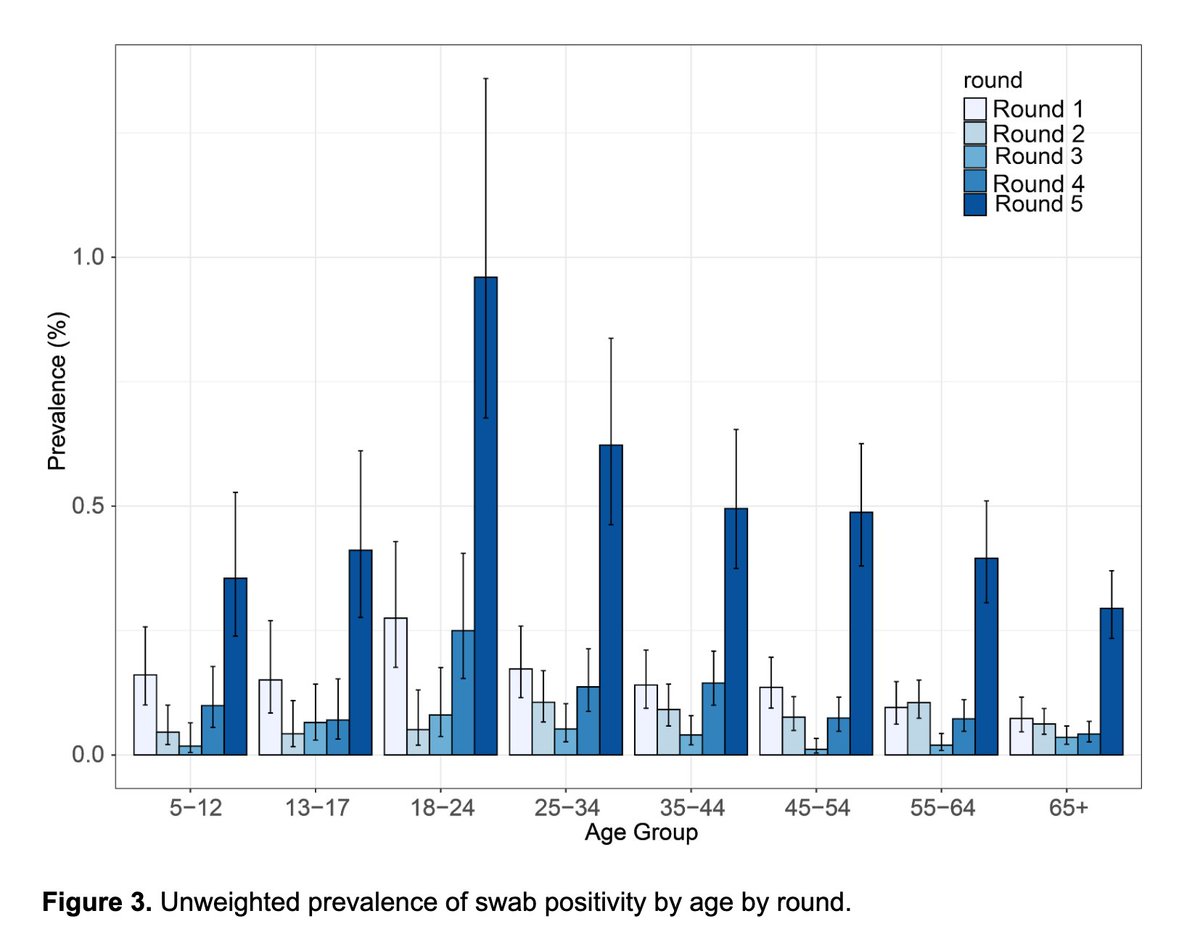
But for me this is the key graph – age 2 to 11 (school yr 6) there really is no change.

For secondary school age, there’s now a real uptick for children up to age 16, but for 17-24, it’s beginning to level off.
This is important, because as @apsmunro notes in his thread on the previous release, this way of breaking down age is far more informative for policy than the 10-19 and 20-29 categories use in gov data.

And again as @apsmunro says - it looks increasingly like primary school age children are really not an issue here, but unlike in previous weeks, we now seeing more cases in 11-16y/o, may have big implications for secondary schools if trend continues.
And the new Flu and COVID surveillance report from @PHE_uk now doesn't break down incidents in educational settings by type (university, secondary school etc).

This would be so helpful for knowing if these are community or school transmission. Please start doing it again!

• • •

Missing some Tweet in this thread? You can try to force a refresh
 

Keep Current with Adam Briggs

Adam Briggs Profile picture

Stay in touch and get notified when new unrolls are available from this author!

Read all threads

This Thread may be Removed Anytime!

PDF

Twitter may remove this content at anytime! Save it as PDF for later use!

Try unrolling a thread yourself!

how to unroll video
  1. Follow @ThreadReaderApp to mention us!

  2. From a Twitter thread mention us with a keyword "unroll"
@threadreaderapp unroll

Practice here first or read more on our help page!

More from @ADMBriggs

16 Oct
Wk 19 Test & Trace. 01/10/20 – 07/10/20.

Cases up.
Positivity up.
More cases reached but fewer contacts.
And it's taking longer.

Plus this week has 11k extra cases because of the delayed transfer of 15.8k cases

gov.uk/government/pub…

Summary in pics, detail in thread 👇
Cases⬆️64%

Particularly pillar 2 (community)
Cases⬆️69% from 47,656 to 80,485; positivity⬆️to 7.7% from 5.3%

For Pillar 1 (hospitals/outbreaks)
Cases⬆️32% from 7,119 to 9,389. Positivity now 2.5% from 1.9%

And new for TT, number of individuals tested each week rising wk on wk.
By age – as with last week, cases in 10-29 y/o STILL rising fast without big changes in numbers of tests done. This is reflected in the PHE surveillance positivity data by age.

Read 21 tweets
15 Oct
National Flu and COVID surveillance report now out, reporting 5-11th Oct.

Short(ish) summary

gov.uk/government/sta…
Cases and positivity (to 7.8% in pillar 2 and 2.7% in pillar 1).

Although not rising as quickly this week as in previous weeks, it remains hard to interpret what it means for community prevalence because it's still unclear what testing access issues remain across the country.
Case numbers and rates still dominated by 10-29y/o age gp, but worth looking at rising case rates in all age gps, including 0-4 and 5-9y/o
Read 16 tweets
12 Oct
Local contact tracing is where local authorities set up local teams to contact cases that the national team is unable to reach within 24hrs.

They're seen as part of the solution to rising case numbers in England.
And with good reason. Early data from places like Blackburn with Darwen @BWDDPH suggest that they're able to reach up to 9 out of 10 cases that couldn't be contacted by the national team.

manchestereveningnews.co.uk/news/uk-news/h…
Some of the cases that that national team miss don't want to be reached and won't ever engage.

Some just missed the call or didn't recognise the number.

And others are likely to be more vulnerable, socially isolated, digitally deprived, transient, or economically worse off.
Read 22 tweets
8 Oct
Week 18 Test & Trace data summary. 24/09/20 – 30/09/20.
And some of today's PHE surveillance rpt as well.

Not so good.

Cases, admissions, deaths up.

TT performance continues to worsen, not to mention Excelgate.

Summary in picture, detail in thread 👇

gov.uk/government/pub…
Cases in pillar 1 up 13% from 5,171 to 5,855 (NHS/PHE labs – outbreaks/hospital)
Cases in pillar 2 up 64% from 27,761 to 45,620 (community)

Number of new people tested – no change. This seems to have plateaued (see later in thread about this and positivity rates)
By age – rises in all age groups but note BIG jump in cases among 10-19yr olds.

This is alongside no change in number of new people age 10-19 tested.
Read 32 tweets
1 Oct
Week 17 Test & Trace data summary. 17/09/20 – 23/09/20.

Not a pretty picture.

Cases ⬆️61%.
Tests ↔️
Test positivity rate ++⬆️from 3.3% to 5.3% (+ some useful detail by age)

Test and Trace performance worse.

gov.uk/government/pub…

Summary in picture, detail in thread 👇
Despite no change in number of tests,

- cases in pillar 1 ⬆️34% from 3,653 to 4,898 (NHS/PHE labs – outbreaks/hospital)
- cases in pillar 2 ⬆️67% from 15,853 to 26,475 (community)

Means positivity for pillar 2 ⬆️from 3.3% to 6.7%
And pillar 1 ⬆️from 1.8% to 2.5%
And like @PHE_uk surveillance, they now give data by age

Case numbers still dominated by 20-29/yr olds, but growth in cases across all ages (except 90+)

And there are big differences by age, steep rises across all age gps b/w 20-70yrs
0-19yrs much less change in positivity rate
Read 24 tweets
1 Oct
REACT-1 study results - data to 26th Sept. Some context.

1 in 200 in Eng infected (far more than ONS survey to 19th Sept, which estimates 1 in 500)

R number lower-now 1.1, doubling time longer-now 10.6 days, BUT rise in number infected is substantial.

imperial.ac.uk/news/205473/la…
Prevalence highest in 18-24y/o (same as ONS)
BUT 7 fold increase in rate over 65y/o.

And BIG regional variation.

This is similar to ONS survey results.
So encouraging that R number falling, BUT this will be different in different parts of the country.

Rise in infection rates in older people.

Rates 2x as high in Black & Asian ethnicity vs White

And now 0.55% of population infected=approx 411,000 people (ONS estimate 104,000).
Read 5 tweets

Did Thread Reader help you today?

Support us! We are indie developers!


This site is made by just two indie developers on a laptop doing marketing, support and development! Read more about the story.

Become a Premium Member ($3/month or $30/year) and get exclusive features!

Become Premium

Too expensive? Make a small donation by buying us coffee ($5) or help with server cost ($10)

Donate via Paypal Become our Patreon

Thank you for your support!

Follow Us on Twitter!