Weekly round up of useful / reliable English covid statistics:
1. Incidence
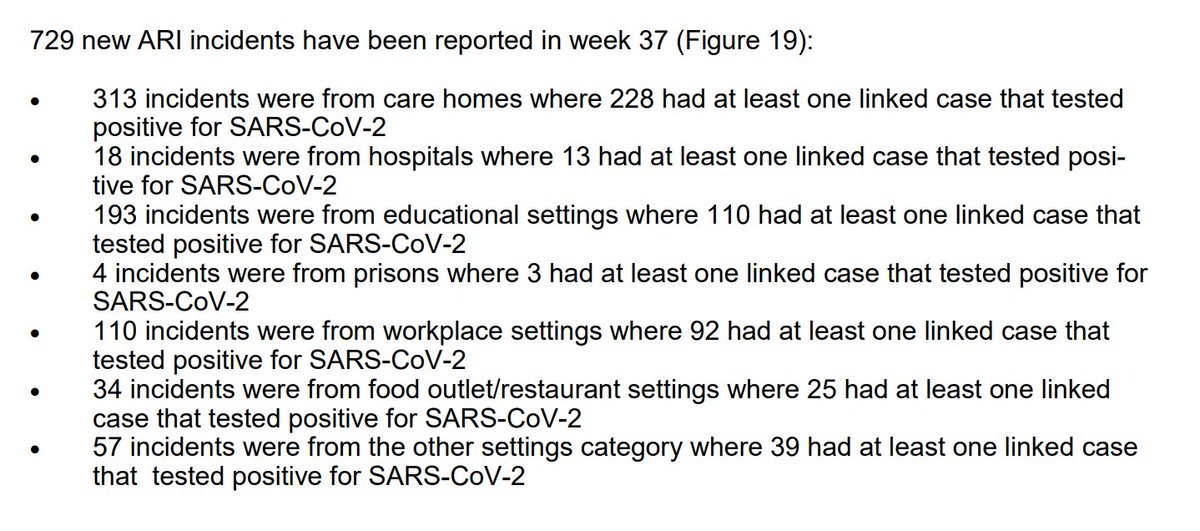
2. Care home outbreaks
3. Hospital / ICU admissions and deaths
4. Covid triage
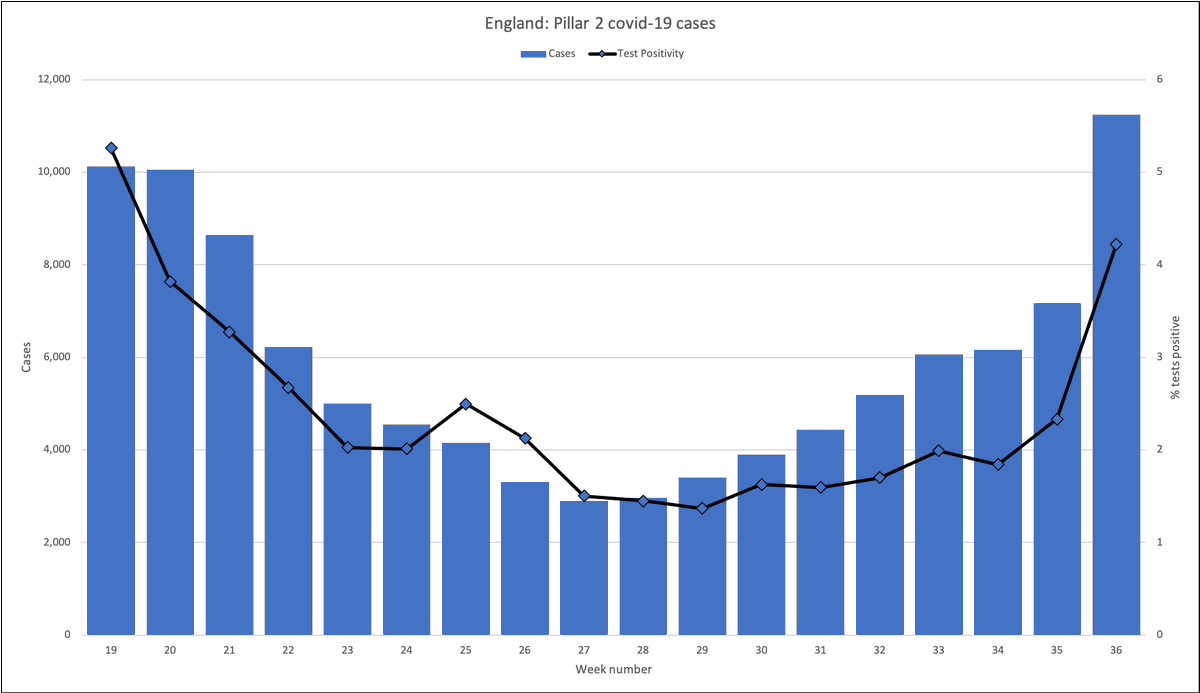
5. Cases
6. Contact tracing
7. Mortality
8. Miscellaneous: nosocomial
#ahcveng
1. Incidence
2. Care home outbreaks
3. Hospital / ICU admissions and deaths
4. Covid triage
5. Cases
6. Contact tracing
7. Mortality
8. Miscellaneous: nosocomial
#ahcveng
1. Incidence
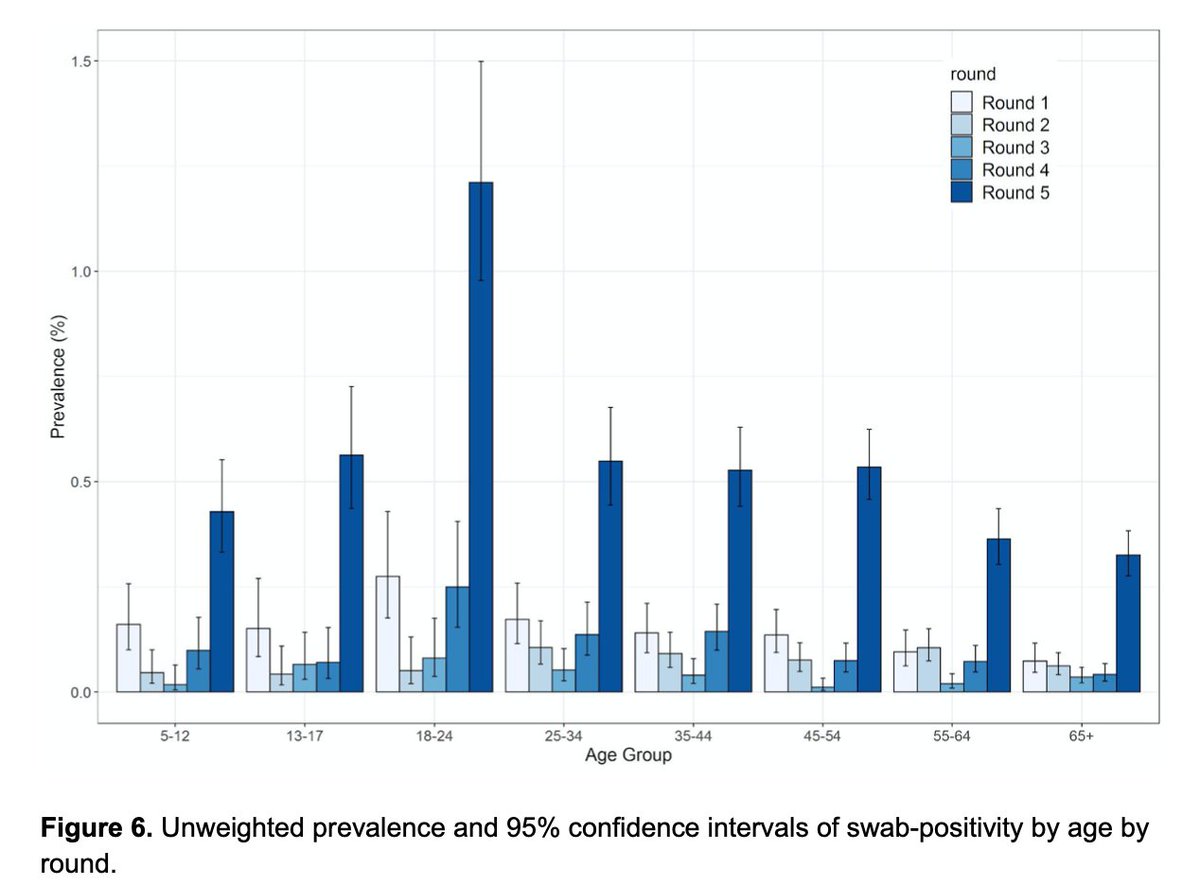
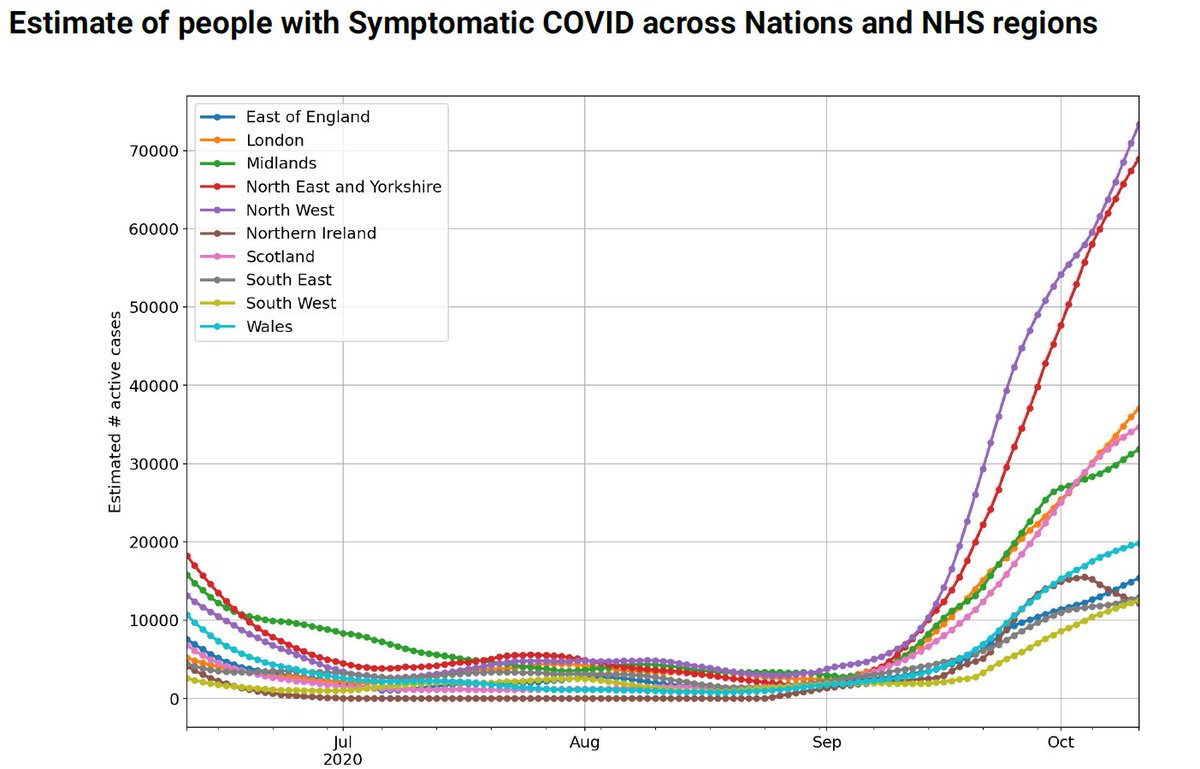
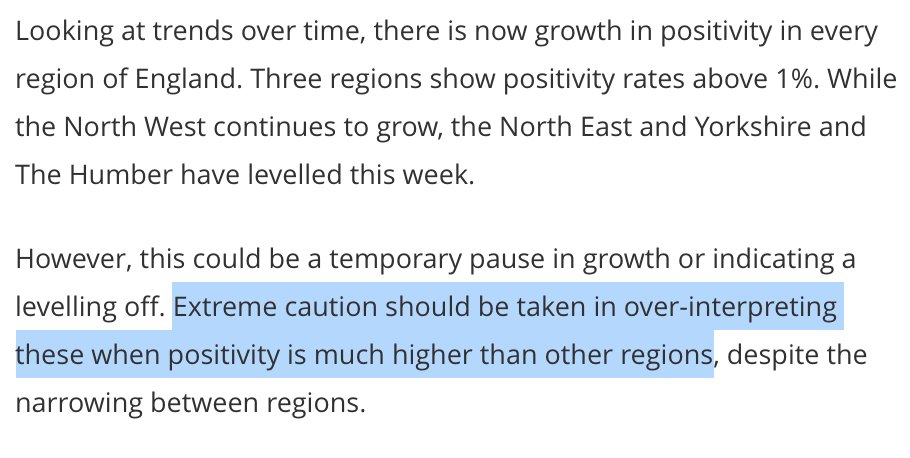
ONS shows continued increase in incidence as the seasons change, driven by areas of the country subject to enhanced lockdown restrictions.
Great news: clear divergence between incidence in the vulnerable >70 versus younger age groups.
ons.gov.uk/peoplepopulati…
ONS shows continued increase in incidence as the seasons change, driven by areas of the country subject to enhanced lockdown restrictions.
Great news: clear divergence between incidence in the vulnerable >70 versus younger age groups.
ons.gov.uk/peoplepopulati…
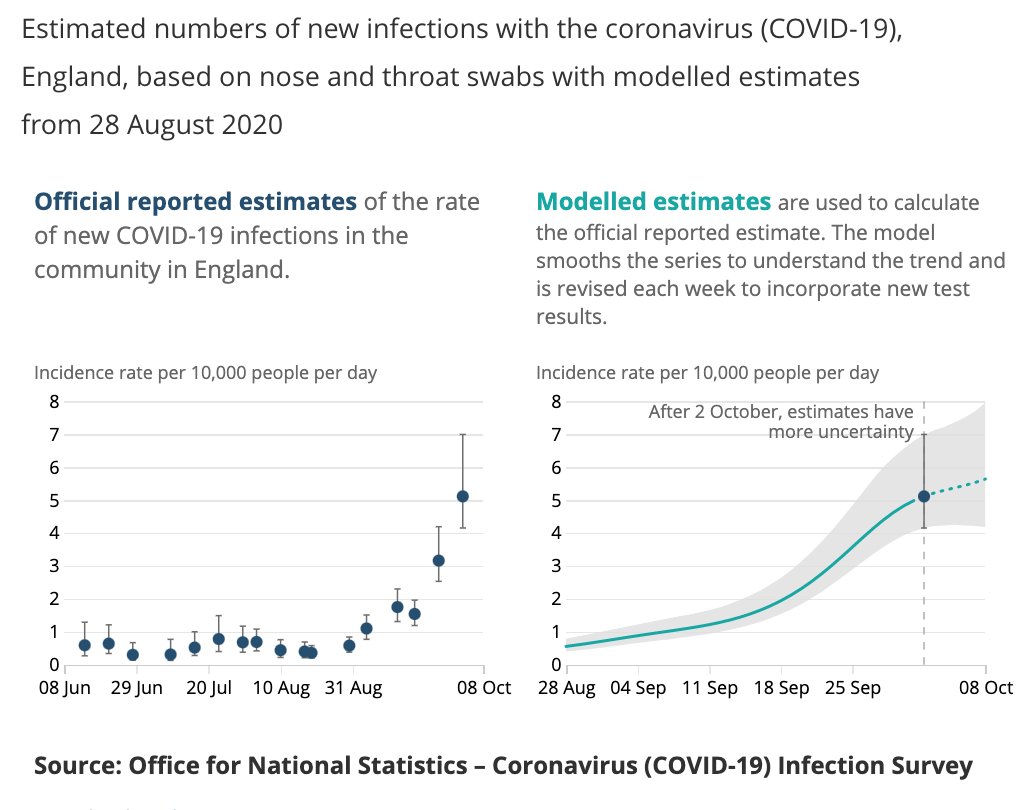


(Caution due on the NE/Yorks piece of that chart: doesn't tally with the Zoe incidence data, which otherwise generally ties in well with ONS).


2. Care home outbreaks
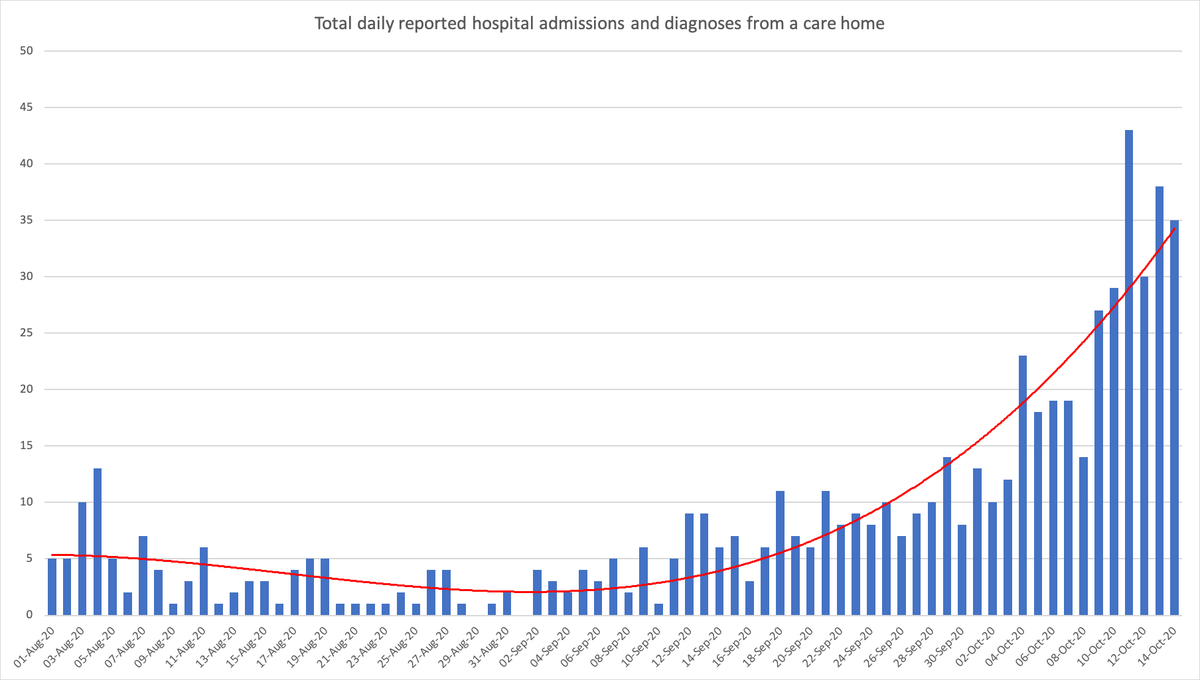
Another bad week. Somebody suggested that this might be picking up staff cases, but NHS now publish hospital admissions from care homes showing an increase.
Care homes now 25% of institutional outbreaks.
assets.publishing.service.gov.uk/government/upl…
england.nhs.uk/statistics/sta…
Another bad week. Somebody suggested that this might be picking up staff cases, but NHS now publish hospital admissions from care homes showing an increase.
Care homes now 25% of institutional outbreaks.
assets.publishing.service.gov.uk/government/upl…
england.nhs.uk/statistics/sta…


3. Hospital / ICU admissions and deaths
Extreme variance across the country in both level and trajectory, though we are far off the spring peak.
Admissions include nosocomial (hospital-acquired) cases: see 8 below
coronavirus.data.gov.uk/healthcare?are…
england.nhs.uk/statistics/sta…
Extreme variance across the country in both level and trajectory, though we are far off the spring peak.
Admissions include nosocomial (hospital-acquired) cases: see 8 below
coronavirus.data.gov.uk/healthcare?are…
england.nhs.uk/statistics/sta…


Healthcare burden: Covid inpatients in hospital and mechanical ventilation beds ("ICU"?) show very significant differences in both level and trajectory across the country.
So a one-size-fits-all approach to protect hospital capacity is clearly nonsense.
So a one-size-fits-all approach to protect hospital capacity is clearly nonsense.


4. Covid triage
Still no surge in triage calls from over 70s, which should be a "canary in the coalmine" of an approaching spike in hospital admissions.
Back-to-school spike seems to have receded.
digital.nhs.uk/data-and-infor…
Still no surge in triage calls from over 70s, which should be a "canary in the coalmine" of an approaching spike in hospital admissions.
Back-to-school spike seems to have receded.
digital.nhs.uk/data-and-infor…


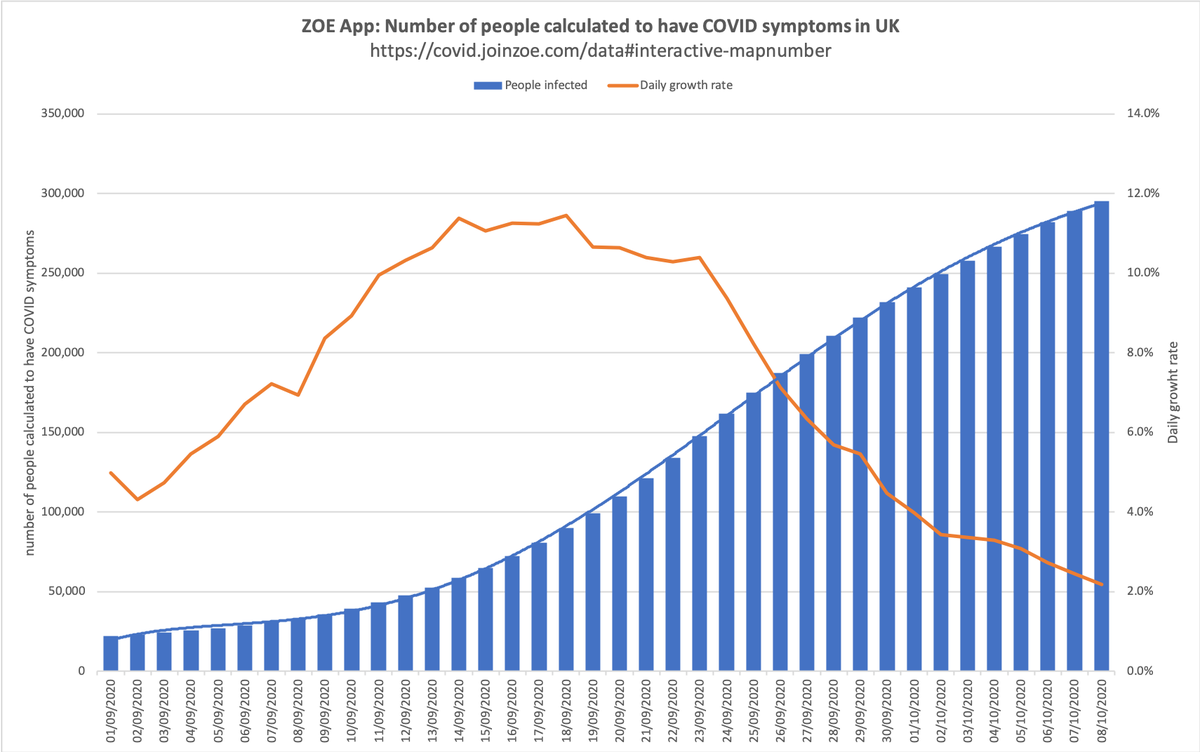
5. Cases
coronavirus.data.gov.uk/cases?areaType…
3 recent days around 18,000 cases per day; trajectory unclear.
Variance across the country: compare for example South West and North West.
Much recent growth seems to be universities, so should subside:
coronavirus.data.gov.uk/cases?areaType…
3 recent days around 18,000 cases per day; trajectory unclear.
Variance across the country: compare for example South West and North West.
Much recent growth seems to be universities, so should subside:
https://twitter.com/RP131/status/1317152328311595008


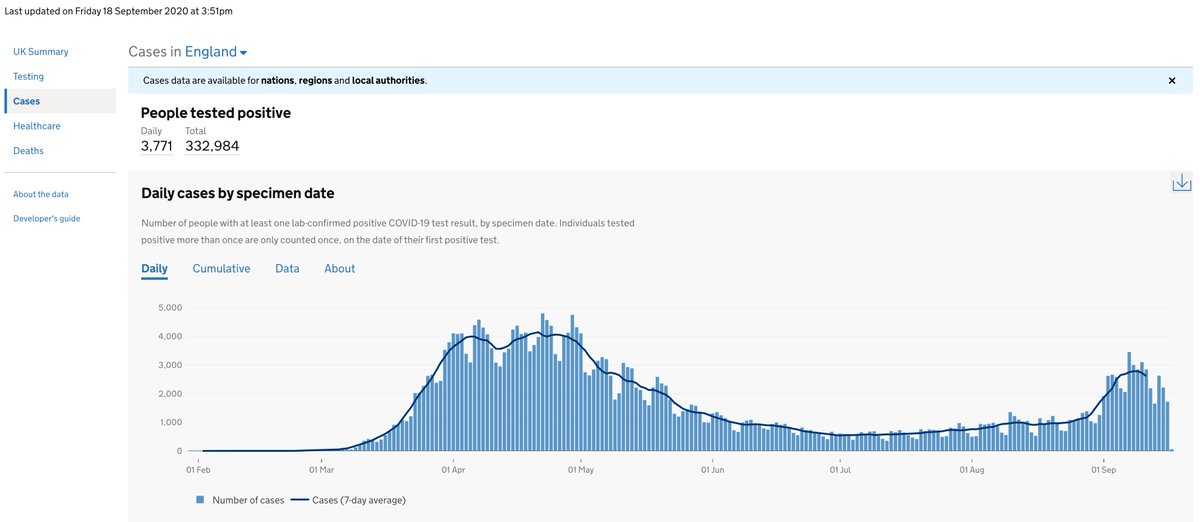
If you thought that the total of 'cases' is the number of people who've tested positive, you're wrong.
New PHE protocol is that people can only be included in the figures once per week, depending on day of the week. Welcome to the funny farm.
gov.uk/government/pub…
New PHE protocol is that people can only be included in the figures once per week, depending on day of the week. Welcome to the funny farm.
gov.uk/government/pub…

6. Contact tracing
Now an expensive, embarrassing irrelevance: the slippage at every stage is dreadful.
77% positive tests reached
85% provided contacts
58% contacts reached and asked to isolate
(We know that only ~10% will comply fully)
gov.uk/government/col…
Now an expensive, embarrassing irrelevance: the slippage at every stage is dreadful.
77% positive tests reached
85% provided contacts
58% contacts reached and asked to isolate
(We know that only ~10% will comply fully)
gov.uk/government/col…


7. Mortality
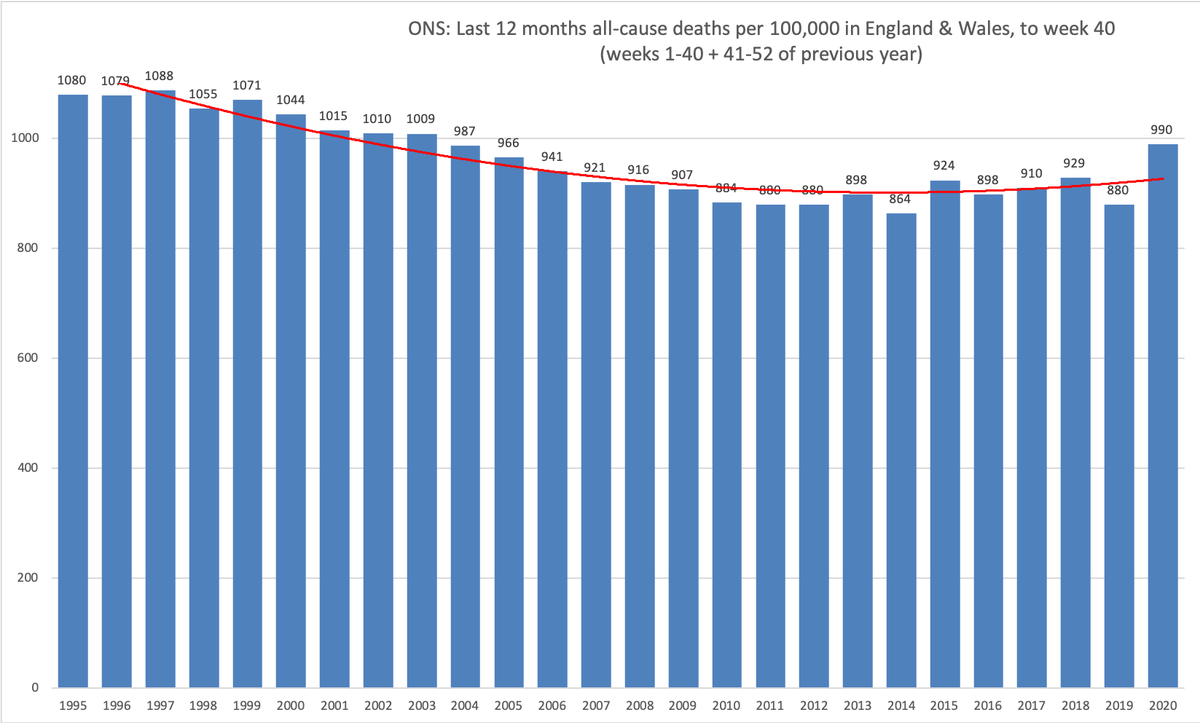
All-cause mortality (ONS) at around 2005 levels, although some will be catch-up from 2019's very low level.
Standardised mortality from ONS & actuaries, published monthly, the best to look at this - same pattern.
ons.gov.uk/peoplepopulati…
All-cause mortality (ONS) at around 2005 levels, although some will be catch-up from 2019's very low level.
Standardised mortality from ONS & actuaries, published monthly, the best to look at this - same pattern.
https://twitter.com/COVID19actuary/status/1313553878902767617?s=20
ons.gov.uk/peoplepopulati…


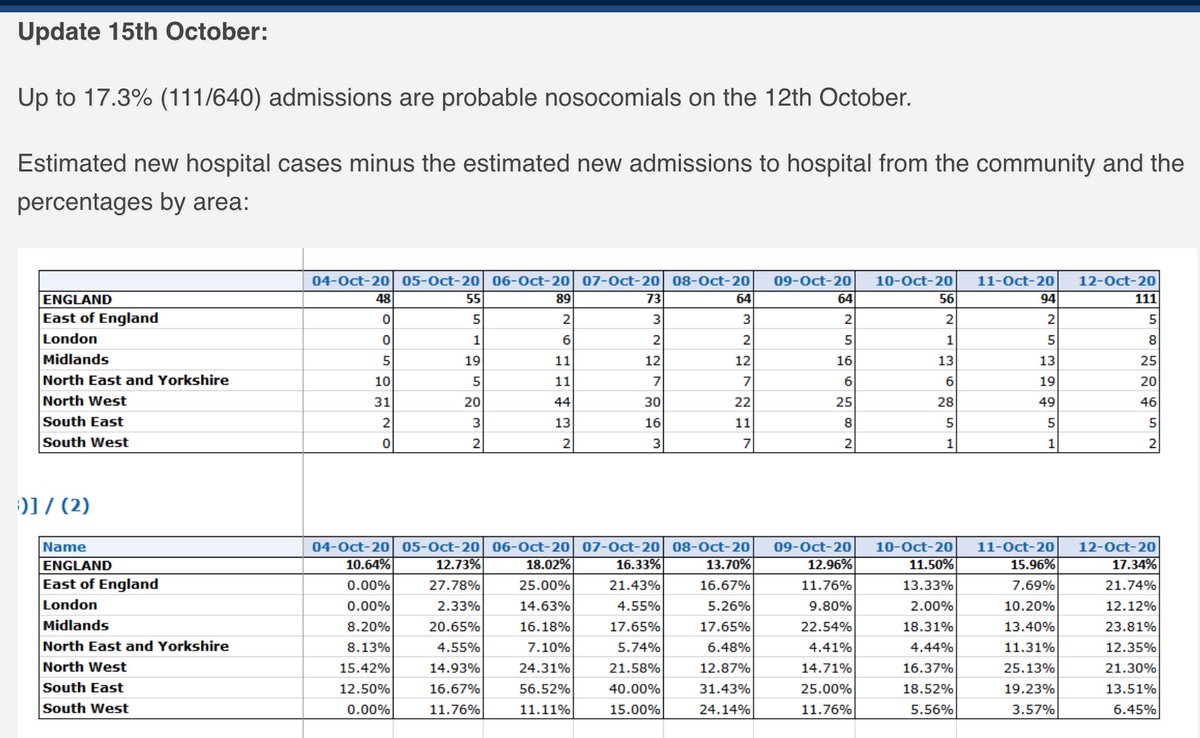
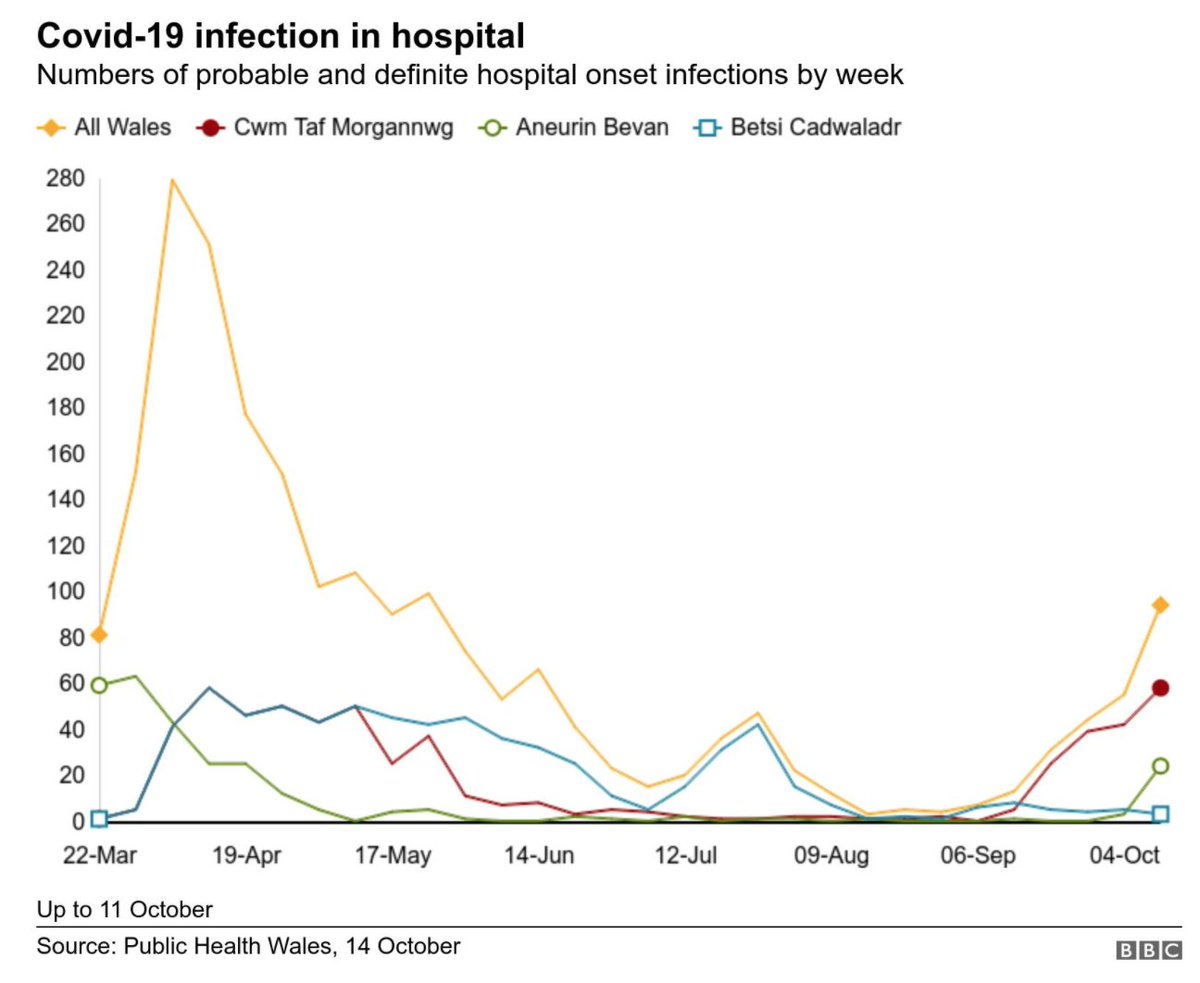
8. Miscellaneous: Nosocomial
CEBM (Oxford) have made a stab at calculating hospital-acquired (nosocomial) infections using NHS data: cebm.net/covid-19/proba…
Worrying given the mortality of these infections: Royal Glamorgan now 38 deaths from c.150 cases: bbc.co.uk/news/uk-wales-…
CEBM (Oxford) have made a stab at calculating hospital-acquired (nosocomial) infections using NHS data: cebm.net/covid-19/proba…
Worrying given the mortality of these infections: Royal Glamorgan now 38 deaths from c.150 cases: bbc.co.uk/news/uk-wales-…
[Postscript: @ActuaryByDay has just published an updated thread on English ICU covid cohort, well worth a read:
https://twitter.com/ActuaryByDay/status/1317391421851172864?s=20]
• • •
Missing some Tweet in this thread? You can try to
force a refresh