🧵the sloppy advocacy of #nuclear zealots
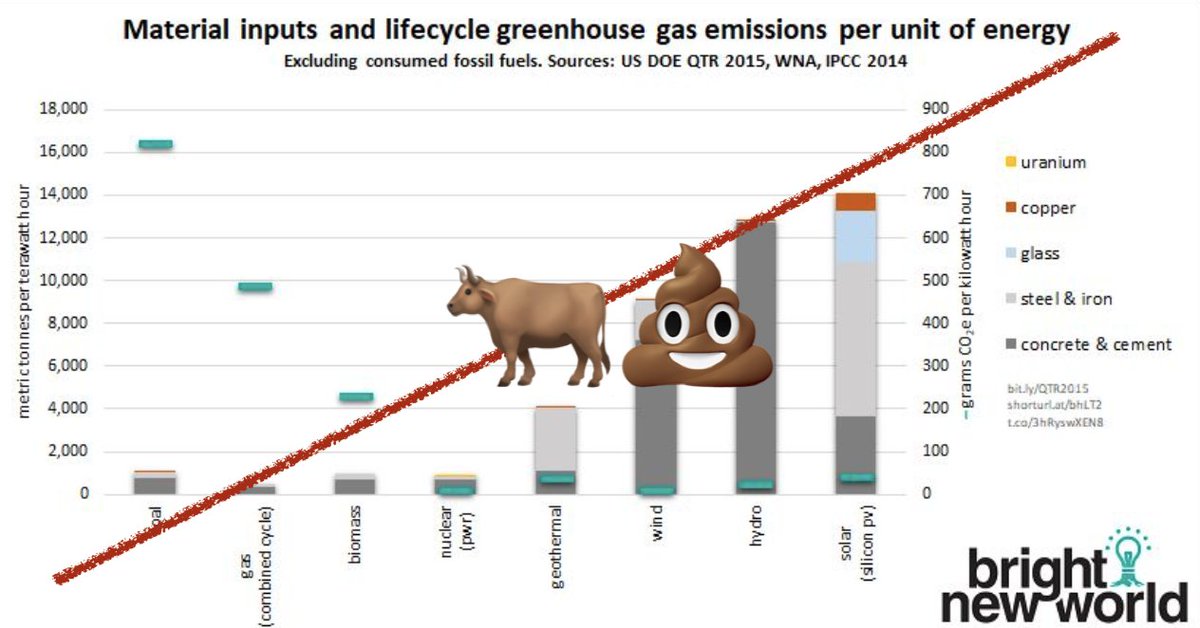
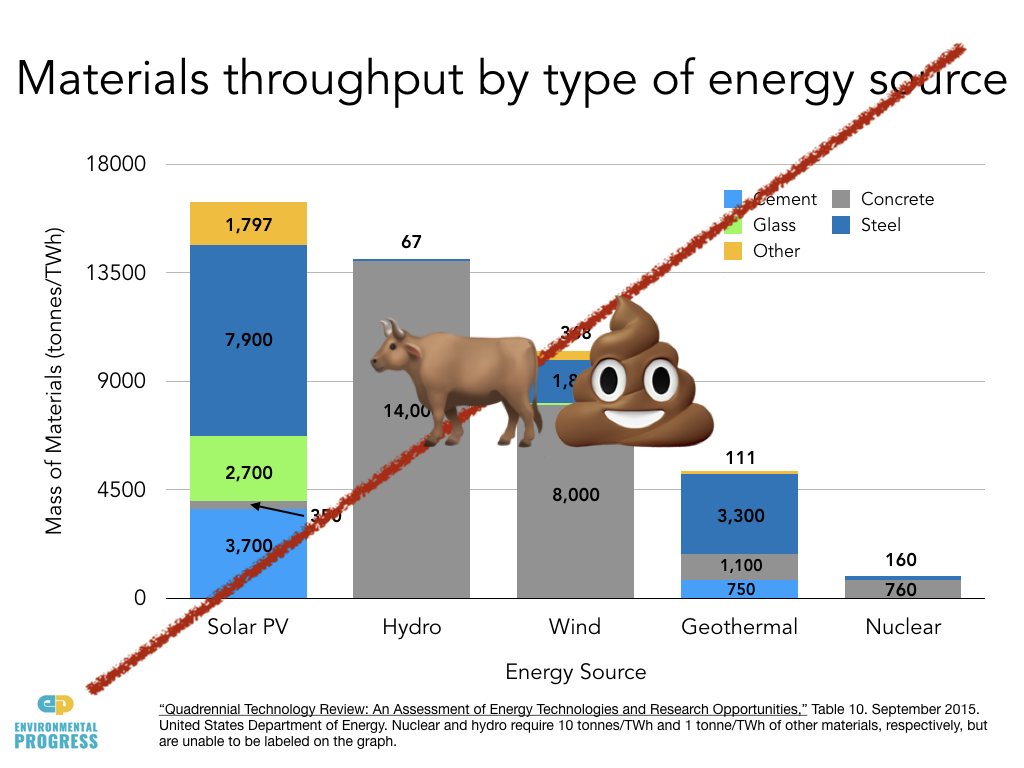
earlier this year adelaide-based nuclear lobby group @BNW_Aus submitted this chart (sans emoji) to the #victorian parliamentary inquiry into #nuclear prohibition.
one problem: it’s 🐂💩!
earlier this year adelaide-based nuclear lobby group @BNW_Aus submitted this chart (sans emoji) to the #victorian parliamentary inquiry into #nuclear prohibition.
one problem: it’s 🐂💩!
.@BNW_Aus claims to be an environment group, yet *all* they seem to do is fight against australia’s nuclear bans.
i’ve no problem with nuclear advocacy — nuclear technology is pretty amazing & we should keep our minds open — but why not just be honest & admit your sole purpose?
i’ve no problem with nuclear advocacy — nuclear technology is pretty amazing & we should keep our minds open — but why not just be honest & admit your sole purpose?
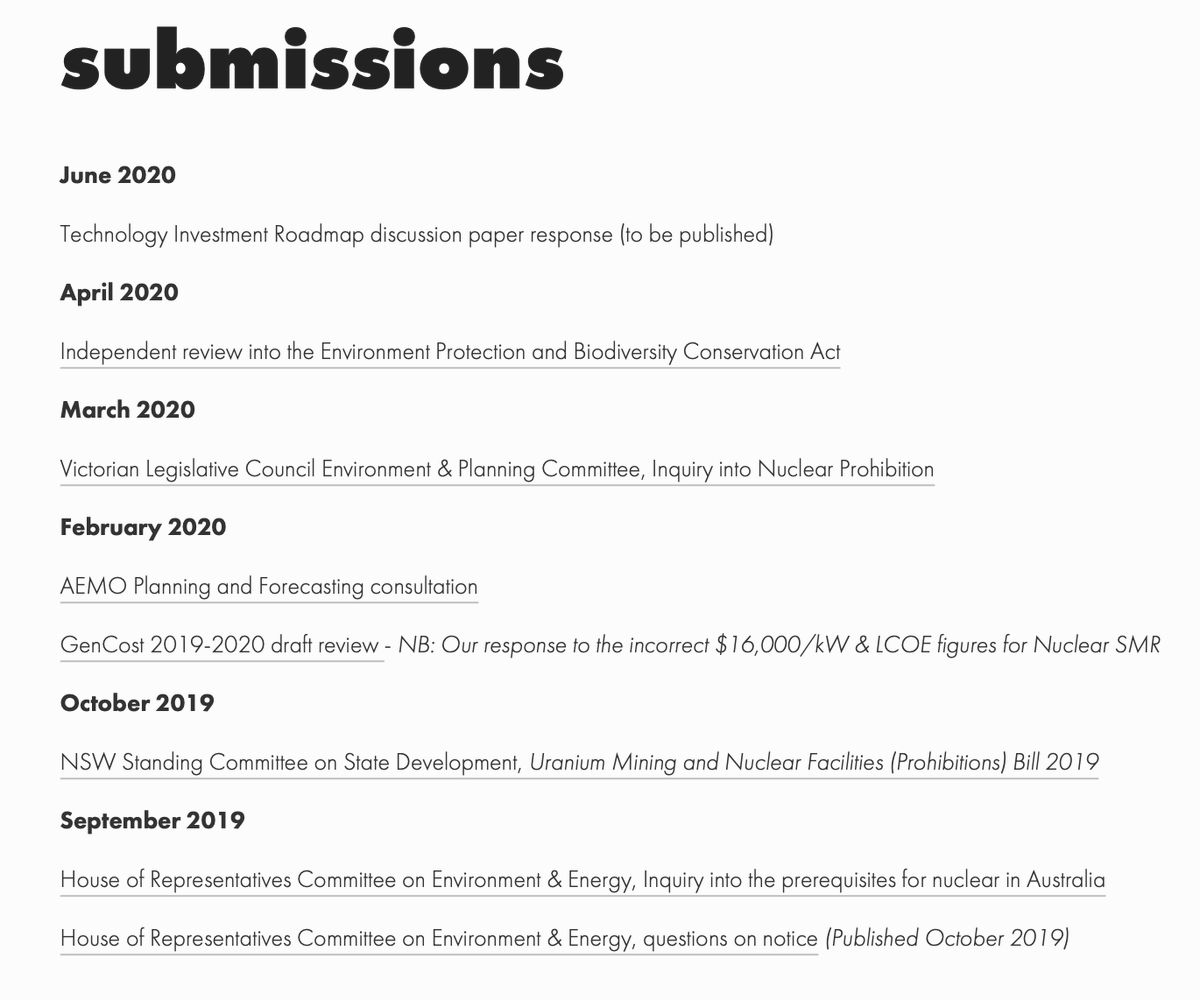
the chart aims to show that nuclear is awesome because it’s just so thrifty.
BNW's GM @dayne_eckermann says it’s relevant because “you need materials mined from the ground to make things. it's better if we limit that as much as possible to protect the environment”.
fair enough.
BNW's GM @dayne_eckermann says it’s relevant because “you need materials mined from the ground to make things. it's better if we limit that as much as possible to protect the environment”.
fair enough.
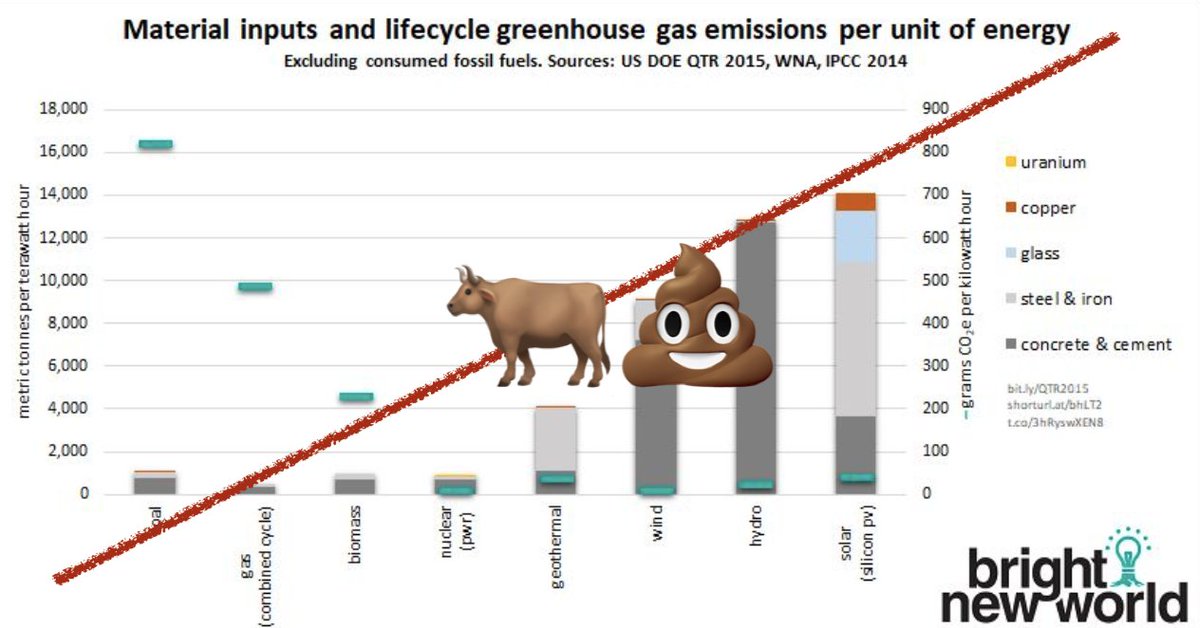
.@BNW_Aus's chart claims you need ~7,200t of steel & iron and ~3,700t of concrete & cement to produce one terawatt hour of electricity from solar PV.
holy crap… that’s a scary amount of stuff!
*but* it's wrong. very wrong.
(side note: who sums concrete & cement volumes?)
holy crap… that’s a scary amount of stuff!
*but* it's wrong. very wrong.
(side note: who sums concrete & cement volumes?)
while the material input for a solar farm naturally varies with construction techniques & local conditions, @BNW_Aus's number does look awfully high.
…so i did what BNW never bothered to do…
i asked a solar developer.
…so i did what BNW never bothered to do…
i asked a solar developer.
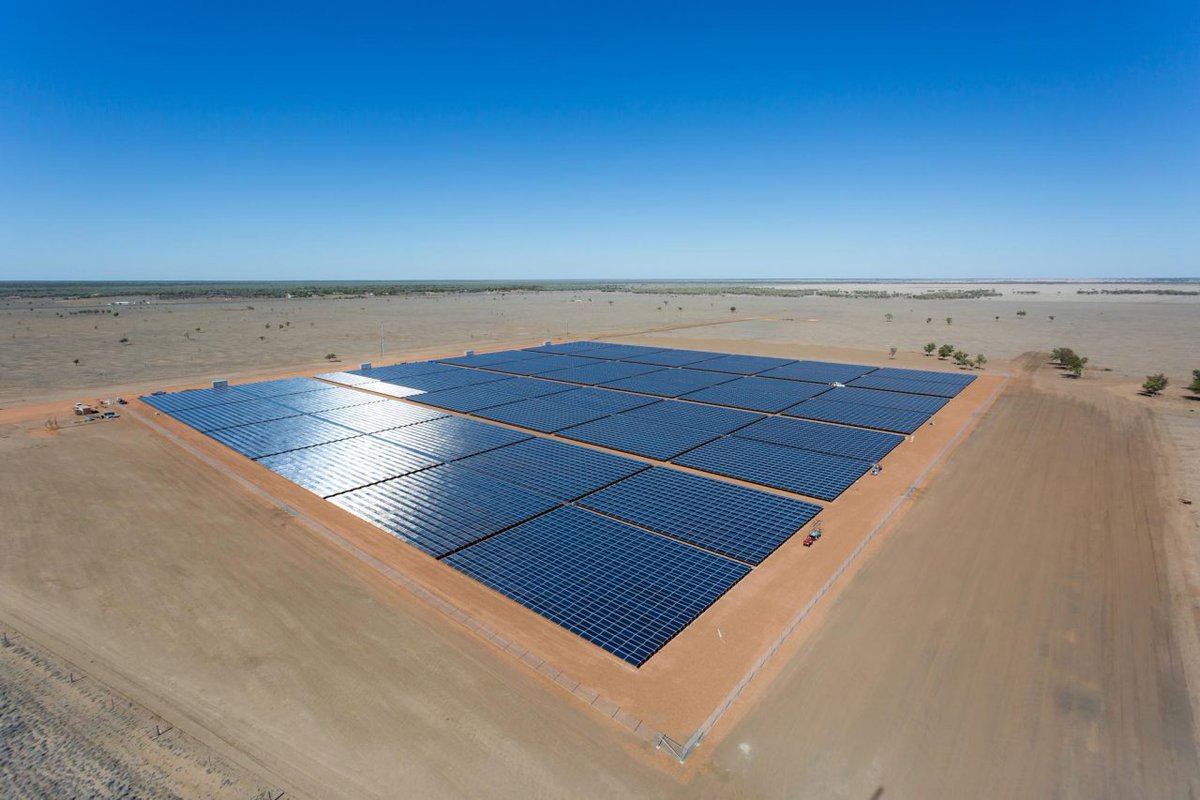
construction will soon start on the 5MW kentucky solar farm in nrthrn NSW.
KSF will use fixed-tilt east-west panels, PEG® framing system & integrated central inverter/transformers.
…and just 2.8m³ of concrete — for the fence post end-assemblies!
it’ll look a bit like this:
KSF will use fixed-tilt east-west panels, PEG® framing system & integrated central inverter/transformers.
…and just 2.8m³ of concrete — for the fence post end-assemblies!
it’ll look a bit like this:
comparing @BNW_Aus estimates with KSF, you can see that BNW *massively* overstates the materials required for this modern solar farm:
• copper: 25x overstated
• glass: 2.6x
• steel & iron: 17x
• concrete & cement: 218x!
hoo boy, how embarrassing!
• copper: 25x overstated
• glass: 2.6x
• steel & iron: 17x
• concrete & cement: 218x!
hoo boy, how embarrassing!

if we reformat the data so that it is directly comparable to the BNW submission, we see that the “total material use” for this solar case study turns out to be very similar to their value for #nuclear:
(stacking material quantities… what a weird thing to do…)
(stacking material quantities… what a weird thing to do…)

so how did @BNW_Aus get it __so__ wrong?
they grabbed their numbers from the 2015 Quadrennial Technology Review, published by the US dep’t of @energy.
energy.gov/quadrennial-te…
but where did that study get its numbers?
they grabbed their numbers from the 2015 Quadrennial Technology Review, published by the US dep’t of @energy.
energy.gov/quadrennial-te…
but where did that study get its numbers?
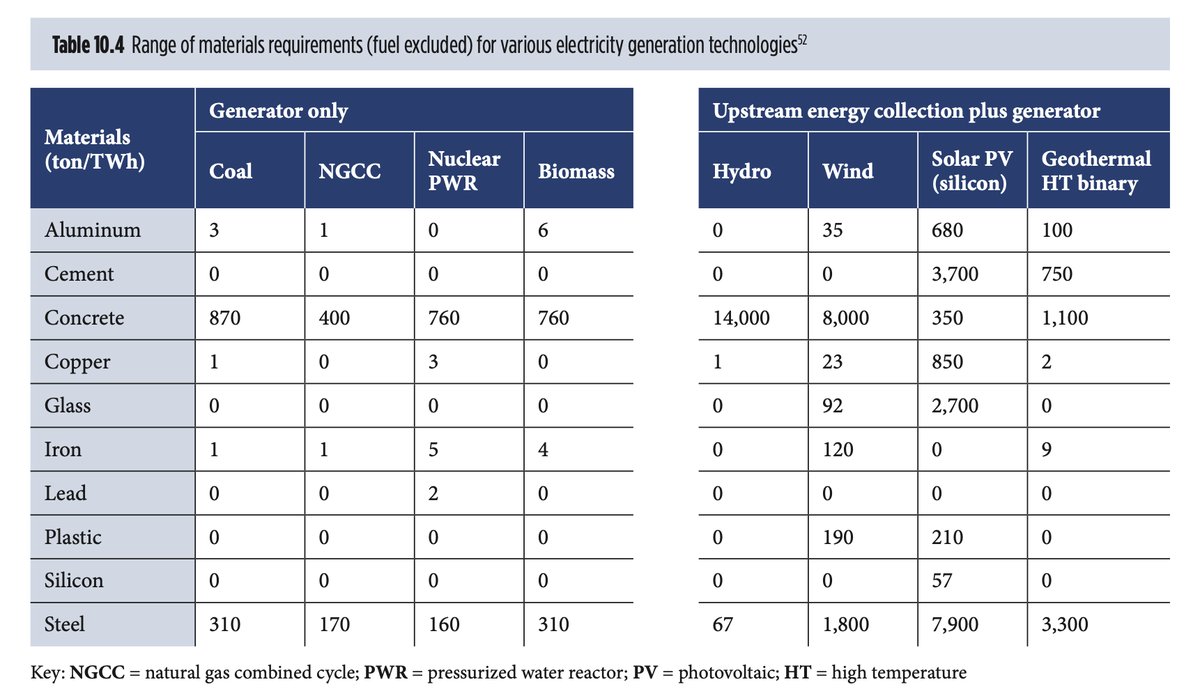
the QTR grabbed the figures from the 2014 Greenhouse gases, Regulated Emissions, and Energy use in Technologies Model (GREET), developed by the @argonne national laboratory.
greet.es.anl.gov
but where did that paper source its numbers?
greet.es.anl.gov
but where did that paper source its numbers?

GREET pulled its numbers from a 2010 paper, also from @argonne called “Life-Cycle Analysis Results of Geothermal Systems in Comparison to Other Power Systems”.
…which in turn drew from 4 *ancient* papers:
greet.es.anl.gov/publication-ge…
…which in turn drew from 4 *ancient* papers:
greet.es.anl.gov/publication-ge…

that 2010 paper took a simple average of the 4 papers, without *any* analysis.
one of those papers, pacca and horvath (2002), is a clear outlier, dragging the average towards crazy town!
13,343t/TWh vs KSF's 17.
out by 3 orders of magnitude!
scribd.com/document/48092…
one of those papers, pacca and horvath (2002), is a clear outlier, dragging the average towards crazy town!
13,343t/TWh vs KSF's 17.
out by 3 orders of magnitude!
scribd.com/document/48092…
…but let's cut pacca and horvath some slack!
back in 2002 _nobody_ had ever built a large solar PV project… the global industry was 1/1000th its size today.
this is so quaint! they were imagining putting concentrating lenses over the 100W panels…
back in 2002 _nobody_ had ever built a large solar PV project… the global industry was 1/1000th its size today.
this is so quaint! they were imagining putting concentrating lenses over the 100W panels…
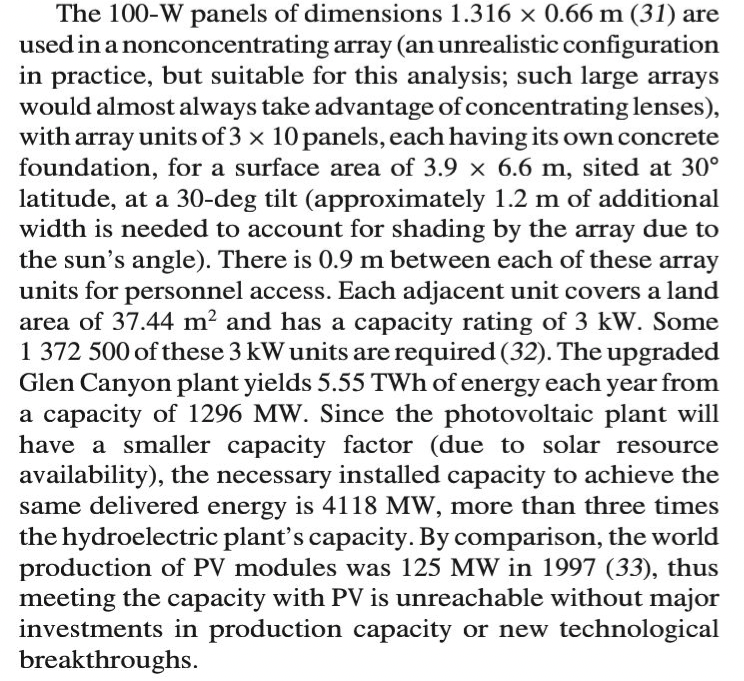
aha! that explains how @BNW_Aus got it so wrong.
their analysis drew heavily on 2002 musings about a solar sector that could only be imagined.
6-7 major innovation cycles have since transpired.
…so where did BNWs #nuclear numbers come from?
(i bet they didn't even know.)
their analysis drew heavily on 2002 musings about a solar sector that could only be imagined.
6-7 major innovation cycles have since transpired.
…so where did BNWs #nuclear numbers come from?
(i bet they didn't even know.)
.@BNW_Aus's #nuclear numbers are ultimately sourced from a 1974 oak ridge technical report based on a 1971 reference design.
osti.gov/biblio/4284838
osti.gov/biblio/4284838
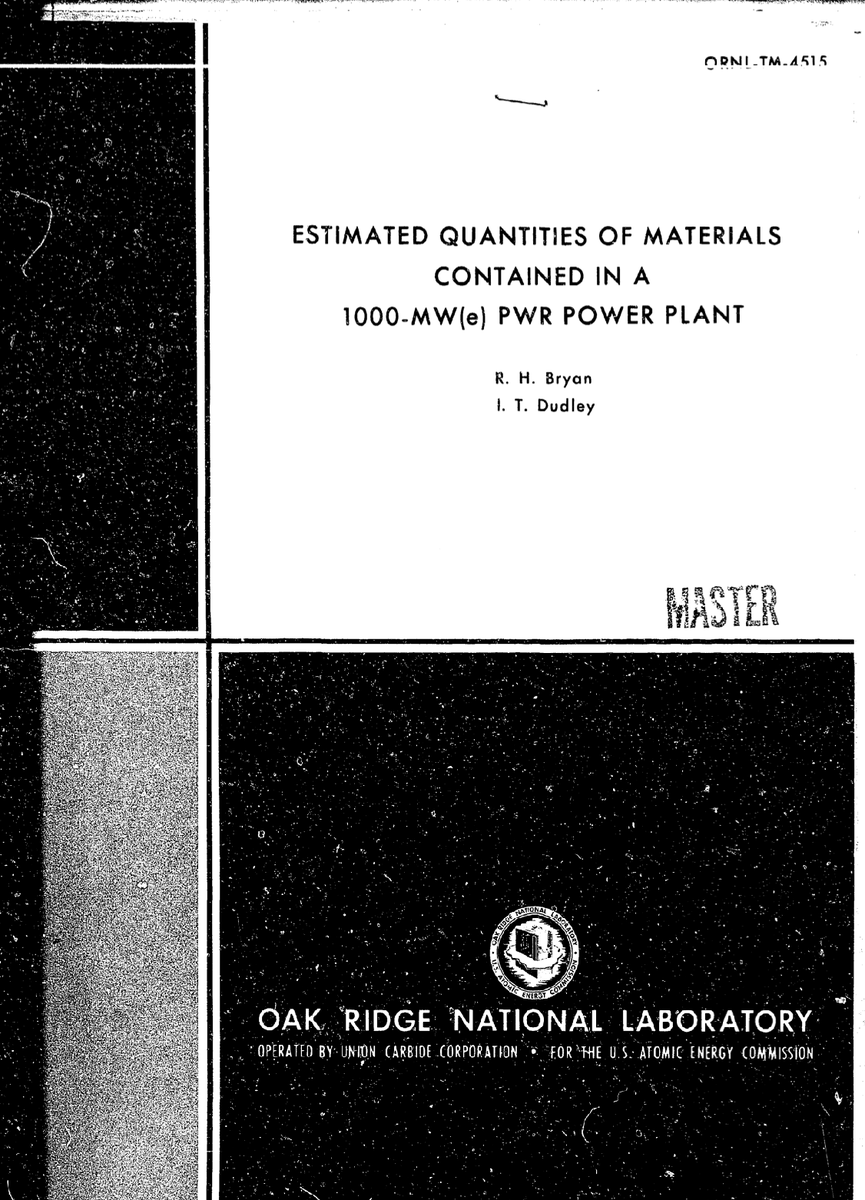
the design predates three mile island, chernobyl, 9/11 & fukushima — each of which impacted our understanding of nuclear safety, and collectively had significant impacts on plant design.
👇 even in 1974 the authors highlighted that the design was not to then current standards!
👇 even in 1974 the authors highlighted that the design was not to then current standards!

the introduction of the 1969 US national environmental policy act meant it was no longer ok to take unlimited water from rivers to cool reactors.
most nuclear plants built after 1969 required cooling towers…
most nuclear plants built after 1969 required cooling towers…

beautiful pieces of engineering they may be, but those cooling towers require quite a bit of concrete and steel…
@BNW_Aus ignores this material.
@BNW_Aus ignores this material.
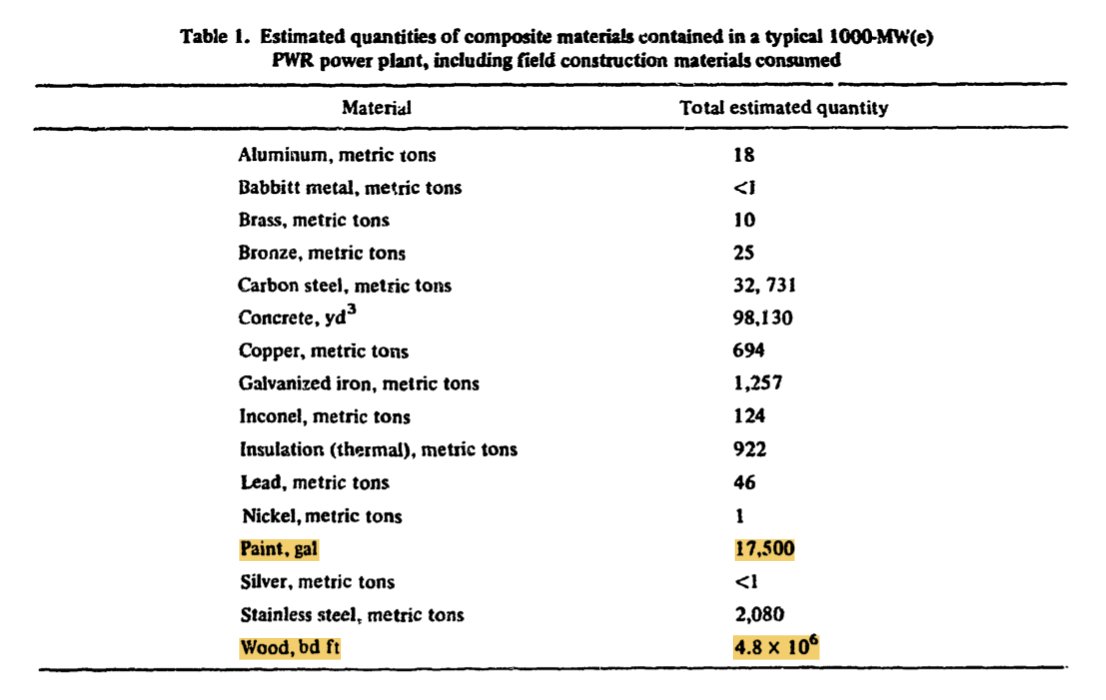
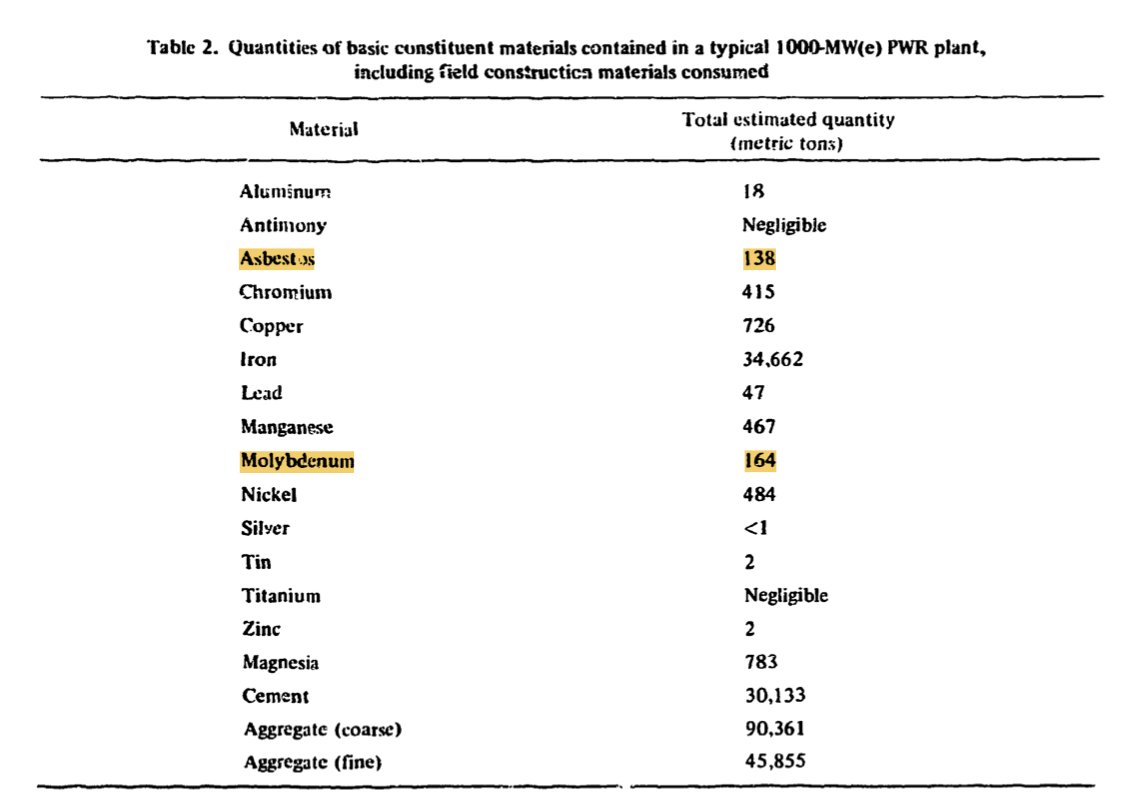
…and while the 1971 #nuclear project excludes the electrical switchyard and all modern safety systems, the analysis does include these gems:
• 138 tonnes of asbestos
• 164 tonnes of molybdenum
• 17,500 gallons of paint, and
• 4,800,000 board-feet of lumber.

• 138 tonnes of asbestos
• 164 tonnes of molybdenum
• 17,500 gallons of paint, and
• 4,800,000 board-feet of lumber.
of course you’d probably do it differently these days… in fact, you have to.
…but wait, there’s more. what about upstream and downstream material use?
…but wait, there’s more. what about upstream and downstream material use?
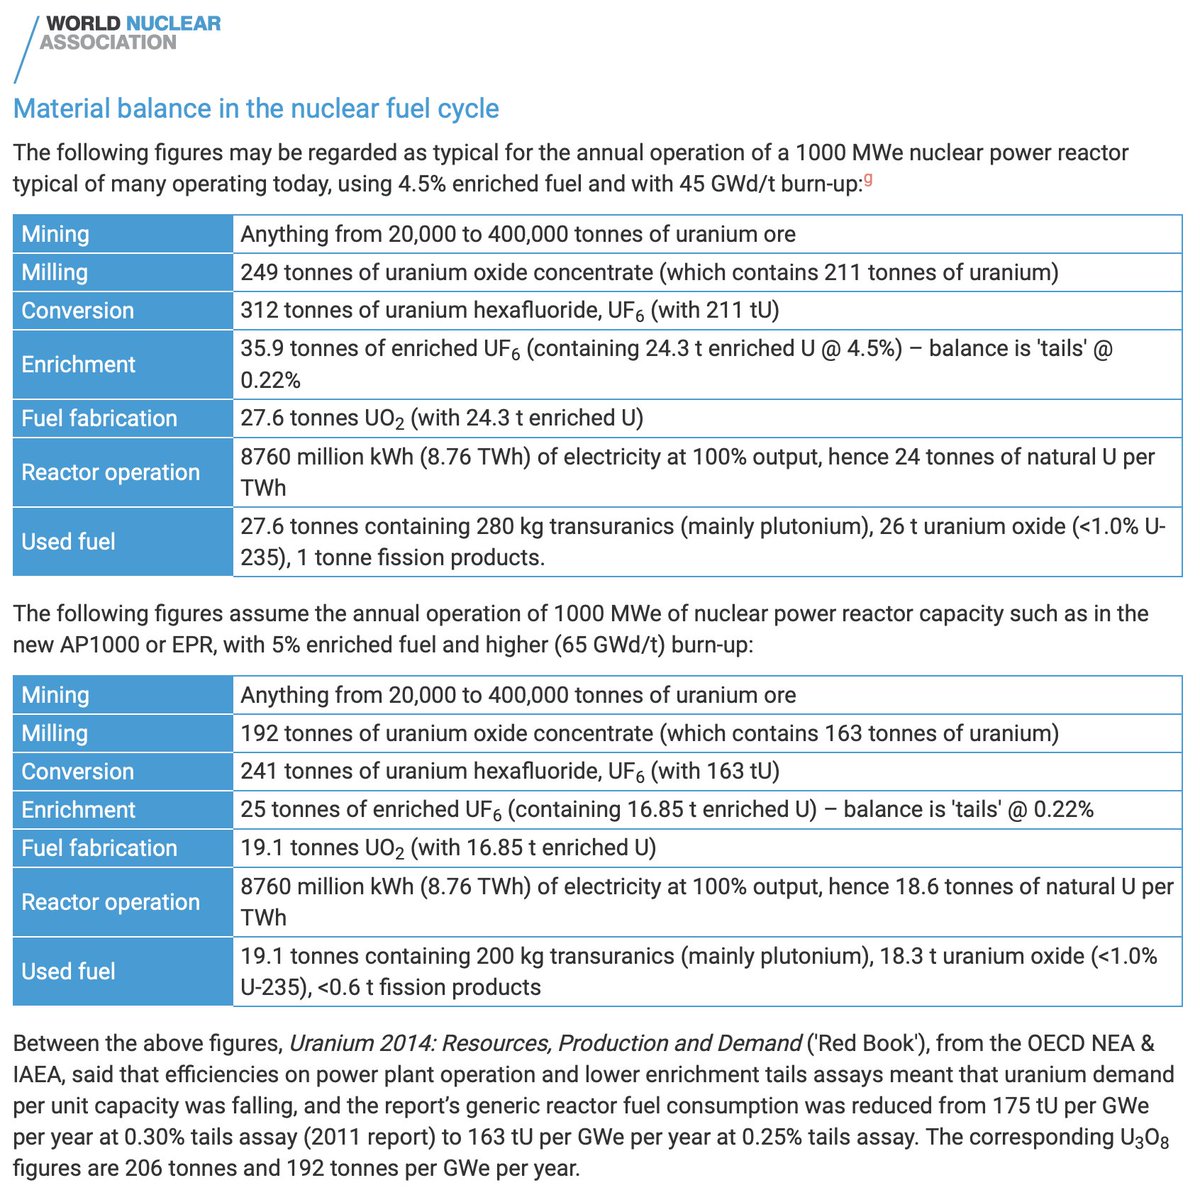
to make 1 TWh with nuclear, you only need ~3.4 tonnes of enriched UO₂. awesome eh!
…but to produce that you need 2,500 – 50,000t of uranium ore. (3-4 orders of magnitude more!)
remember, @BNW_Aus is very concerned about minimising the need for mining.
world-nuclear.org/information-li…
…but to produce that you need 2,500 – 50,000t of uranium ore. (3-4 orders of magnitude more!)
remember, @BNW_Aus is very concerned about minimising the need for mining.
world-nuclear.org/information-li…
…and that UO₂ doesn't make itself!
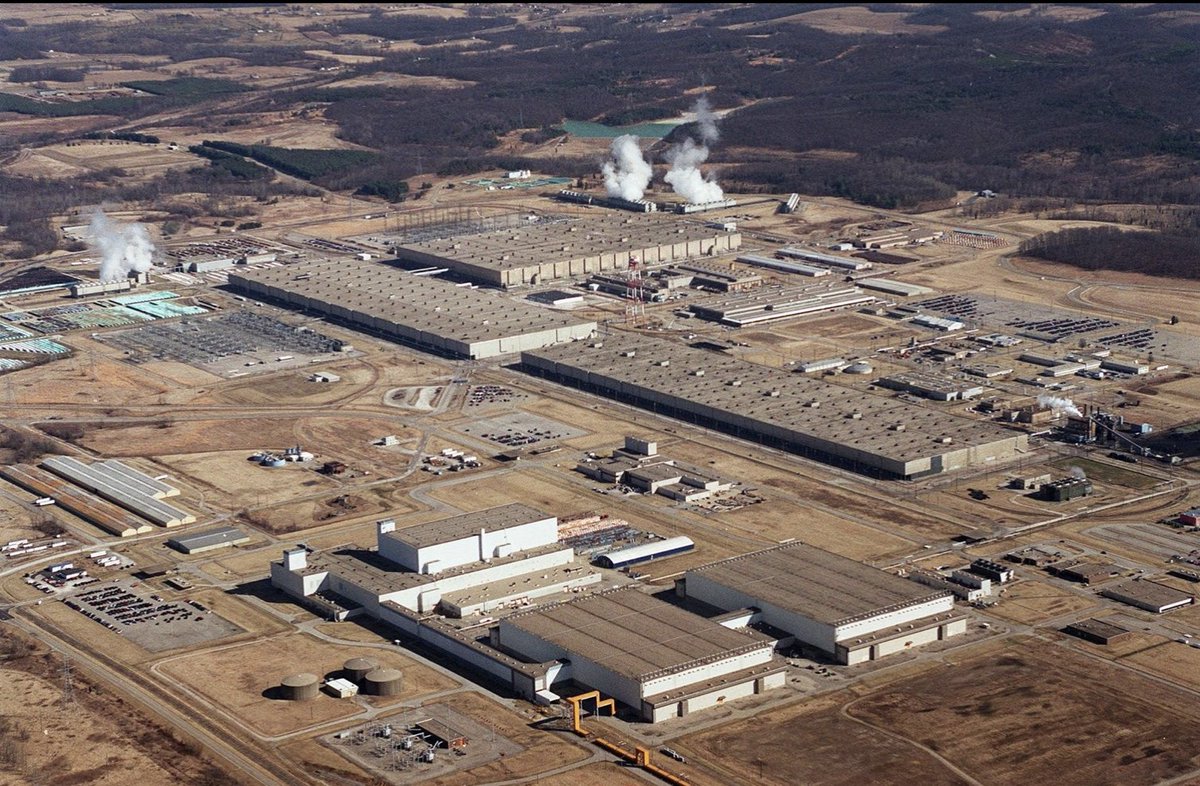
the nuclear fuel cycle includes significant 'upstream' infrastructure — like enrichment plants…
@BNW_Aus ignores this material.

the nuclear fuel cycle includes significant 'upstream' infrastructure — like enrichment plants…
@BNW_Aus ignores this material.
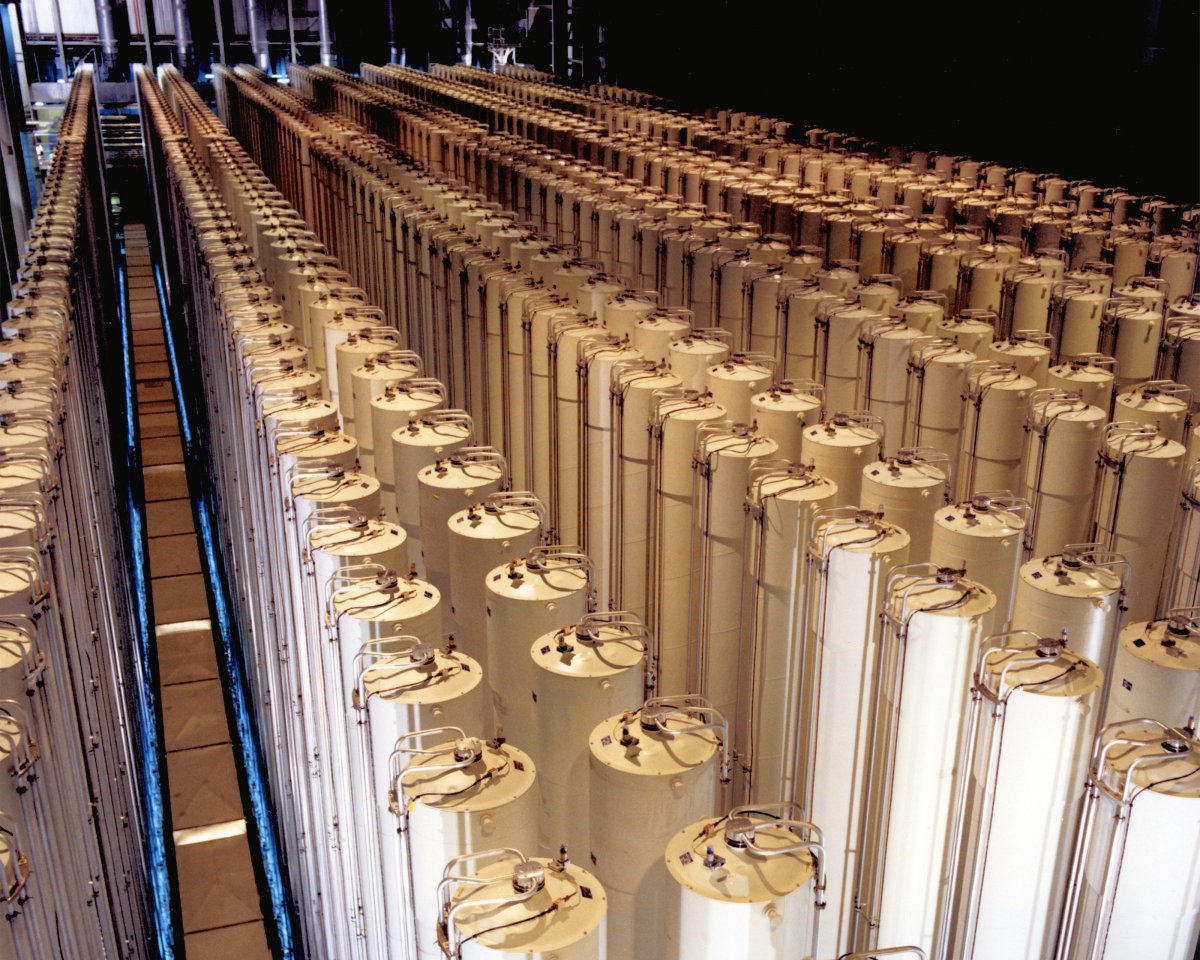
…and there are 'downstream' material inputs.
material is needed to manage the waste. in the US the high level nuclear waste (representing only 3% of the total waste) is put into concrete and steel storage casks — 100 tons a piece.
@BNW_Aus ignores this material.
material is needed to manage the waste. in the US the high level nuclear waste (representing only 3% of the total waste) is put into concrete and steel storage casks — 100 tons a piece.
@BNW_Aus ignores this material.
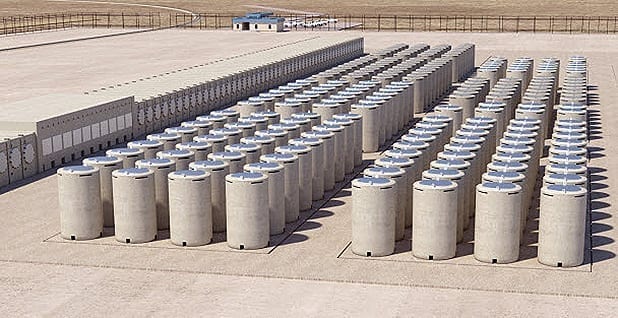
those storage casks are an interim solution — the US doesn’t yet know exactly what to do with them long term.
the finns🇫🇮 are putting their waste deep underground — into 3000 x 26 tonne copper & cast iron sarcophagi, entombed in bentonite clay.
@BNW_Aus ignores this material.
the finns🇫🇮 are putting their waste deep underground — into 3000 x 26 tonne copper & cast iron sarcophagi, entombed in bentonite clay.
@BNW_Aus ignores this material.
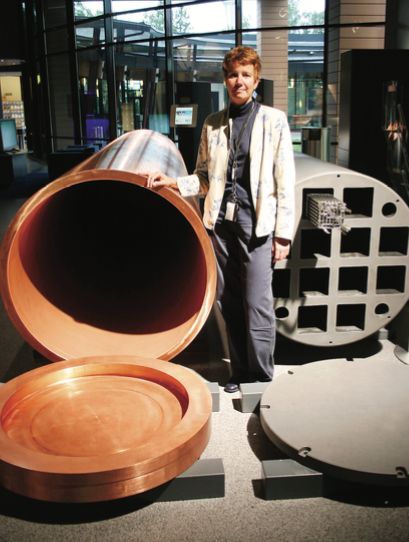
.@BNW_Aus ignores the significant material required produce nuclear fuel…
and the significant material required to deal with it when it’s “spent”.
and the significant material required to deal with it when it’s “spent”.
in their analysis, @BNW_Aus compares an imaginary *2002* solar farm — so very far from best practice — against *part* of a 49-year old nuclear power plant design that couldn’t be built today.
(amazingly, or not, they didn’t even know the ultimate source of their data.)
(amazingly, or not, they didn’t even know the ultimate source of their data.)
if a rigorous analysis were to be undertaken for a modern #nuclear power project, including those related to upstream and downstream operations, it’s quite possible that a modern #solar farm would now “win” this silly race.
tbf, @BNW_Aus didn’t invent this silly analysis. they copied it from @ShellenbergerMD, who similarly is sloppy with research and loose with the truth. 
beyond the scope of this thread, @BNW_Aus has made similarly questionable claims about #nuclear safety, waste management and project economics that do not fare well under critical examination.
beware the zealot.
beware the zealot.
(to all the nuclear stans that are about to clog my mentions:
i’m *not* saying nuclear sucks. not at all. it’s literally awesome. solve its problems and it'll reverse it’s decline.
what i am saying is, if you want to be taken seriously, lift your game!)
i’m *not* saying nuclear sucks. not at all. it’s literally awesome. solve its problems and it'll reverse it’s decline.
what i am saying is, if you want to be taken seriously, lift your game!)
• • •
Missing some Tweet in this thread? You can try to
force a refresh


