The latest weekly PHE Flu & COVID Surveillance Report is out. assets.publishing.service.gov.uk/government/upl… At first glance there's been a welcome flattening off of both cases and infectivity, but the age split shows that at older ages there are still increases. Case rates first.... 1/5
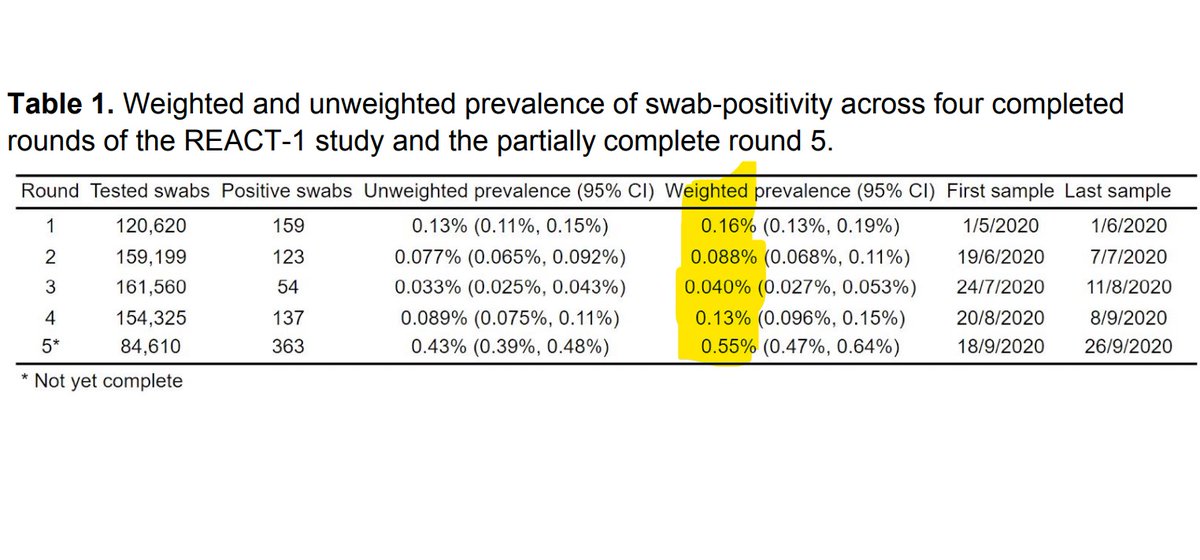
Now infectivity levels, for pillar 2 (community testing). Most are still rising steeply, except for younger ages. 2/5
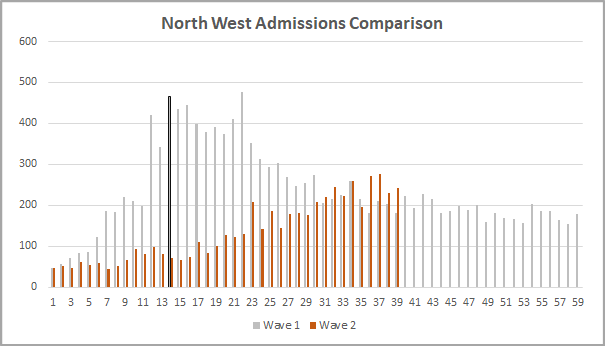
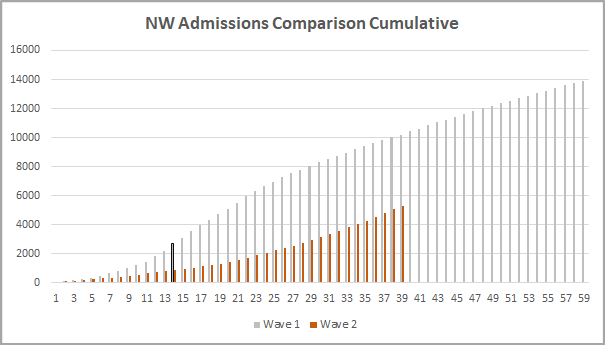
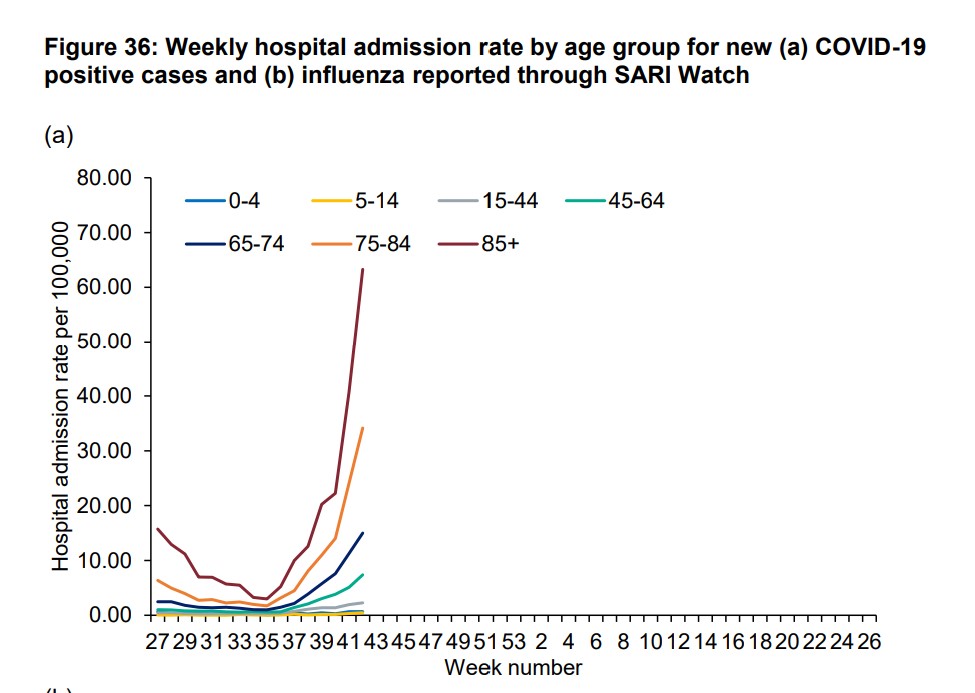
Admissions next, using rates per 100k, to allow for differing populations by region. It's still consistent with the picture @COVID19actuary has been sharing for some time now. The age split shows the concern over older age groups. 3/5
ICU COVID admissions are combined with flu, though you would barely notice the latter. Rapid growth, but as we've seen in the @ICNARC reports, not nearly as fast as in March thankfully. 4/5
Finally, and possibly a surprise, is the excess deaths graph, with no obvious sign of an excess yet, even though COVID registered deaths are increasing. I'll be watching this carefully, as excess deaths is my preferred measure to understand the impact of the pandemic. 5/5 ENDS

• • •

Missing some Tweet in this thread? You can try to force a refresh
 

Keep Current with John Roberts

John Roberts Profile picture

Stay in touch and get notified when new unrolls are available from this author!

Read all threads

This Thread may be Removed Anytime!

PDF

Twitter may remove this content at anytime! Save it as PDF for later use!

Try unrolling a thread yourself!

how to unroll video
  1. Follow @ThreadReaderApp to mention us!

  2. From a Twitter thread mention us with a keyword "unroll"
@threadreaderapp unroll

Practice here first or read more on our help page!

More from @john_actuary

23 Oct
The latest weekly report from @ONS on infectivity shows a further increase for England, with 433k (up from 336k) estimated to be infected in the most recent period. That's 1 in 130 (1 in 160), and with 35,200 (27,900) new infections per week. 1/6 Image
The regional trends are starting to show some variation, with some signs of levelling in the last couple of weeks for the worst affected regions. Wider confidence intervals make these more uncertain though, but hopeful signs maybe. 2/6 Image
By age there's a clear fall in early teens, a levelling off for younger adults, but still growth at older ages, albeit at a lower level. Those are the ages which matter in terms of hospitalisation though. 3/6 Image
Read 6 tweets
23 Oct
I'm uncomfortable with comparisons with the 1st wave - there's an implication that as long as numbers are lower, everything's OK, which I disagree with. But with numbers in the NW rising, how do admissions compare? 1/7 Image
At first sight much better. The peak day so far is much lower, and it's taken longer to get to even half that level. (I've assumed the peak was on D14 in the first wave as the later peak appears to be data catch up.) I'll discuss the current trend later. 2/7
If you look at the cumulative position, again we're well down on Wave 1. But interestingly, the total admissions are almost twice that seen by the first peak. They've just been much more spread out. Remember "flatten the curve" - it's clearly had a big effect this time. 3/7 Image
Read 7 tweets
20 Oct
A release from the CDC that I suspect one presidential candidate will find rather untimely. 300,000 excess deaths, a third of which are not directly attributed to COVID - that's a higher proportion than in the UK. 1/4 cdc.gov/mmwr/volumes/6…
Media comment already noting that the 25-44 group has been hit hardest. Maybe in terms of % increase, but given very low death rates at younger ages, I'm not sure I'd agree with that view. 2/4 Image
The disparity by ethnicity that we see here is repeated, but just looking at the graphs even more so. 3/4 Image
Read 4 tweets
1 Oct
The @imperialcollege #REACT Survey has published an interim report of its 5th round. The headline is that it suggests R has fallen sharply in recent weeks, and could now be around 1.1 . Let's take a more detailed look... 1/9
The interim report covers 85,000 samples over the period 18th-26th Sept, so is very up to date. It found 363 positive samples, an infectivity of 0.55% (over 1 in 200) , consistent with the latest @ONS report. That's the highest since the survey started in May. 2/9
Round 4 put R at 1.7 for late Aug/early Sep. These results show a clear slowing, and the report notes other indicators (eg calls to the NHS) are consistent with this direction. The CI is wider though as this is an interim report, so the sample size is reduced. 3/9
Read 9 tweets
28 Sep
The @ONS is producing some terrific analysis regarding COVID-19. Today's release provides some maybe predictable, and some maybe surprising, findings regarding the recent spread. Let's start with deprivation. 1/7 Image
We know that in the first wave, the virus took a greater toll on those from more deprived areas, both in terms of incidence and outcomes. But there's a very clear reverse now for incidence, with the most affluent areas driving the increase. 2/7
Digging a bit deeper, it's also clear that it is those under 35 and are more affluent for whom infectivity is rising quickest. For over 35's there's not much difference by deprivation. 3/7 Image
Read 7 tweets
25 Sep
The latest admission for England has topped 300 today, and again a question raised is are these "WITH" COVID or "FROM" COVID? Just like yesterday's analysis of deaths, let's dig into this question a bit... 1/7
First of all, note that any elective admissions, ie for planned surgery, is preceded by a COVID test. If it's positive, the admission doesn't happen. So the only cases that might by chance test positive are emergency admissions for what are believed to be non COVID reasons. 2/7
There are approx 15k such admissions a day. What proportion of them might test positive, yet be totally unrelated? The latest ONS figures give a clue, suggesting that 1 in 500 now has the virus. That would suggest 30, out of the 300 cases. 3/7
Read 7 tweets

Did Thread Reader help you today?

Support us! We are indie developers!


This site is made by just two indie developers on a laptop doing marketing, support and development! Read more about the story.

Become a Premium Member ($3/month or $30/year) and get exclusive features!

Become Premium

Too expensive? Make a small donation by buying us coffee ($5) or help with server cost ($10)

Donate via Paypal Become our Patreon

Thank you for your support!

Follow Us on Twitter!