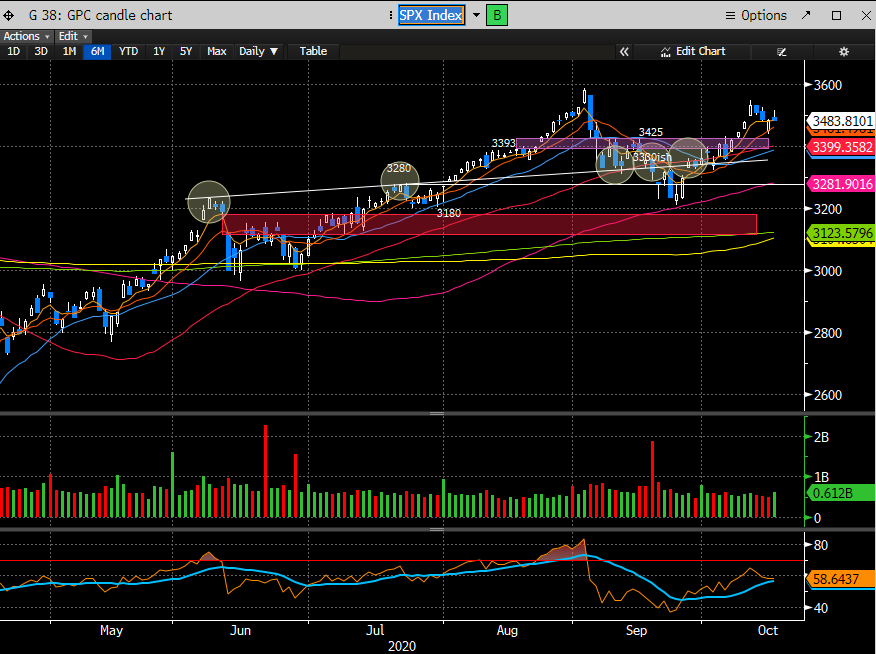
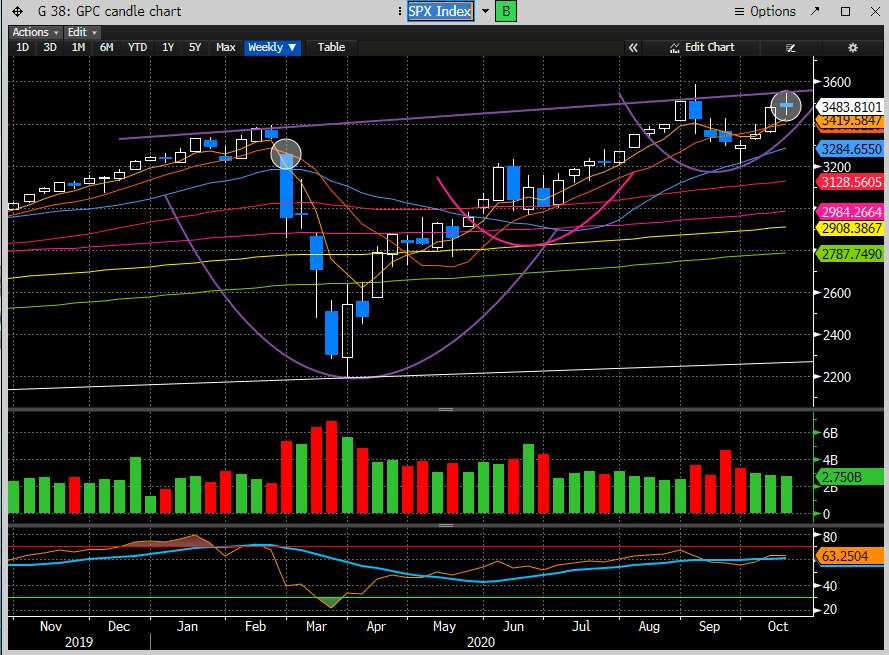
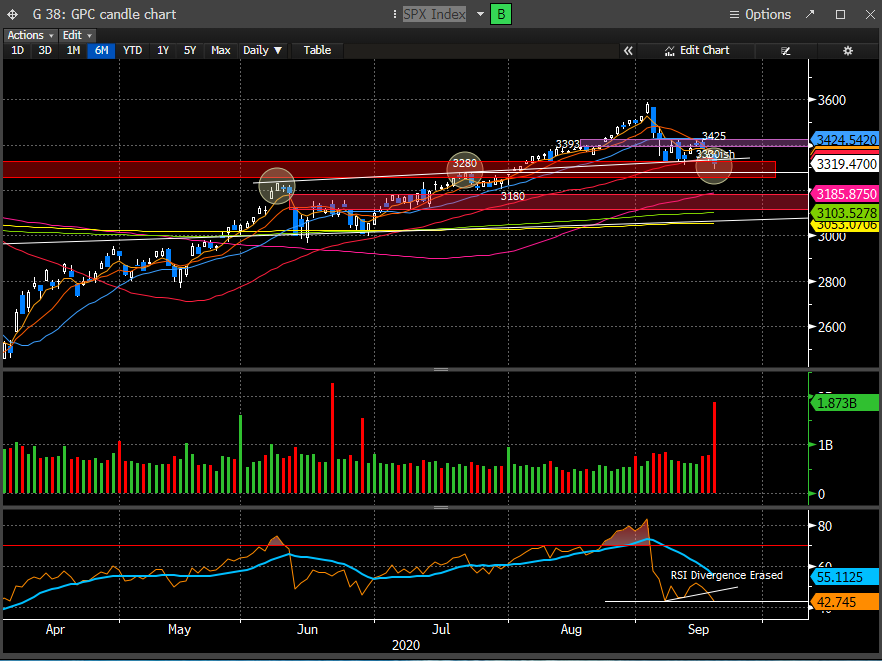
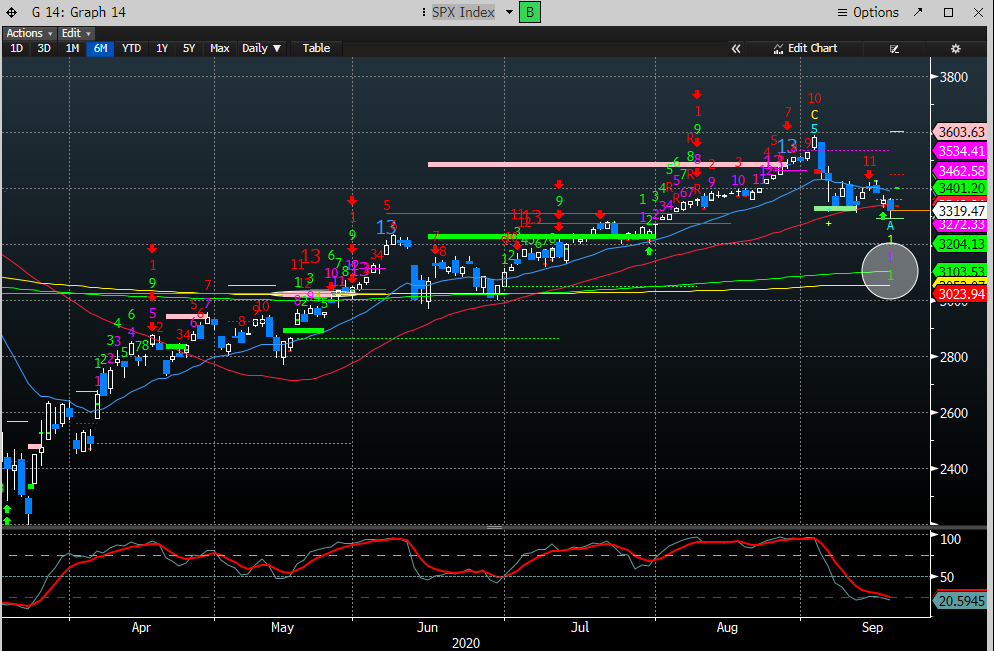
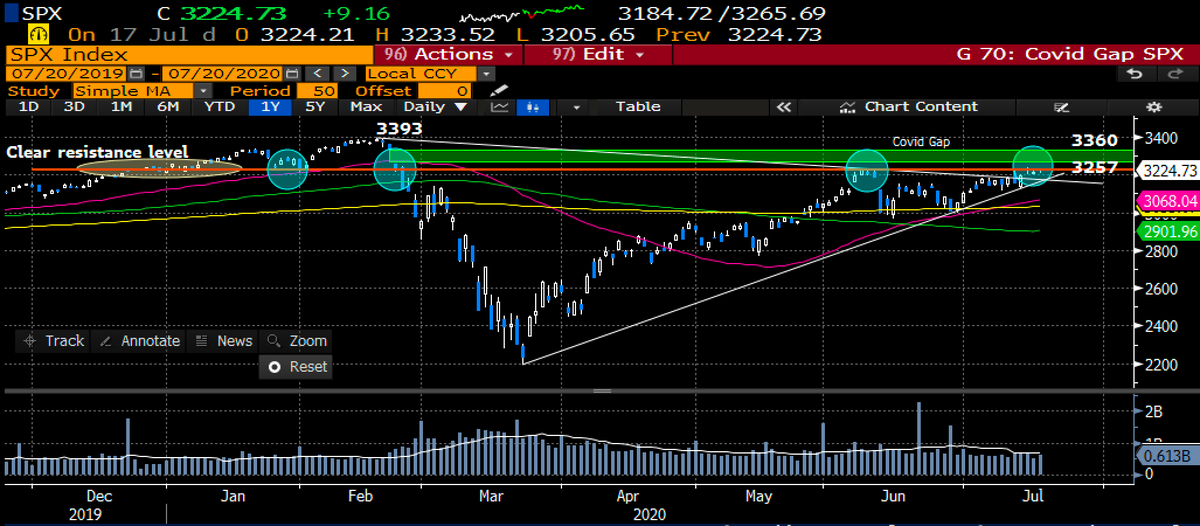
#stockmarket WE update. As I've been discussing for wks, the mkt would remain choppy into the election & it has. resolution feels closer but not there yet. Friday was constructive but still some issues ST. $SPY now bumping up against the Asc Triangle & back above key MA's...
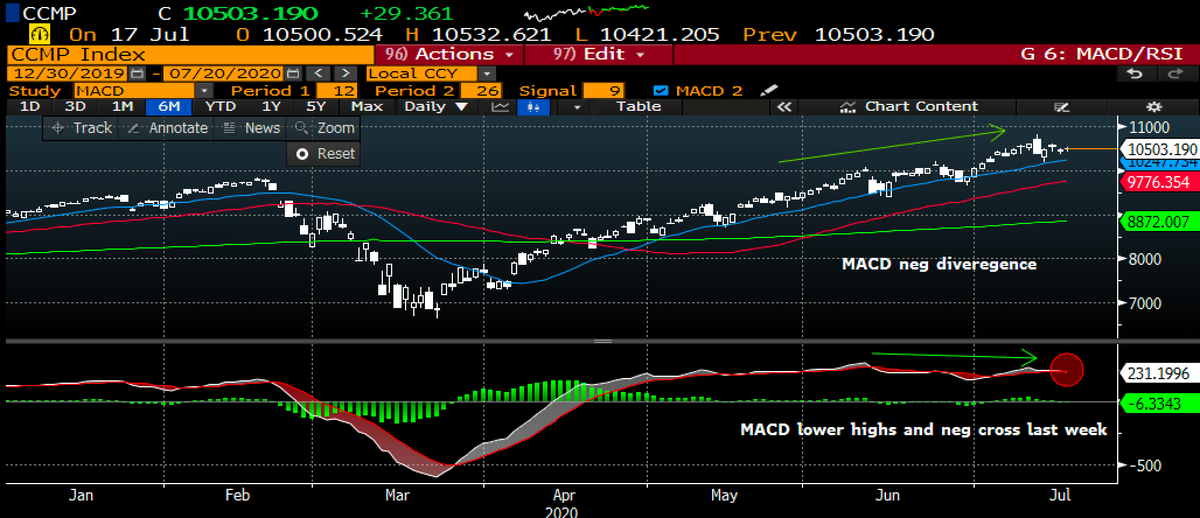
#stockmarket #Nasdaq is similar & held an important level. threatening to break the Asc Triangle formation and also above key MA's...
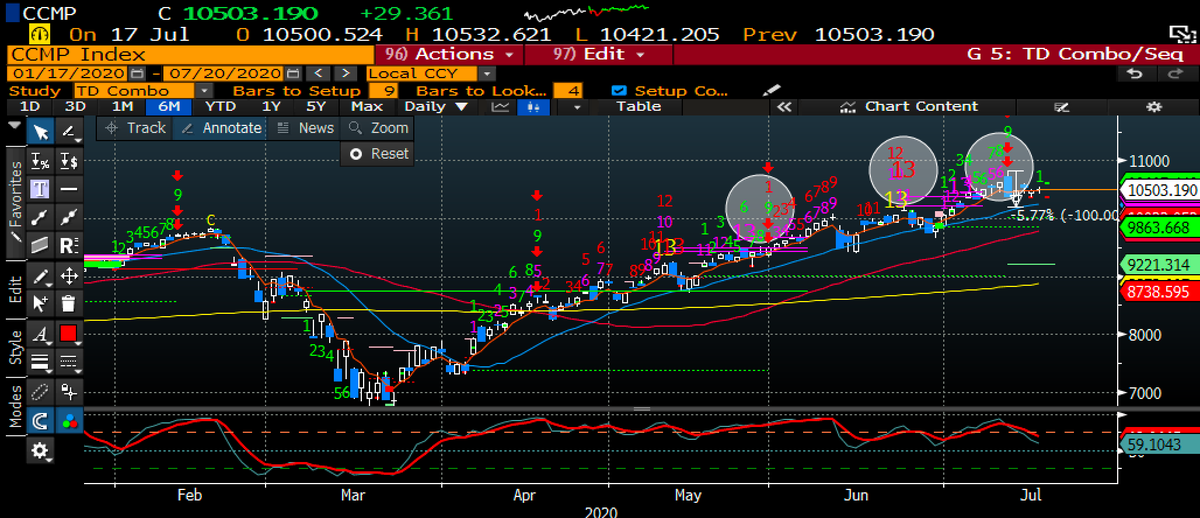
#stockmarket fly in the ointment for tech and the #NASDAQ is that a weekly Demark 13 did print last week to go with the $NDQ 13 sell last wk. not much on the daily. keep in mind these signals can be good for 12 weeks so doesn't mean we will turn down immediately but we can.....
#stockmarket Smart money Index looks awful and fairly concerning for bulls as it broke my channel to the downside. That said, new 13 Demark buy so turning up here could add fuel to the next rally....
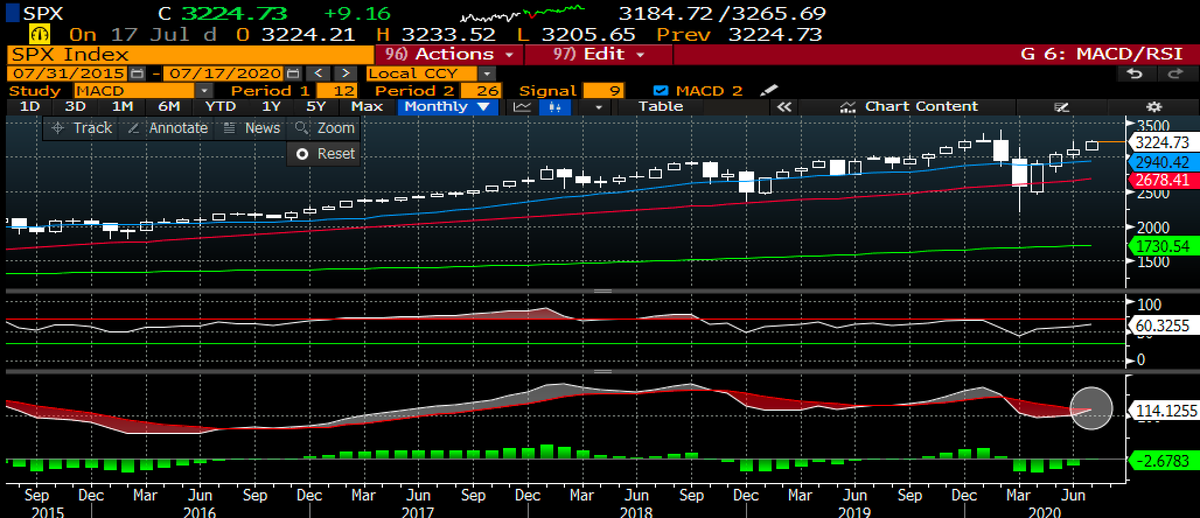
#stockmarket Daily Bollinger bands for #SPX #NASDAQ both look fairly healthy as it tested Mid BB and now closed above the 8day EMA....
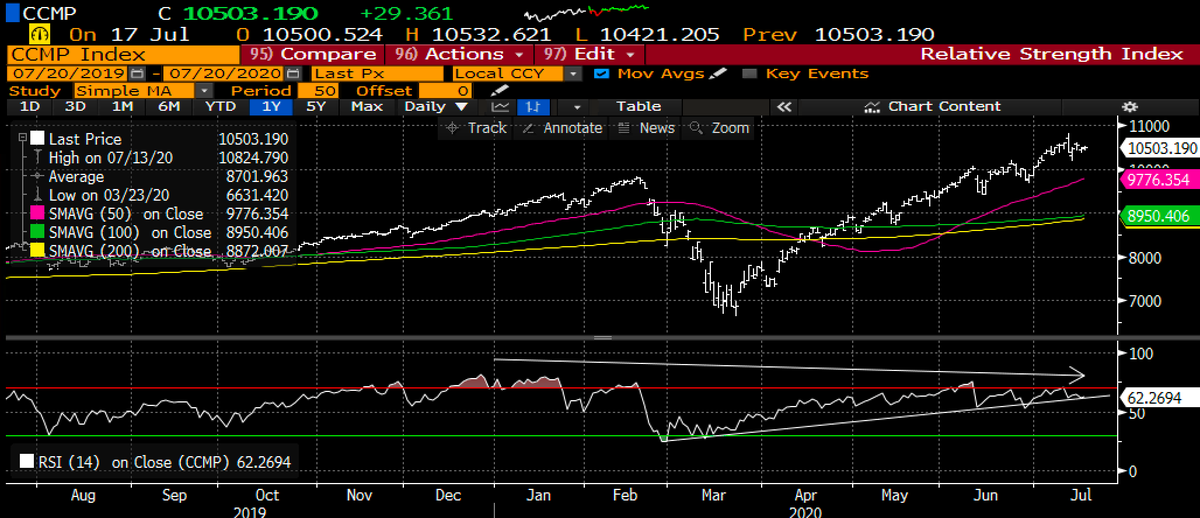
#stockmarket Daily RSI for the #SPX & the #NASDAQ also look healthy to me, backtesting the breakdown level and bouncing....
#stockmarket no surprise though the momentum is fading and now the MACD's for the #SPX and #NASDAQ threatening to cross down....
#stockmarket clearly the AD/Decline breaking out to new highs is bullish, BUT new Demark 13 sell on Friday so a turn down here could start a retracement....
#stockmarket HiLo Index backed off considerably & is understandable given the recent mkt weakness. Overlaid w/ Demarks & the 9 sell caught the recent swing high and now a 9 buy. maybe this starts to lift which would obviously be bullish....
#stockmarket DMI's for both the #SPX and #NASDAQ are uninspiring, w/ a new neg cross & the ADX making new lows. Basically this means the mkt is non-trending, BUT from such a depressed ADX lvl, usu you see reversion but timing here is suspect & trend direction is unclear....
#stockmarket I posted this chart last week as a reason to be Intermediate term bullish as it continues to trend upward. $XLY vs $XLP - measure of risk in the mkt. still looks good to me....
#stockmarket I also posted this chart of the Valueline index which is battling an important level. a break higher would be very bullish and rotation theme supportive. Zoom in and it seems like it broke the bull flag. Unfortunately, it also printed a new Demark Combo 13 sell...
#stockmarket equal weight #SPX has outperformed lately and threating to break this consolidation its been in since March. Unfortunately, it also has a new Demark seq 13 sell. Turning down here would put some cold water on that rotation theme gaining traction...
#stockmarket Concl: I wish I had better things to say. mkt seems like it wants to break higher but we are also at the mercy of stimulus headlines & election noise. I have bullish indicators flashing, but also bearish ones. this wk, better to remain light, take trades & be patient

• • •

Missing some Tweet in this thread? You can try to force a refresh
 

Keep Current with CoiledSpringCapital

CoiledSpringCapital Profile picture

Stay in touch and get notified when new unrolls are available from this author!

Read all threads

This Thread may be Removed Anytime!

PDF

Twitter may remove this content at anytime! Save it as PDF for later use!

Try unrolling a thread yourself!

how to unroll video
  1. Follow @ThreadReaderApp to mention us!

  2. From a Twitter thread mention us with a keyword "unroll"
@threadreaderapp unroll

Practice here first or read more on our help page!

More from @coiledspringcap

18 Oct
#StockMarket WE update: recent Demark 13 sell I posted this wk marked the swing high & choppiness ensued. Fri was ugly but could be opex related so for now just expecting more of the same unless stimulus resolution breaks us out or down. set up seems bullish but needs to confirm
#stockmarket Demark Trendfactor lvls continue to be a good guide. 13 sell peaked @ 1x up lvl, & found support on 1/2 lvl down. see white boxes for up lvls & blue for down lvls in chart above. daily #SPX chart below also showing a close right @ 5 day EMA on Fri....
#stockmarket #SPX $SPY weekly chart ended w/ a doji candle which shows indecision, & intuitively makes sense given the impasse over stimulus. To me this chart is intermediate term bullish - Large C&H w/ resistance at the B/O point. could it break down from here? sure...
Read 20 tweets
11 Oct
#stockmarket WE update. Sometimes when everything seems to be working, breaking out, acting as it should or we hope, IMO, means things are getting too easy. My gut says we are there & time to retrench a bit. Last wk pump job screwed the bears but could mean now we fall harder....
#Stockmarket hard to know how this shakes out but as you can see in this thread, my indicators are flashing yellow. $INDU currently w/ first Demark Seq 13 sell last wk since the low & new aggressive seq 13 w/ so sto overbot. also hitting wkly resistance. but Prop up tgt =29526...
#stockmarket #SPX also w/ a Demark Seq 13 sell looming if trade +3509. Slot sto also overbot. upside & downside Trend factor lvls in white boxes. 3rd D-wave tgt @ 2975. currently hitting 1.5x upside level....
Read 15 tweets
9 Oct
hmmmmm ImageImage
volume 👌 Image
boom! HOD Image
Read 4 tweets
21 Sep
#StockMarket I hope you all had a great WE. Some quick mkt thoughts as head into a new wk. Last WE I suggested a break of 50day/wk low could yield #SPX 3280ish, we reached 3292. RSI divergence was erased; next Demark Trend Factor levels: 3262 & 3200 (coincides w/ 3180 area)....
#StockMarket #SPX I also mentioned the pot'l for a midwk turnaround on Demark exhaustion signals but early wk strength negated the count & has now started over. the Naz also erased its count & now has a Demark propulsion down tgt of 10470. still looks very vulnerable....
#StockMarket #SPX did close below the important 10wk for the first time while the Naz closed below for the 2nd wk in a row = not bullish....
Read 12 tweets
19 Jul
#StockMarket officially back from Vaca & back in the saddle. The call last week to fade $QQQ was the correct one. -5.7% peak to trough, & the argument for rotation pot'l also occurred. That said the mkt is stubbornly resilient and tough to be too bearish, yet i remain cautious:
#StockMarket $QQQ weekly ugly candle on elevated volume and last time we saw that happen, more weakness ensued. RSI continues to neg diverge & now threatening to break the RSI trend line. MACD neg divergence as well w/ recent lower high and neg cross again....
#stockmarket #SPX looks much better and arguably looks and feels like wants to break out. meaningful supply zone ahead to be aware of w/ a break higher of last wk high, w/ new tgts 3257 and Covid gap resistance of 3360. pot'l for SPX +MACD monthly cross soon = bullish MT....
Read 17 tweets

Did Thread Reader help you today?

Support us! We are indie developers!


This site is made by just two indie developers on a laptop doing marketing, support and development! Read more about the story.

Become a Premium Member ($3/month or $30/year) and get exclusive features!

Become Premium

Too expensive? Make a small donation by buying us coffee ($5) or help with server cost ($10)

Donate via Paypal Become our Patreon

Thank you for your support!

Follow Us on Twitter!