
1/13 Really interesting read Rory. Thx for sharing. I agree, its v difficult to remain clear headed when theres so much data & it can all be interpreted in different ways. Prof. @AndrewEwing11 is unhappy with #Sweden's strategy and has been openly critical - he's entitled to that
https://twitter.com/ohanloncmr/status/1320789726052405251
2/13 I think that data is being represented in a way that suits the narrative.I added extra columns:"since Aug 7" & "since Sept 7".I used Oct 14 as end point (date of publication).I also highlighted Netherlands in red as it was best performing in the table and good for comparison 
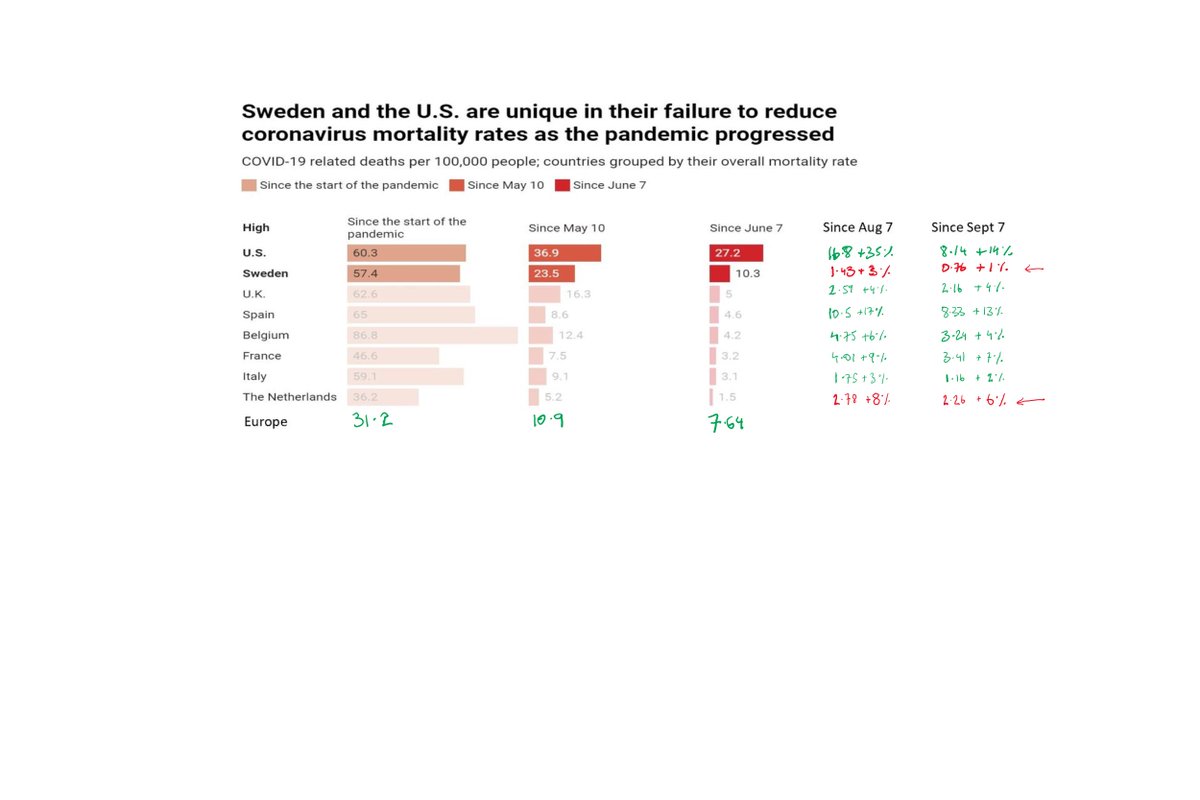
3/13 In Sweden from Aug to Oct there was a 3% increase in cumulative deaths per 100k and from Sept to Oct there was a 1% increase. Meanwhile, Netherlands (best of the worst) had 8% & 6% increases in cumulative deaths per 100k respectively.
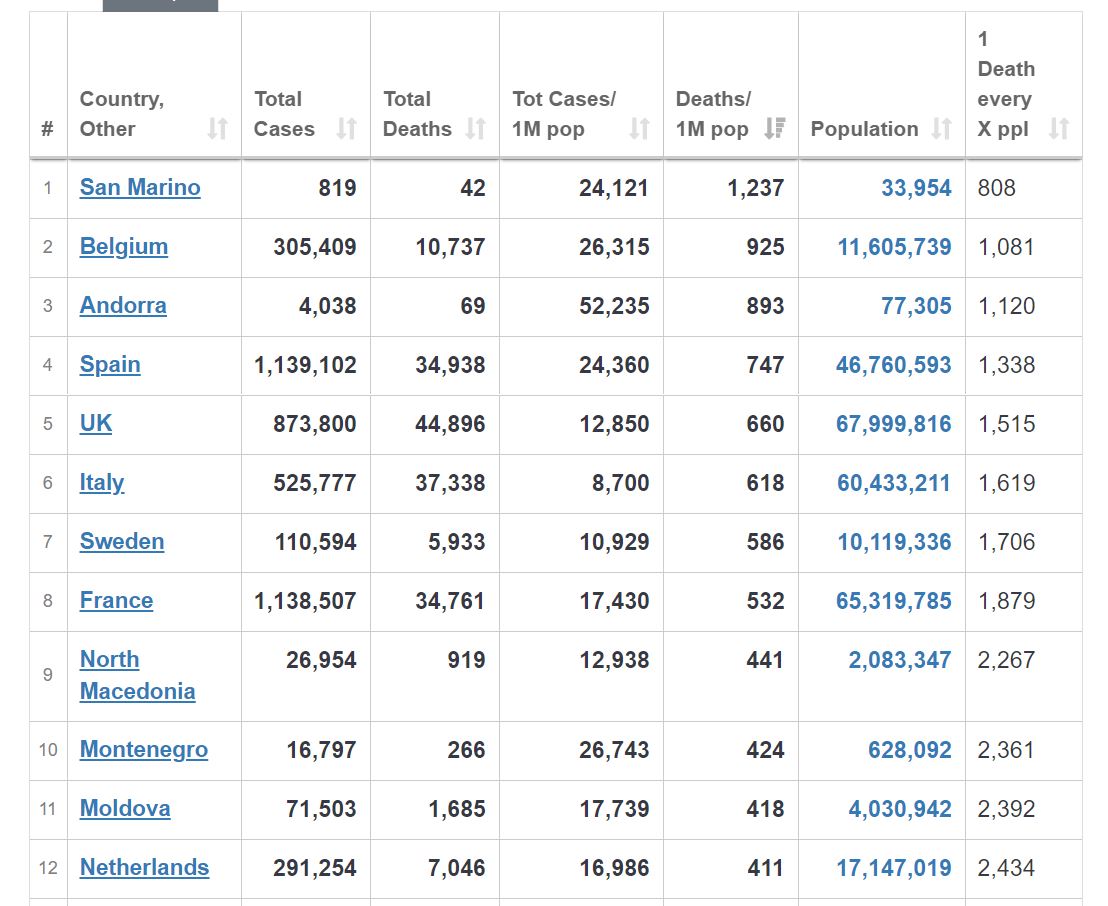
4/13 I think Sweden compares well, all things considered, when metrics such as deaths per million and 1 death per X people are analysed - its certainly in the same ball park as most of those other countries in the first chart 


5/13 Of course, it was very difficult in Sweden in March/April/May/June and just like nearly every country major mistakes were made in context of nursing homes and similar facilities, as Prof @AndrewEwing11 says 
6/13 ourworldindata.org/grapher/covid-… Difference between Sweden & others is absence of hard #lockdown employed nearly everywhere else. By my count, since March 9 Sweden had 4 tightening & 1 easing of restrictions. Over same period Netherlands had 8 tightening and 3 easings of restrictions
7/13 It'll take time for data to come in but as clinicians we know and can see the effects of #lockdown on #cancer referrals;#cancerscreening;#cardiac screening;#mentalhealth;elective #orthopaedic #surgery;#cataract surgery;mental health; suicide rates and so on @DonnellyStephen
8/13 Article also references economic destruction - but this must be very location and economy structure specific as Sweden and Netherland are equal: -8.3 & - 8.5% respectively, while Ireland and New Zealand are -6.1 & -12.2% respectively
9/13 Sweden must have had less of the public anxiety; trauma; social & health consequences associated with lockdown and yet perform comparatively with many countries which have had very harsh lockdowns to endure.
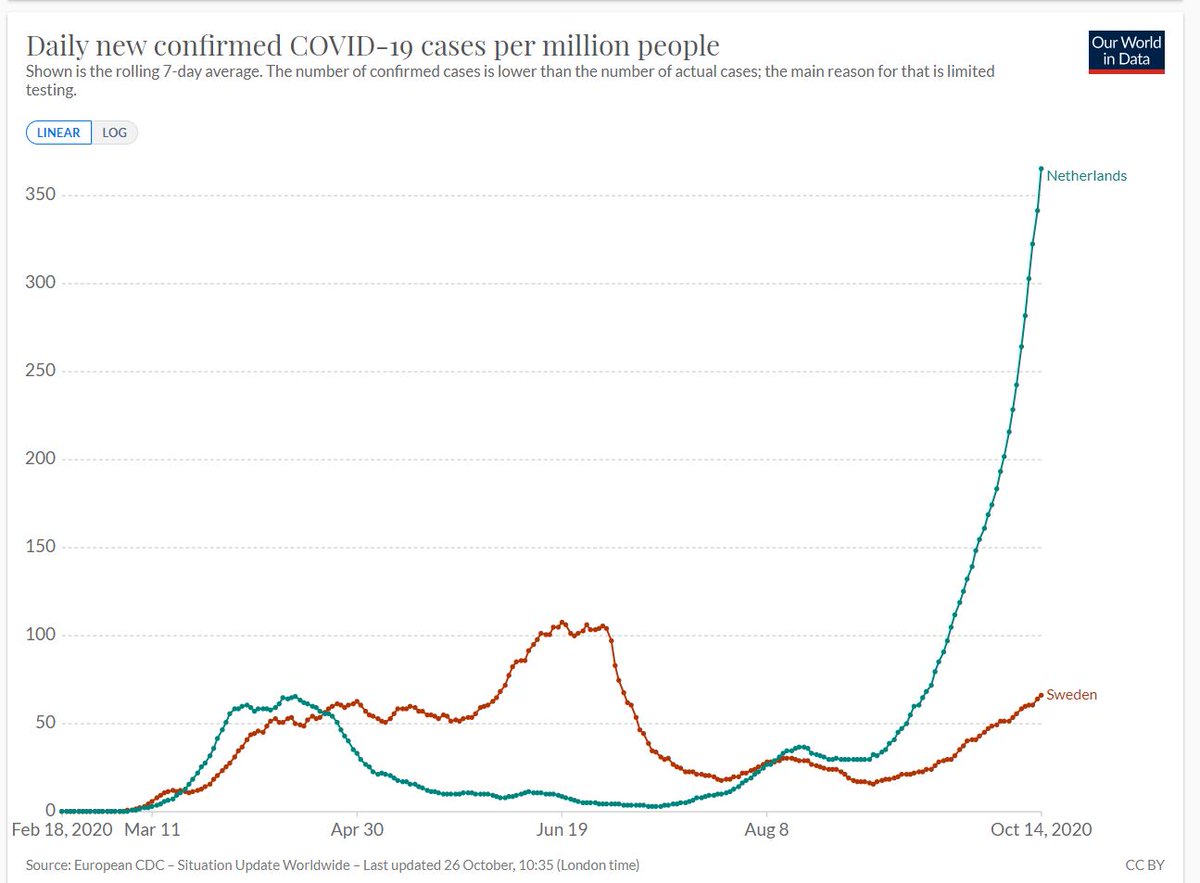
10/13 Re rising case numbers: consistent with all of Europe (while virus becomes endemic?) and favourable with Netherlands, even though Sweden has done 17% more tests per 1M population. This also ignores the obvious issues with PCR testing sensitivity threadreaderapp.com/thread/1320347… 


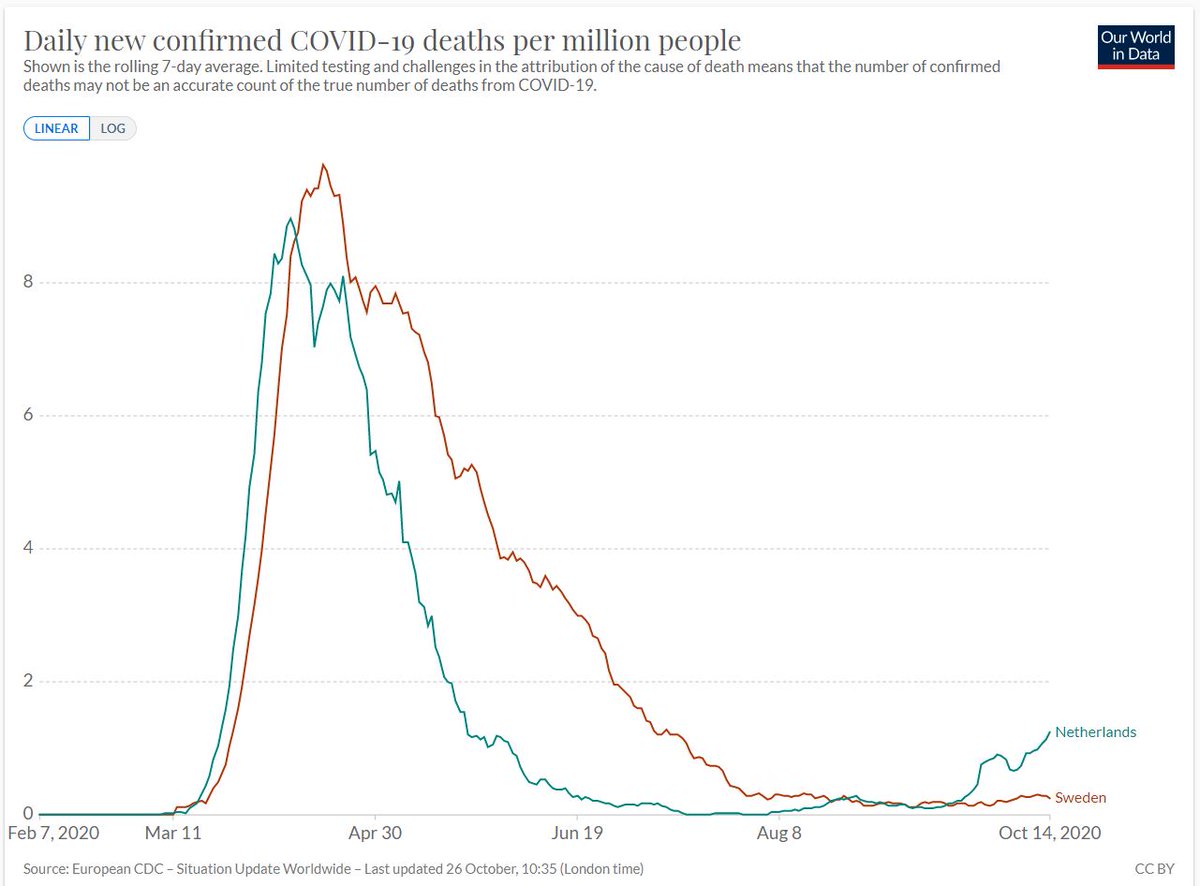
11/13 Sweden had its own issues but while we lurch from crisis to crisis with renewed restrictions in effort to keep "case" numbers under control,in Sweden their statistics for daily deaths per million in the last few months are better than Netherlands(again just for comparison!) 
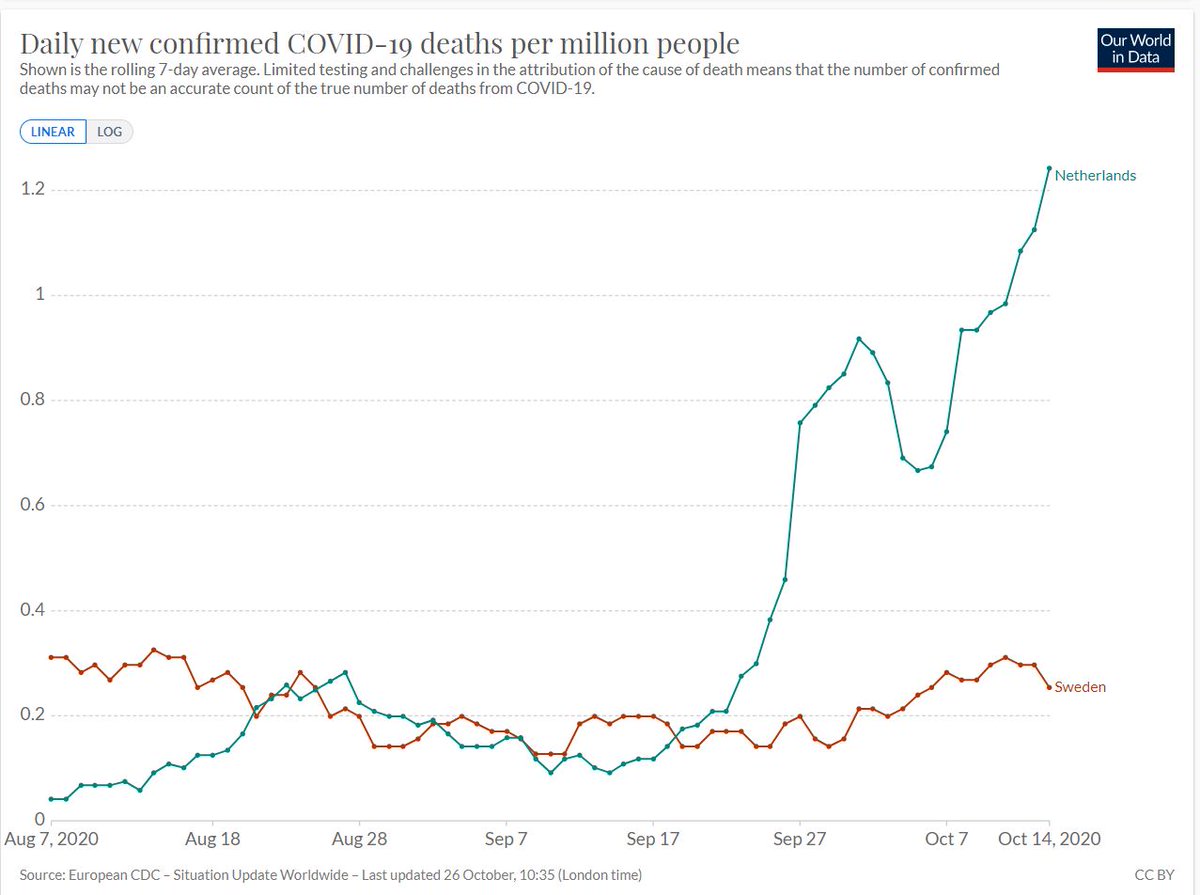
12/13 In Sweden there seems to be a plan other than revolving lockdown. Prof @AndrewEwing seems to think their strategy in unsustainable. I think that our "on again, off again" approach is even less so. How much harm can the population sustain? Sweden looks good to me. 
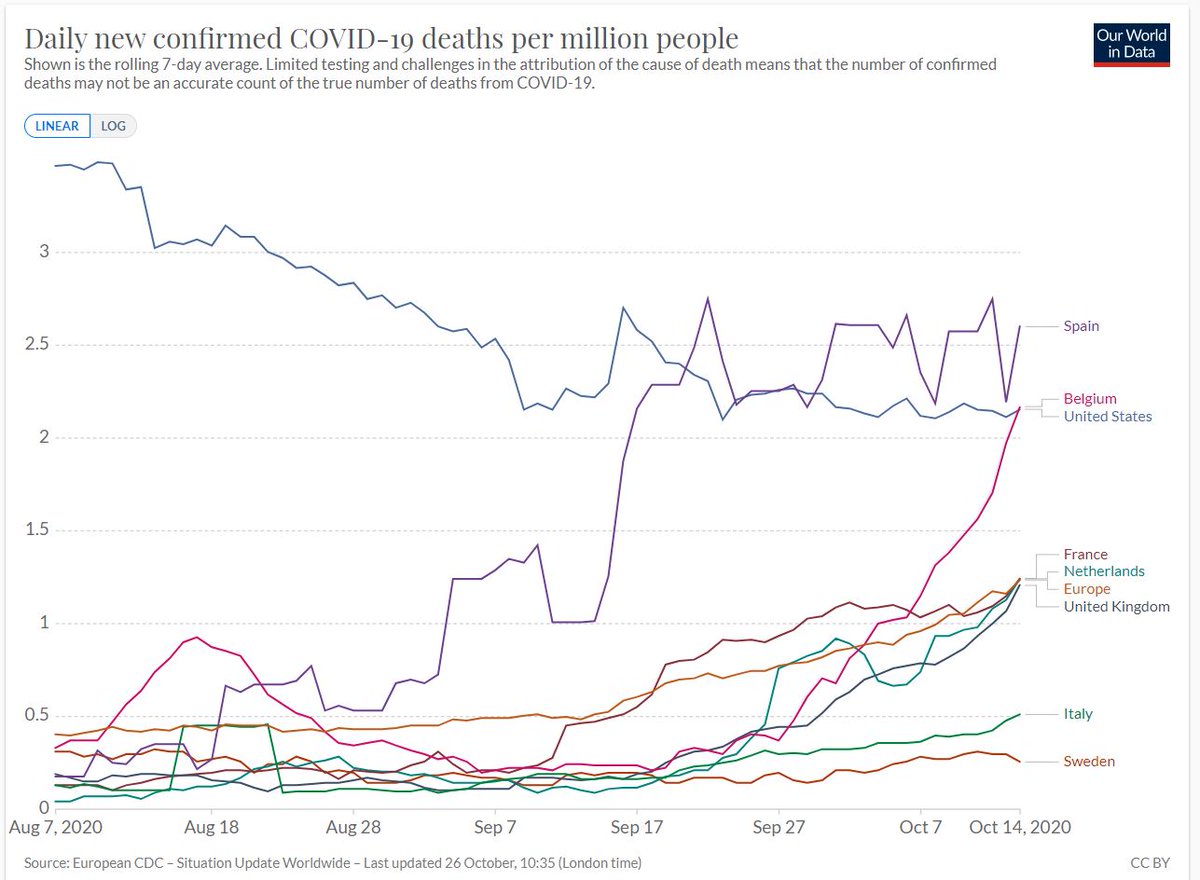
13/13 While @HSELive @roinnslainte #NPHET forgot tracing,ignored salivary antigen option & ICU beds(needed EVERY winter) & made no plans for yearly winter spike in resp illness; Sweden was managing cases among young & fit population while trying to protect its older & vulnerable
• • •
Missing some Tweet in this thread? You can try to
force a refresh


